In this article, the PlanB analyst further validates the basis of the current S2F model by removing the time factor from itand adding other assets to the calculation (silver andgold). He called this new variation of the model «S2F cross-asset» (S2FX). The S2FX model allows you to value various assets such as silver, gold and bitcoin using one formula.
“The main thing in science is not so much the acquisition of new facts as the discovery of new ways of understanding them,” William Lawrence Bragg.
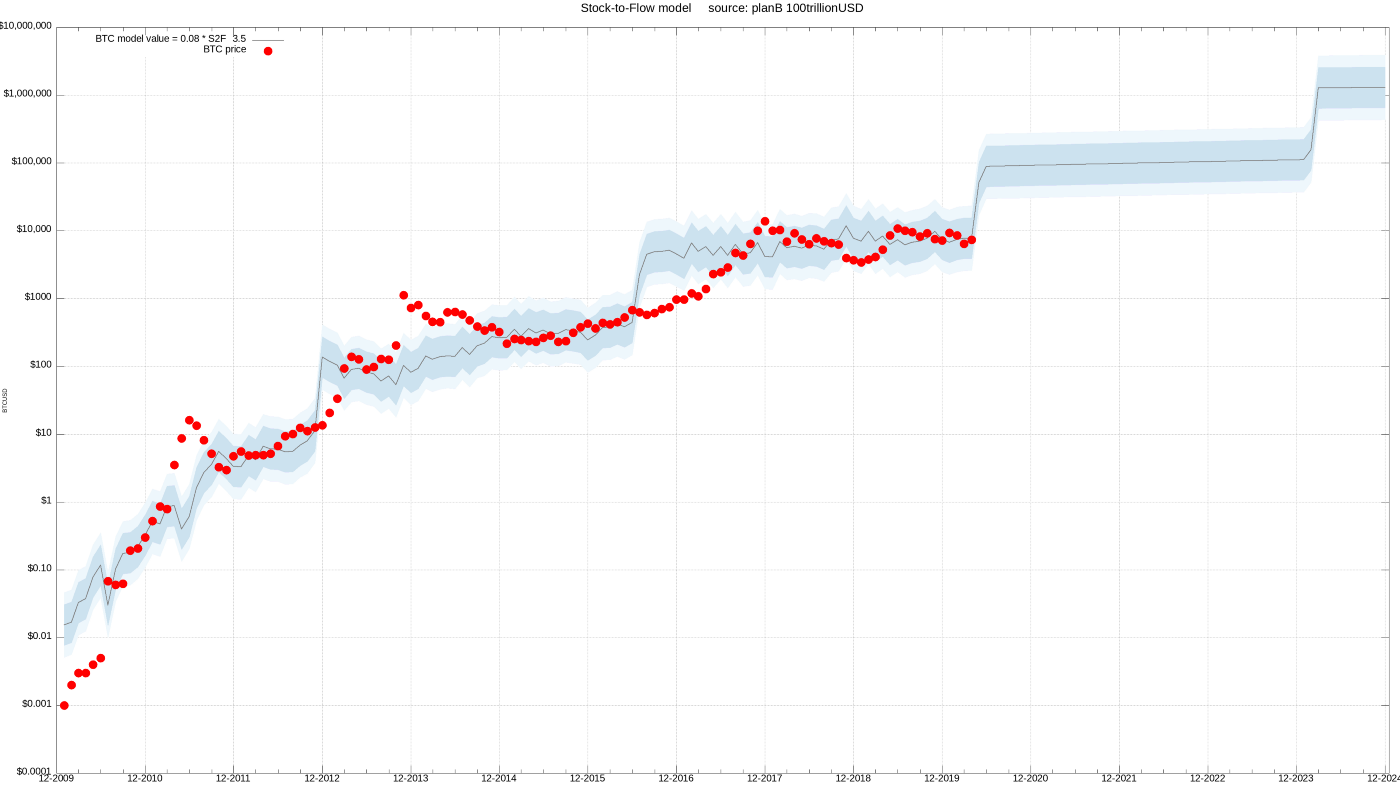
Bitcoin's Stock-to-Flow (S2F) model for the first timepublished in March 2019. The original S2F-model is a formula based on monthly data on the ratio of the number of new issued digital coins to existing ones (Stock-to-Flow coefficient) and the price of one coin. Because data points are indexed chronologically, this is a time series model. The S2F model has interested many and has activated quantitative analysts around the world. Many checked and confirmed the absence of a false connection between the modeled within the framework of S2F and the actual price of BTC [1, 2 (eng.), 3 (eng., PDF), 4 (eng.)].
Current S2F Model
If you are not familiar with the S2F model, I highly recommend reading the original article, because it explains the basic prerequisites for creating the model and terminology.
In this article I further confirm the basiscurrent S2F model by removing the time factor from it and adding other assets (silver and gold) to the calculation. I called this new variation of the model «S2F cross-asset» (S2FX). The S2FX model allows you to value various assets such as silver, gold and bitcoin using one formula.
I will begin by describing the concept of phase transitions as a new approach to the perception of BTC and S2F. This explains why the new S2FX model is so important.
Next, I will go on to describe the S2FX model, how it works, and how to interpret its results.
Phase transitions
Phase transitions are an important concept forunderstanding of the S2FX model. In the process of phase transitions, the properties of things change completely. Often such transitions are intermittent. Here are three examples of phase transitions:
- Water
- U.S. dollar
- BTC
Water
A classic example of phase transitions iswater. Water exists in four different phases (states): solid, liquid, gaseous, ionized. All this is water, but in each phase water has completely different properties.

Different materials change state at different temperatures: solid —> liquid —> gaseous —> ionized.
U.S. dollar
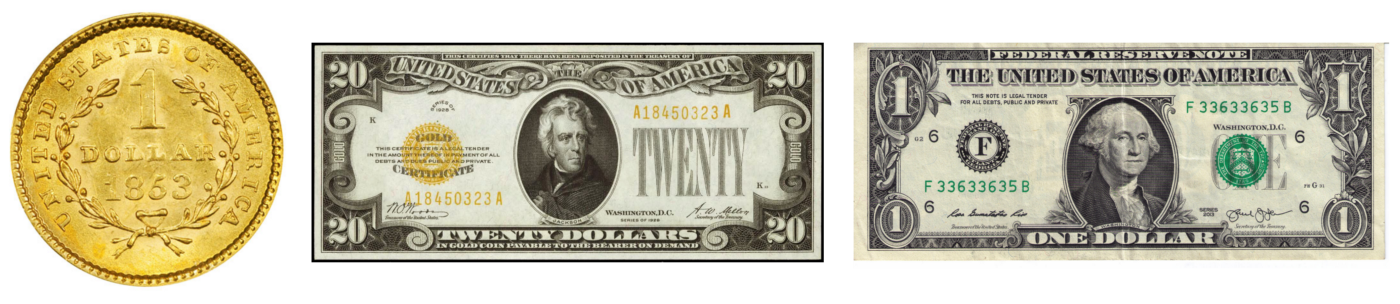
Phase transitions are also taking place in the field of finance.For example, the US dollar has undergone a phase transition from a gold coin ($1 = 371.25 grains of fine silver = 24 grains of gold), through a paper note backed by gold («gold coins payable on demand to the bearer of that note« 187;), to a paper banknote that is not backed by anything («This banknote is legal tender for settlements on all debt obligations, private and public»). The name remains the same, but in each of these phases the dollar has a completely different meaning.
BTC
The same is true for BTC. Nick Carter and Hasu in their 2018 study showed how narratives and perceptions of BTC have changed over time.

How did the basic concepts of Bitcoin change over time
On the chart, these Bitcoin narratives looksmooth and continuous. However, if you combine this data with financial milestones (and then with S2F and price data), they will more closely resemble separate phases with much sharper transitions between them:
- “Proof of Concept” —> after the publication of the Bitcoin whitepaper
- “Payments” —> after parity in price with USD (1 ₿ = 1 $)
- “Digital Gold” —> after the first halving and approaching price parity with gold (1 ₿ = 1 ounce of gold)
- “Financial asset” —> after the second halving (transactions of more than $1 billion per day, legalization in Japan and Australia, opening of futures markets on CME and Bakkt)
The concept of phase transitions shown here onAn example of water, the US dollar and Bitcoin, offers a new look at BTC and its S2F model. It is important to evaluate the situation not only in terms of continuous time series, but also in terms of separate phases with pronounced transitions between them. When developing the S2FX model, I considered BTC in each phase as a new asset with completely different properties. The logical next step is to identify and quantify the phase transitions of bitcoin.
S2F cross-asset (S2FX) model for bitcoin
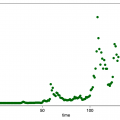
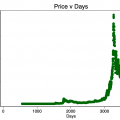
The chart below shows the monthly data points for the BTC in the S2F model and its actual price used in the original S2F model. Visually, they are quite explicitly divided into four clusters.

Bitcoin clusters?
Indeed, these four clusters may indicate phase transitions.
Quantification of these clusters canspend by minimizing the distance between monthly BTC data and clusters. I used a genetic algorithm (minimizing absolute distance) to quantify the four clusters. The use of other clustering algorithms (for example, the k-nearest-neighbor method) may be the subject of future research.

Bitcoin Clusters!
Each of the four identified clustersIt has a very different combination of simulated S2F and market value, which seems to be consistent with halving and a change in the prevailing perception of BTC.
- BTC «Proof of Concept» (S2F 1.3 and capitalization $1 million)
- BTC «Payments» (S2F 3.3 and capitalization $58 million)
- BTC “Digital Gold” (S2F 10.2 and a capitalization of $ 5.6 billion)
- BTC «Financial asset» (S2F 25.1 and capitalization $114 billion)
As with water or the dollar, in allOf the four clusters, BTC represents four different assets, each with its own main narrative and characteristics. BTC in the concept confirmation phase, with S2F 1.3 and a market capitalization of only $ 1 million, is a completely different asset than BTC in the financial asset phase with S2F 25 and a capitalization of $ 114 billion.
Now, given the prospect of a phase transitionBTC between clusters as different assets, I can add other assets to this model, such as gold and silver. For silver and gold, I used data on the available volume of the offer and its growth from a recent analysis of the English by Jan Nivenhuis and prices at the end of December 2019 from TradingView.
- Silver S2F 33.3 and capitalization $561 billion
- Gold S2F 58.3 and capitalization $10,088 billion

The chart above shows four calculated clusters for bitcoin (plus the initial monthly data for the context), silver and gold. They form a perfect straight line.
To create the S2FX model, I usedregression analysis. Note that the big difference with the original S2F model is that here I used data on S2F and the market value of silver and gold. The S2FX model shows a significant relationship between S2F and the market value of these six assets (low F value, low p-values), with an almost perfect match (99.7% R2).

The formula of the S2FX model can be used to estimate the capitalization of the next phase / cluster of BTC (S2F for BTC will be 56 in 2020-2024):
Capitalization = exp (12.7598) * 56 ^ 4.1167 = $ 5.5 trillion.
This is easily translated into the price of BTC (based on the 19 million issued BTC for 2020–2024) = $ 288 thousand.
S2FX price forecast turned out to be much higher$ 55 thousand received in the initial study. Please keep in mind that the S2FX model presented here is just the first step that has not yet been replicated and analyzed by other community members.
Note 1:Despite the fact that six observations is a verylittle, however, I rate the results of the S2FX model as relevant. This is supported by the high significance of F, low p-values and high R2, as well as the known and proven non-spurious relationship between S2F and BTC price and cointegration in time series analysis. The subject of further research may be to add new assets to the analysis, but most assets have low S2F values (≤1) and are therefore not of interest. In contrast, diamonds have a high S2F value but are also very difficult to grade (rough/cut, carat, different colors and brightness levels, etc.).
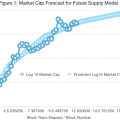
Note 2:the S2FX model allows interpolation rather thanextrapolation as the original S2F model. The prediction of the original S2F model is outside the range of data used to create the model. The new S2FX model's forecast falls within the data range used to derive the formula.

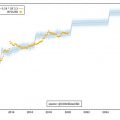
Examples of interpolation (left) and extrapolation (right). The data points are blue, the black line is the model, and the red dot is the forecast.
Conclusion
In this article I further confirm the basiscurrent S2F model by removing the time factor from it and adding other assets (silver and gold) to the calculation. I called this new variation of the model «S2F cross-asset» (S2FX). The S2FX model allows you to value various assets such as silver, gold and bitcoin using one formula.
At the beginning of the article, I briefly explained the concept of phase transitions. Phase transitions represent a new approach to the perception of BTC and S2F. This led me to think about creating the S2FX.
The formula of the S2FX model is in almost perfect agreement with real data (99.7% R2).
The S2FX model provides predictable capitalization forthe next phase / cluster of BTC (S2F for BTC will be 56 in 2020–2024) in the amount of $ 5.5 trillion. This is easily translated into the price of BTC (based on the 19 million issued BTC for 2020–2024) = $ 288 thousand.
In addition, confirming the facts already known from the initial study of the S2F model, the S2FX model offers a new vision of the BTC transition to the next, fifth phase.
�
</p>Read this:
 Statistical model of stock-to-flow speaks of the beginning of the growth of bitcoin
 Supply and Demand Model for Bitcoin Price
 Bitcoin Future Offer Model
 Faking a Logarithmic Bitcoin Price Growth Model
 The Effective Market Hypothesis and the Bitcoin Stock-to-Flow Model
 Trading signals! | A new wave of bitcoin growth or the beginning of a new era of idiocy