PlanB, aka @100trillionUSD user on Twitter, has made his original Stock-to-Flow model more versatile by addingother assets to it, and called a new version of the modelBitcoin Stock-to-Flow Cross Asset, or S2FX. PlanB has done an excellent research on the Stock-to-Flow ratio and its relationship to the price of bitcoin. In simplified terms, Mr. B (or Mr. Plan?) Suggested that there is a correlation between the market capitalization of Bitcoin and the ratio between the number of bitcoins already issued and the annual volume of new coins issued. Such a relationship, apparently, exists for gold and other precious metals.
In my latest PlanB article todaysays that a) the new S2FX model assumes an extremely high BTC price ($ 288,000) in the future and b) it would be nice to test the effect of this model with regard to other assets.
Residential Properties
I thought it would be fun to test thismodel in the American residential real estate market. For clarity, all of my calculations in this article are based on the regressions proposed by PlanB. I just substituted the numbers in his formula.
Does it make sense to apply the Stock-to-Flow coefficient to the housing market? Actually yes. Economists have explored a number of residential real estate markets using stock to growth models.
My focus was primarily on the marketSan Francisco (I live here). The county council has definitely increased the level of difficulty in building new housing here. All property owners are represented as scouts. Stock (available quantity) is high, inflow is low, and prices are absurdly high. Meanwhile, in places where builders have more opportunities to build new housing for those who are interested in buying it, the influx of new supply in relation to the stock is higher, and prices are lower.
Residential real estate is not such a commodity asset asgold, silver or oil. It is not interchangeable at the unit or square meter level. On the other hand, if we take the total volume of housing construction in, say, the United States, we get a large and diversified sample.
In addition, annual housing production does not havesuch restrictions as gold mining, not to mention Bitcoin mining. However, it is limited by the availability of capital, labor and material resources, and, more often, by local regulations. With the political will of housing, much more could be built. But today there is no such will. Locations in which housing production can be easily increased are not always the most popular. So at this particular historical moment, the influx of new residential real estate can be called relatively stable (at least until the COVID epidemic).
Plus, we have good data on housing. The United States Census Bureau annually reports on the total number of residential real estate erected. This report also refers to the average size of units of residential real estate and whether they are intended for one or more families. In addition, there is data on the average selling price of built for sale housing. There is an estimate of the total number of square meters of residential real estate in the country. Finally, Zillow has a model for calculating the total market capitalization of all US residential property. All together, this provides the necessary input for applying the Stock-to-Flow coefficient and checking how well the overall capitalization of the US housing market is projected under this model.
Formula
PlanB evaluated the regression and derived the following formula:
Market value = exp (12.7598) * S2F ^ 4.1167
That is, as soon as we calculate the correct ratio for the US housing market, we can simply substitute it into the formula and see how well the capitalization of this market is predicted.
(Warning: this will be followed by a tedious enumeration of numbers. You can safely skip this part if you do not want to go into such details.)
Residential Property Area
At the end of 2019, the total living areareal estate amounted to approximately 253.2 billion square meters. ft. In a 2015 article, Moura, Smith, and Belzer calculated the total area by combining data from the Census Bureau and the Department of Housing and Urban Development. I updated these numbers using the data from the Census Bureau for 2019.
In addition, according to these data, in 2019904,000 single-family homes were built with an average area of 2,508 square meters. ft. In addition, 352,000 housing units were built in multi-apartment buildings, with an average size of 1,138 square meters. ft. Together, this gives 2.667.808.000 sq. M. ft. of new residential property for 2019.
So, dividing 253.2 billion square meters. 2.67 sq. ft. ft. we get a Stock-to-Flow ratio of 94.8.
By inserting it into the PlanB formula, we get the estimated market value exp (12.7598) * 94.8 ^ 4.1167, or $ 47.8 trillion.
To what extent does this correspond to the "actual" value? Zillow estimated the market value of all U.S. residential real estate at $33.6 trillion.
Assuming that the Zillow figures are correct, the model inflates the cost of housing by about 42%. The result is actually quite close, but still inaccurate.
But wait, really square feetbuilt in 2019 are equivalent to sq. feet of pre-existing housing? Hardly. And although there are many beautiful old houses, on average they are inferior to new ones, if only because they have accumulated more pending and unresolved problems than in houses built last month. So the modeled value should be higher than the actual one.
Add the price to the calculation
Is it possible to get a more accurate estimate iftake into account the dollar value of housing built? After all, if the Zillow score is correct, it must consider all deferred services, all the differences in location and facilities, in the school districts. All this is reflected in the price. Price knows everything. Meanwhile, we have a price at which new housing is sold, and we can get a good, if not perfect, idea of the value of both stock and inflow.
We don't have a "price" for housing built by owners on their own.We, or at least the Census Bureau, know a lot about square footage, but not about its price.For properties built for sale, we have a price.
After examining the data on the size of houses, I came to a very rough conclusion that housing built by owners is on average 6-8% smaller than housing built for sale.
More importantly, 24% of completed housing unitswere multi-unit and the vast majority were leased. The price of these housing units is unknown to us. I will proceed from the assumption that apt. a pound of rental housing is equivalent to sq. foot of a single family home. This gives a weighted average market value for all constructed and sold housing units in the amount of $ 320,700. This estimate is probably somewhat overstated, since multi-unit, rental, and single-family premises are not really equivalent. But I can’t accurately calculate the difference. The existence of this difference means that the Stock-to-Flow model should somewhat underestimate the cost of existing housing.
If 1,256,000 housing units have been completed and / orsold at our average price of $ 320,000, it turns out that in 2019 the volume of the US residential real estate market increased by $ 402.8 billion. Dividing the total volume of the housing market according to Zillow data by the obtained value, we get the Stock-to-Flow coefficient equal to 83.4.
So, returning to our formula, we get a forecast of market capitalization exp (12.7598) * 83.4 ^ 4.1167 or $ 28.2 trillion.
The result in this model is 16% lower than the Zillow estimate of $ 33.6 trillion. Given that we expected underestimation, this is quite impressive.
Fit data to a PlanB schedule
OK. You have read up to this point. You are probably interested to see how the results of our calculations will look on the chart. And you deserve it rightfully.
We will mark $33.6 trillion, the capitalization of the American residential real estate market according to Zillow, with two points on the chart fromPlanB: 94.8 – Stock-to-Flow coefficient (blue circle), 83.4 – Stock-to-Flow (green circle).As you can see, both of these points are very close to the regression line.
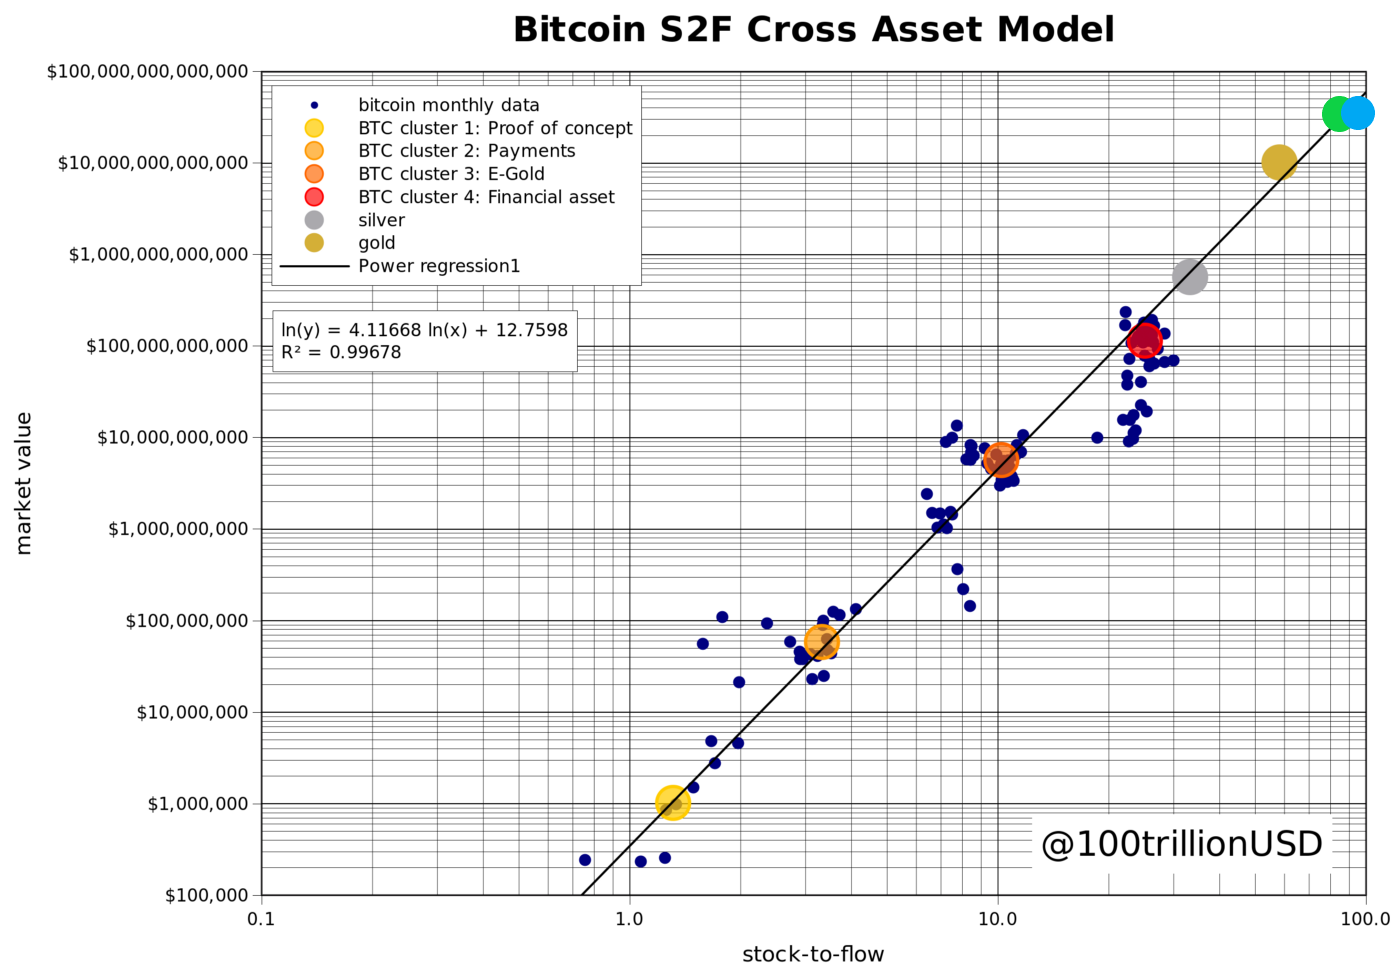
Green Circle - Residential Market CapitalizationUS real estate with added price. The blue circle is the capitalization of the US residential real estate market without adding to the price calculation. (PlanB chart used, I just added two points for the housing market.)
Conclusion
| Asset (S2F) | S2F model forecast ($ bn) | Fact. capitalization ($ bn) |
| Bitcoin before Halving (25.1) | $ 201 | $ 114 * |
| Silver (33.3) | $ 644 | $ 561 ** |
| Gold (58.3) | $ 6461 | $ 10.088 ** |
| Residential real estate. feet (94.9) | $ 48,000 | $ 33.600 *** |
| Residential real estate, value added (83.4) | $ 28,200 | $ 33.600 *** |
* average value
** from the PlanB article
*** according to Zillow
So that is all. The overall capitalization of the US residential real estate market fits pretty closely with the Stock-to-Flow Cross Asset (S2FX) model. Adjusting the cost of housing built per year can make compliance even more accurate.
Does this mean that the forecast of the S2FX model on bitcoin for $ 288,000 in 2020-2024. right? Well, you will find out about this at the same time as I do.
�
</p>Read this:
 New S2FX Bitcoin Evaluation Model
 Statistical model of stock-to-flow speaks of the beginning of the growth of bitcoin
 S2F model for Bitcoin. What awaits BTC and is it worth it to trust?
 Model S2FX – Bitcoin phase transition and price rise to $288,000
 Bitcoin Future Offer Model
 The Effective Market Hypothesis and the Bitcoin Stock-to-Flow Model