An article by the popular economist blogger Plan B «Stock-to-Flow model for Bitcoin and other assets» translatedresident of ForkLog HubTony bfrom BITCOIN TRANSLATED.
</p>Introduction
The Stock-to-Flow (S2F) model for Bitcoin Plan B introduced in March 2019.
The original model is a formula,based on monthly S2F data [reserve to growth ratio] and bitcoin price. Since values are indexed in a temporary order, this model is a time series model. This model has aroused the interest of quantitative analysts around the world, and many have confirmed the robust relationship between S2F and BTC price.

Current S2F Model
This article reinforces the significance of the originalS2F models, ignoring timelines and and including additional assets (silver and gold) in the model, which I call S2FX. It allows you to evaluate various assets, such as silver, gold and BTC, using the general formula.
To start, I suggest considering the conceptphase transitions, thanks to which it is possible to look at BTC and S2F from a different angle. This concept serves as a clarification of the relevance of the S2FX model.
The following is a description of the S2FX model, the principle of its operation and the significance of the results.
Phase transitions
Phase transitions play an important role in understanding S2FX. As a result of phase transitions, substances acquire different properties. Transitions are often intermittent. Examples of phase transitions are:
- water;
- U.S. dollar;
- Bitcoin
Water
A classic example of phase transitions iswater. Water can exist in four different phases (states): solid, liquid, gaseous and ionized. All this is water, but in each phase it has completely different properties.

U.S. dollar
Phase transitions can be in the field of finance. For example, the US dollar has undergone three phase transitions:
- Gold coin - one dollar = 371.25 grains of pure silver = 24 grains of gold;
- Banknote backed by gold («Payable in gold coin upon demand of the bearer»);
- Unsecured note («This note is legal tender for all debts, public and private»).
Although we continue to call this note "dollar", its meaning at different stages is radically different.

Bitcoin
The same is true for BTC. Nick Carter and Hasu in their 2018 study show how bitcoin's perception has changed over time.

The change in the perception of bitcoin throughout its existence
These perceptions of bitcoin by network users onThis chart look pretty continuous. However, if we combine the ratio of network participants to the asset with the main time milestones (and then with the S2F data and prices), their similarity with certain phases with sharper transitions begins to be traced:
- «Proof of concept» -> after the publication of the Bitcoin whitepaper;
- «Payments» -> after parity between Bitcoin and US dollar (1 BTC = $1);
- «Digital Gold» -> after the first halving and the price of BTC approaches the cost of an ounce of gold;
- «Financial asset» -> after the second halving (overcoming the threshold of transaction volumes of $1 billion dollars per day, legal certainty in Japan and Australia, futures markets CME and Bakkt).
These are examples of phase transitions in water, dollarsThe US and BTC are opening up new prospects for BTC and S2F. It is important to consider the problem not only from the point of view of a continuous time series, but also to pay attention to phases and sharp transitions. When developing the S2FX model at each stage, BTC is considered as a new asset with completely different properties. The next logical step is the identification and quantification of BTC phase transitions.
S2F Model for Bitcoin and Other Assets (S2FX)
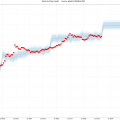
The graph below shows the monthly BTC S2F values and price data used in the original S2F model. Four distinct clusters are clearly visible here.

These four clusters can reflect bitcoin phase transitions.
Minimizing the distance between monthly dataBTC and clusters can be quantified. To quantify the four clusters, I use a genetic algorithm (minimizing the absolute distance). Future studies may rely on various clustering algorithms, for example, the k-nearest-neighbor method).
Each of the four identified clustersBTC has a combination of S2F market value that is different from the rest. Each of these combinations seems to be consistent with halving and a change in BTC perception:
- BTC «Proof of Concept» (S2F 1.3 and market value $1 million);
- BTC «Payments» (S2F 3.3 and market value $58 million);
- BTC «E-Gold» (S2F 10.2 and market value $5.6 billion);
- BTC «Financial asset» (S2F 25.1 and market value $114 billion).
Like water and US dollar, these BTC clustersare four different items, each with different characteristics. BTC as a «Proof of Concept» with S2F 1.3 and a market value of only $1 million is fundamentally different from BTC in the role of a «Financial asset» with S2F 25 and market value of $114 billion.
Given the consideration of the phase transition of clustersBTC as various assets, it became possible to supplement the model with other assets, such as silver and gold. This allows you to build a real model for various assets. For silver and gold, I use stock and flow values taken from a recent analysis by Jan Nuyvenheys and comparable December prices for 2019 from the TradingView platform:
- S2F silver 33.3 and market value $ 561 billion;
- Gold S2F 58.3 and market value $ 10.088 billion.

The graph shows four quantitative BTC clusters (plus initial monthly BTC data for context), silver and gold. They form a perfect straight line.
To build the S2FX model I useregression analysis. Please note that the significant difference with the original S2F model is that I use S2F data for silver and gold and market value data in a regression analysis. The S2FX model demonstrates the significant relationship between S2F and the market value of these six assets (low F, low p) with perfect compatibility (99.7% R2).
The S2FX model formula can be used to assess the market value of the next BTC phase / cluster (BTC S2F will reach 56 in 2020–2024):
Market value = exp (12.7598) * 56 ^ 4.1167 = 5.5 trillion
This means that the price of BTC (including 19 million coins in circulation in 2020–2024) will be $ 288,000.
BTC forecast price well aboveThe $ 55,000 featured in the initial study. Do not forget that the S2FX model is the first step that has not yet been reproduced and examined in detail by other researchers.
Note 1:Although the sum of the six observations above is not a conclusive indicator, I highly appreciate the calculation results based on the S2FX model.
Future research may focus onimproving this model by adding additional assets. However, the S2F values of most assets are low (≤1) and therefore not of interest. On the other hand, S2F diamonds, for example, are high, but it’s very difficult to build a valuation model for this asset (rough / cut, carats, color and clarity differences, etc.).
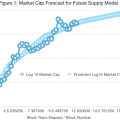
Note 2:the S2FX model allows interpolation, unlikeextrapolations in the original S2F model. The prediction of the original S2F model is outside the range of data used to create it. The new S2FX model's forecast falls within the range of the data used.

An example of interpolation (left) and extrapolation (right), where the data is marked in blue, the line is the model, the red dot is the forecast
Conclusion
This article reinforces the significance of the originalS2F models, ignoring time indicators and including additional assets in the model. The S2FX model allows you to evaluate various assets, such as silver, gold and BTC, using the general formula.
This article describes the phasetransitions. Thanks to phase transitions, it is possible to look at BTC and S2F from a different angle. This is what led me to think about the S2FX.
The formula for the S2FX is ideal for data (99.7% R2).
S2FX predicts market valuethe next phase / cluster of BTC (the value of S2F bitcoin will be 56 in 2020–2024) at $ 5.5 trillion. This means that the price of BTC (including 19 million coins in circulation in 2020–2024) will be $ 288,000.
Reinforcing the facts known from the original S2F study, the S2FX offers a fresh perspective on the transition of BTC to the fifth phase.
Read this:
 New S2FX Bitcoin Evaluation Model
 Statistical model of stock-to-flow speaks of the beginning of the growth of bitcoin
 Technical model shows Bitcoin (BTC) growth in January to $ 8500
 S2F model for Bitcoin. What awaits BTC and is it worth it to trust?
 Bitcoin Future Offer Model
 Bobby Lee: in 9 years, bitcoin will cost $ 500,000 and surpass gold in capitalization