In a new review, the analystWill Clementebreaks down the current situation in the Bitcoin market withon-chain metrics, separating signal from noise.
I hope you had a good week.Another week in a horizontal trend for Bitcoin and it has now been trading in the $30-40K range for over six weeks now. Let's see what changes this week brought in on-chain metrics. I hope you will enjoy.
Here are some key takeaways:
- Bitcoin continues to build a significant capital base between $32k and $40k, with over 15% of the outstanding BTC having moved within the current range.
- The average daily hashrate continues to decline, inmoment reaching its lowest level since 2019. The interval between blocks reached >23 minutes, the release of new coins has slowed down, and the difficulty will be adjusted in the next few days.
- The change in the net position of miners indicates moderate sales (which, apparently, can be explained by the migration of miners from China).
- Younger coins continue to sell off, to the largest net loss (in dollar terms) in Bitcoin history per day.
- There is still no inflow of new "whales", but the number of retail investors is growing aggressively (let's look at it in detail).
- Re-accumulation continues (consider in detail).
- Capital flow dynamics at exchange addresses is neutral, which can be regarded as a positive sign.
- Capital continues to slowly flow from stablecoins to the market.
- The W-shaped recovery in new users has continued, with more than 36,000 new entities joining the Bitcoin network every day.
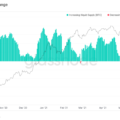
Considering how much time we've spent in the currentrange, a clear third zone in terms of on-chain volume has now formed in this bull market: 15.91% of the Bitcoin money supply has already moved in the $32-40 thousand range.
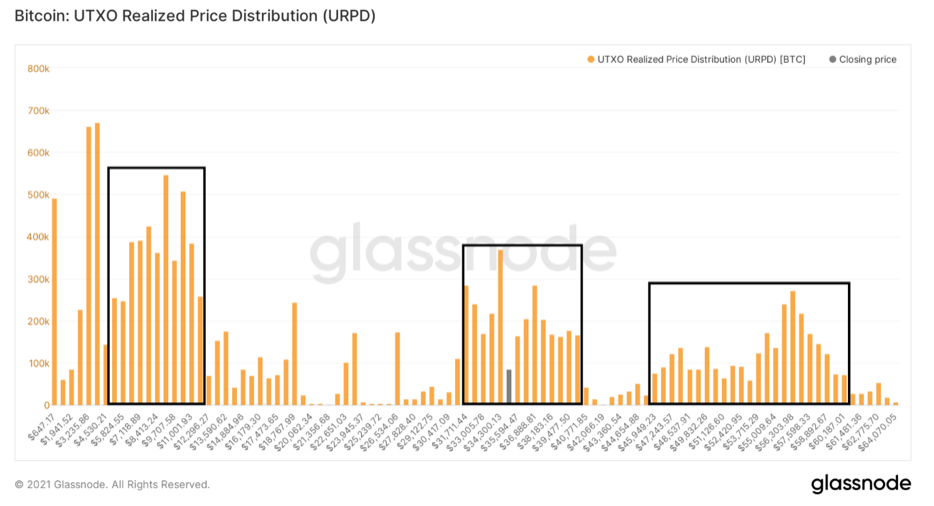
UTXO realized price distribution
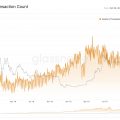
One of the most discussed phenomena in connection withBitcoin has seen a dramatic drop in network hash rates lately. The hashrate continues to decline, with a very small rebound on Wednesday June 28th. On the 27th, it fell to its lowest level since the end of 2019. Despite some minor consequences, the network continues to work, as it has always worked and will continue to work as always. Let's take a look at some of these minor impacts that the hashrate drop has had on the Bitcoin protocol.
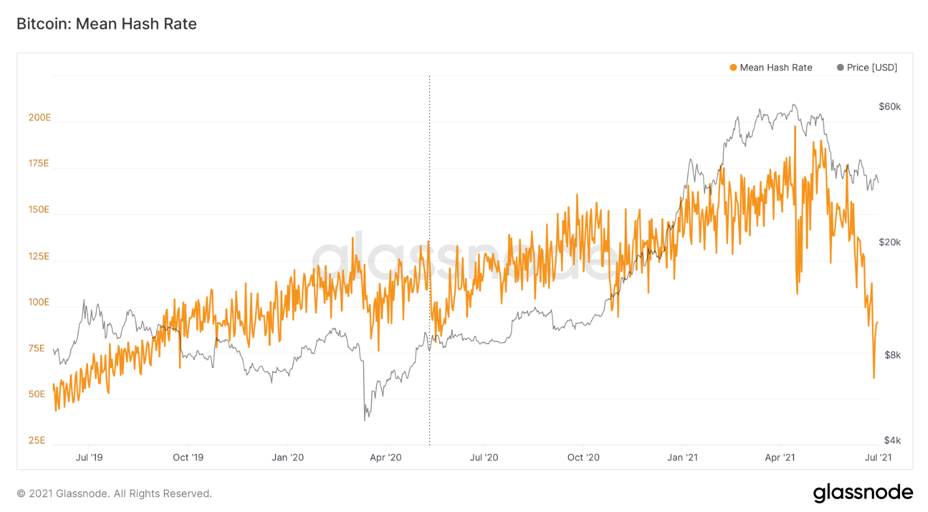
Average Bitcoin hash rate
First, the average block spacing has reachedincomparably high historical levels. At the moment this week, the average block interval was 23.3 minutes, up from the usual 10 minutes. This means that the long-awaited difficulty adjustment will take slightly longer than usual, but should happen on Sunday, July 3rd.
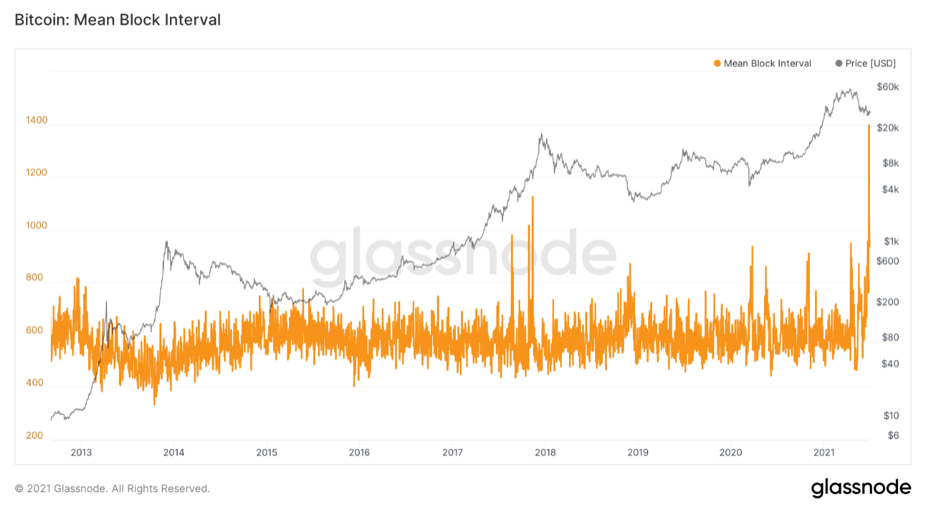
Average block spacing
Because of this, the emission of new BTC has decreased, andThis means that miners receive less block subsidies than before. Last Sunday (June 27), this value dropped to 362 newly issued BTC, while the expected volume of new coins after last year's halving is 900 BTC/day. This will of course return to normal once the difficulty is adjusted.
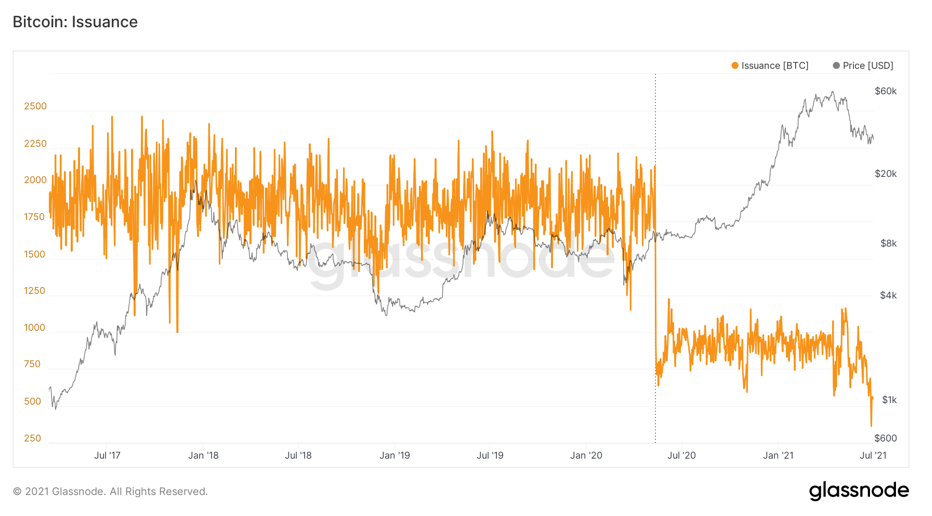
Bitcoin: number of coins issued
Because of this, combined with the price reduction,the value of the Puella coefficient - the daily volume of BTC issue divided by the 365-day moving average of the issue (in dollar terms) - decreased to the "buy zone". Historically, whenever the Puella ratio dropped into this zone, it was a great time to accumulate BTC. Examples include the lows of the bear markets in 2012, 2015, 2018, as well as the collapse in March 2020 (COVID).
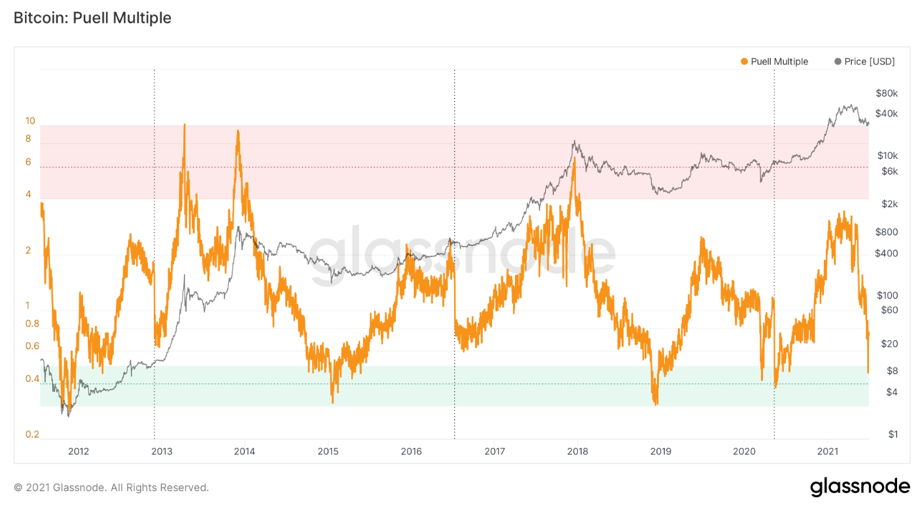
Puell coefficient
And one more note about miners.It is widely believed that miners have played a large role in the market drop in the past few weeks, as they supposedly needed to sell BTC to cover the costs of migrating from China. However, according to Glassnode, since May, miners have reduced their reserves by ₿5269. Most of these sales occurred in early June, and this is not at all an amount that the bitcoin market could not easily digest.
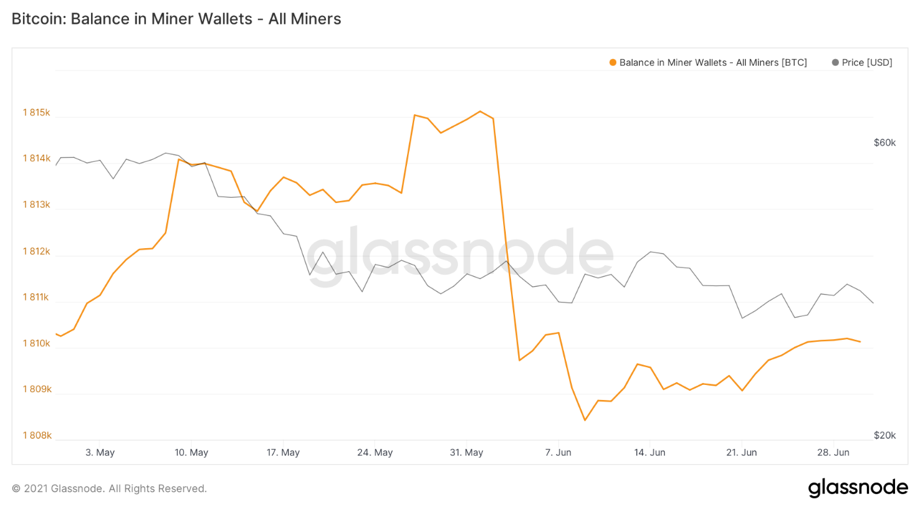
Miner address balance (all miners)
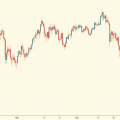
Most of the sales still come fromshort-term holders, including a major capitulation this week from relatively “young” network actors. Looking at the SOPR for short-term holders - an indicator that measures the profit that coins are generating - on Friday 25 June, these network entities were selling their coins at large losses. This STH-SOPR decline is quite comparable to the other largest drawdowns in Bitcoin history, trailing only two episodes in the 2018 bear market and of course the March 2020 crash.

SOPR for short term owners
In dollar terms, it was the day of the biggestrealized losses in Bitcoin history, surpassing the previous record set in May. In total, $ 4,456,786,884 of losses were realized.
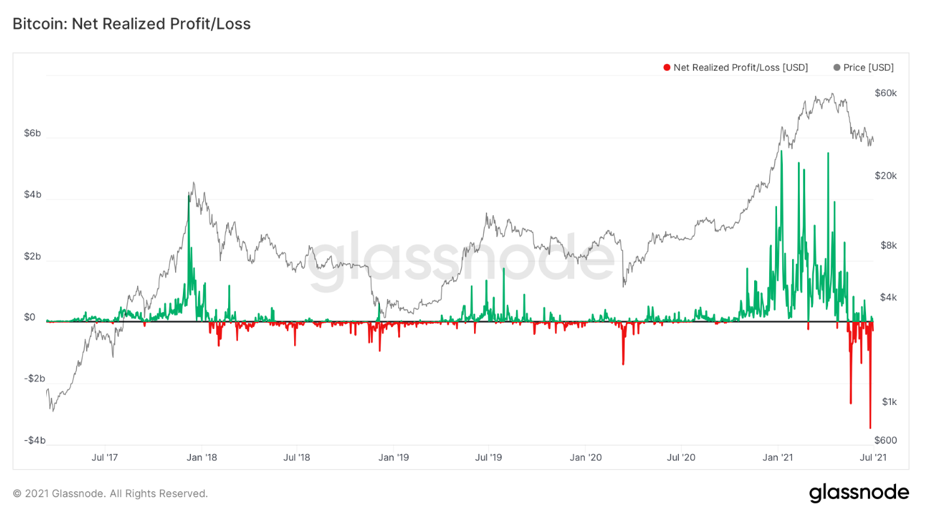
Net realized profit / loss
I heard an opinion about what a saleIn recent weeks, mostly retail investors have been responsible, but based on on-chain data, this is not the case. Small investors continue to aggressively build up their positions. Although the balance held by such entities (0.001-1 BTC) always tends to increase, the current growth is on a sharper than usual trajectory. However, it is worth making a reservation that I am only referring to on-chain data and cannot judge intra-exchange capital flows.
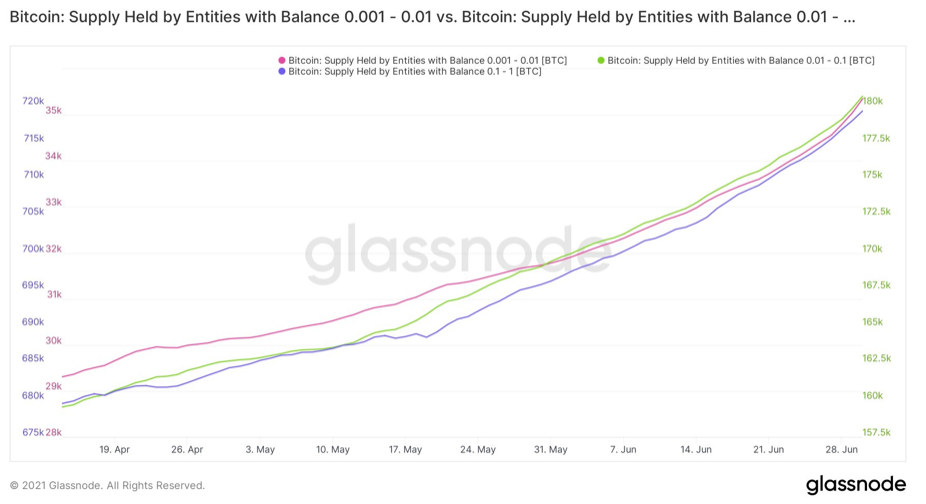
Supply of BTC held by network entities with balances of 0.001–0.01 BTC (red curve), 0.01–0.1 BTC (green curve), and 0.1–1 BTC (blue curve)
And this is the final change in position in various user cohorts for the period from June 5 to July 1:
- retail users or "shrimp" (0.001-1 BTC): +4396 BTC;
- crabs (1-10 BTC): +14,942;
- octopus/fish (10–100) BTC: +15,705;
- dolphins/sharks (100-1000 BTC): -17,374;
- whales/megawhales (1000-10,000 BTC): -27,037.
So in general it seems that the smallernetwork actors are actively buying, while larger users are reducing their positions. Looking at the age of the coins sold by metrics such as CDD (coin-days destroyed), Dormancy (coin downtime rate), ASOL (average life spent output) or Liveliness (“liveliness”), combined with data by cohort, it appears that young whales have sold the most in the last month. Let's focus on the whales, which are, of course, the cohort that drives the market the most. The number of new whales continues to decline, a trend we have seen for several weeks now.
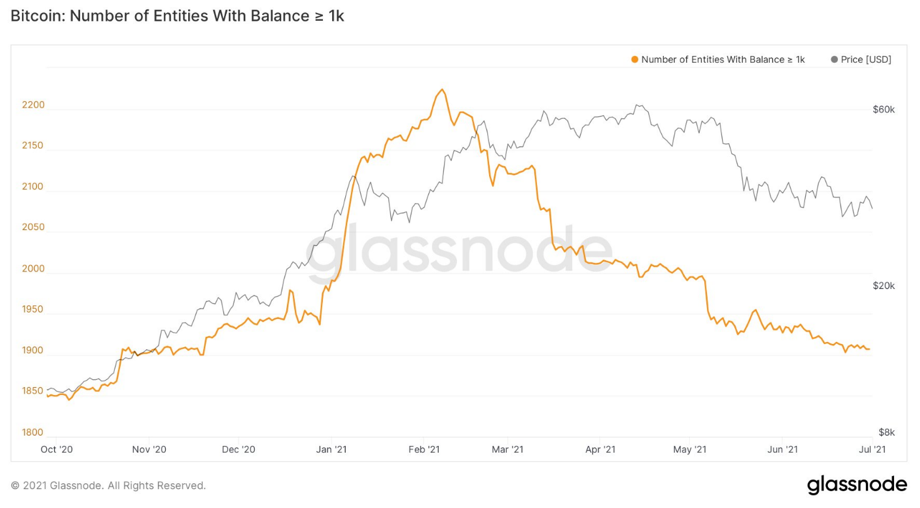
Number of network entities with balance ≥1 thousand BTC
From all that has been said, we can conclude thatthe vast majority of these new Bitcoin users come from retail, with whales shrinking, small members on average buying and whales selling. It would be interesting to know what proportion of new users come from Latin America. The growth of new Bitcoin users again exceeded 34 thousand / day. Remember that we are not talking about addresses, but about subjects in the blockchain, determined using heuristic methods.
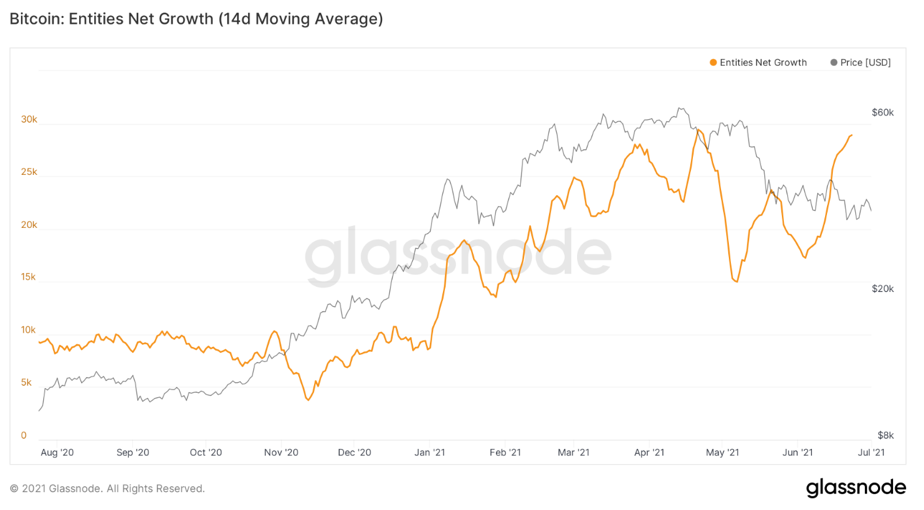
Net Subject Growth (14-day MA)
Regarding re-accumulation, the indicatorilliquid supply changes are still in the green, and Willy Woo's supply ratio continues to rise. Both of these indicators point to the same thing: the supply continues to flock to illiquid actors in the network. Here's a good analogy, in my opinion: a large amount of liquid has spilled over the surface, and now the market is gradually adding paper towels. The rate of addition of paper towels is represented by the slope in the supply ratio, but unless a new spill occurs (surrender in which a large amount of new supply becomes liquid), eventually the spilled liquid (sold coins) will be absorbed by strong hands. With that said, the market can be expected to continue moving within the range until this re-accumulation is completed.
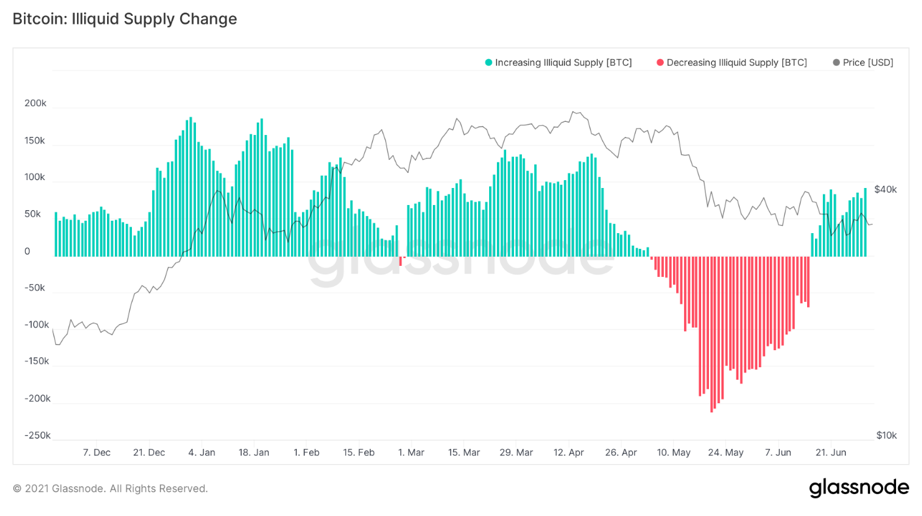
Change in illiquid BTC supply
Capital flows at exchange addresses today also continue to move horizontally, which, in my opinion, is a positive sign, since it also indicates accumulation.
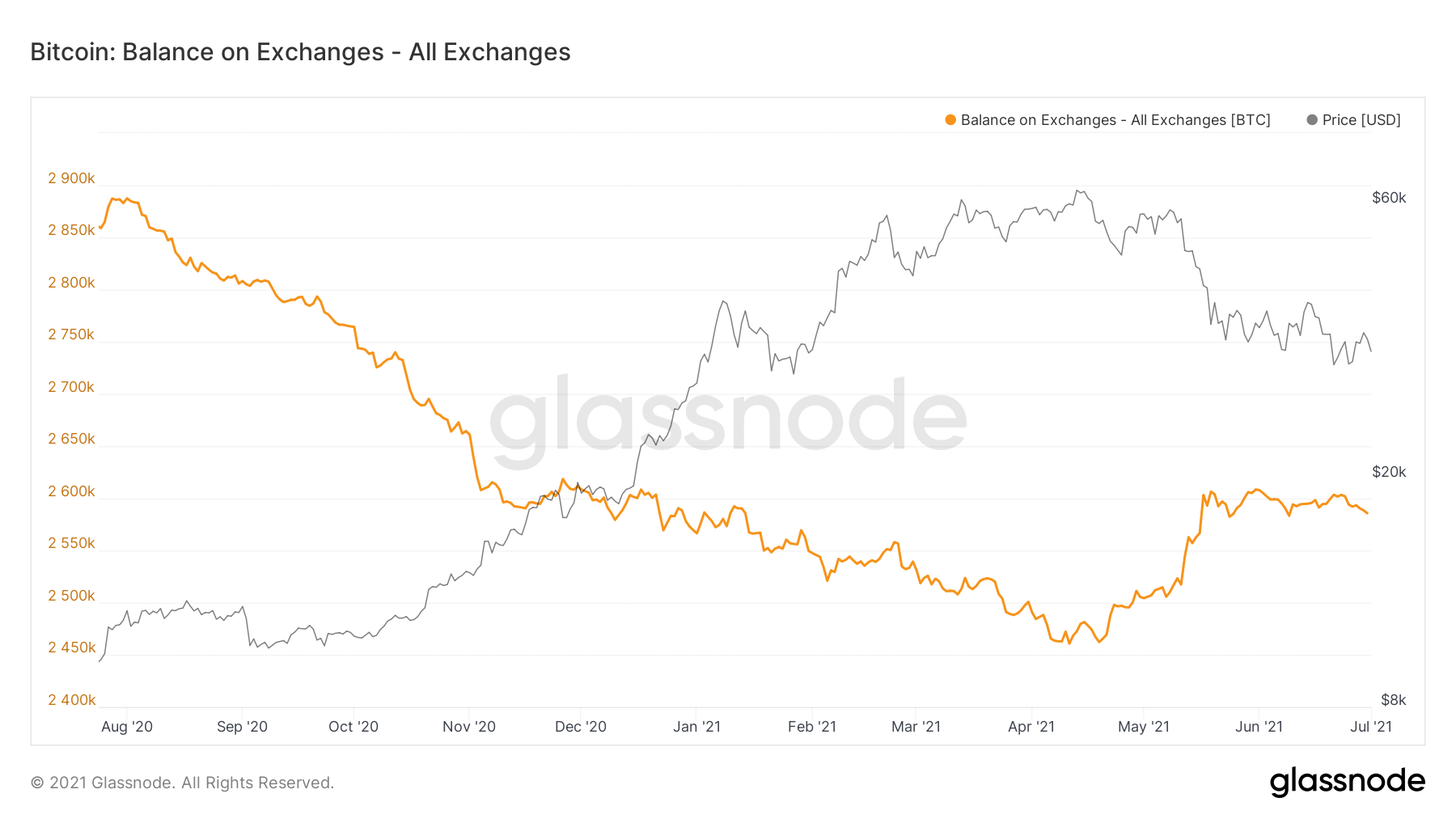
Balance of exchange bitcoin addresses (all exchanges)
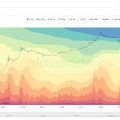
Finally, I left the bid ratioStablecoin Supply Ratio (SSR), an oscillator created by Willy Woo. This indicator shows that capital continues to slowly return from stablecoins to the market. This recovery is reminiscent of any other major drop in the price of BTC since the first stablecoins hit, including late 2018, late 2019, and March and September 2020. Another sign of market recovery.

Stablecoin Supply Ratio
That's all for today. I'm looking forward to next week and the next review. Great weekend to everyone!
The article does not contain investment recommendations,all the opinions expressed express exclusively the personal opinions of the author and the respondents. Any activity related to investing and trading in the markets carries risks. Make your own decisions responsibly and independently.
</p>
Read this:
 Strong Hands Accumulate BTC Aggressively - Onchain Pulse from June 26, 2021
 Coin Metrics: Daily Active Bitcoin Addresses Exceed 1 Million
 Study: the number of transactions in the Bitcoin network has been decreasing since June of this year
 Onchain Pulse | 04 May 2021
 On-chain data suggests selling pressure for BTC at $60k is easing.
Bitcoin hash growth ensured by the launch of 500,000 new ASIC miners
On-chain data suggests selling pressure for BTC at $60k is easing.
Bitcoin hash growth ensured by the launch of 500,000 new ASIC miners