Bitcoin on-chain data shows that both speculators and long-term investors are gaining moreconfidence in continued growth, as BTC sales activity slowed down significantly.
Perhaps for the first time in a bull market, Bitcoin has notonly long-term owners of BTC, but also short-term speculators, who usually gradually increase the daily selling pressure towards the end of the market cycle, are gaining more confidence in the further price increase and are clearly in no hurry to part with their bitcoins.
This only exacerbates the already existing supply shock. And if demand remains high enough, then we will get the necessary fuel for the next wave of growth.
BTC sales activity slows down again
Every Bitcoin bull market has usually coincided withan increase in the number of short-term speculators entering the market hoping to make quick profits, while long-term traders gradually increased selling pressure towards the second half of the market cycle to lock in their profits.
One of the best on-chain indicators forobserve the development of this trend in each cycle, called HODL waves. All issued bitcoins are divided into groups based on the time elapsed since their last movement between network addresses. These groups are then rendered as colored stripes of varying widths.
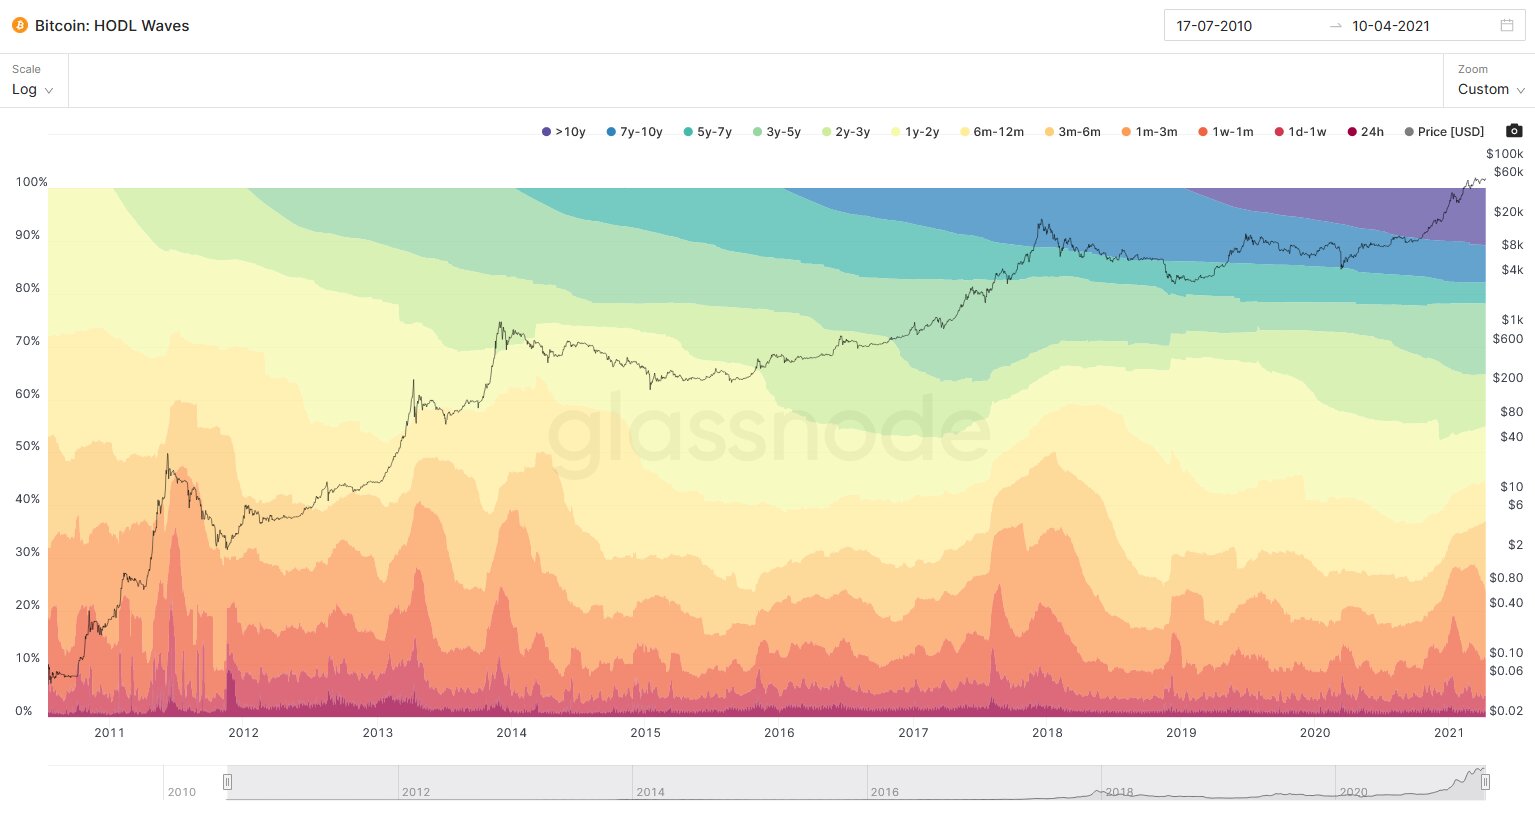
Bitcoin HODL Waves. :Glassnode
For example, bitcoins that were held inwithin five months, will fall into the 3m-6m category (light orange stripe). If these coins are sold, they will fall out of the 3m-6m category and move to 24h (dark red stripe).
The more red colors on the HODL wave chart,the higher the volume of short-term Bitcoin turnover as of the corresponding date. The smallest values of short-term turnover are usually in bear markets, the largest in bull markets. Short-term turnover usually peaks around the top of a bull market.
On the need to make an adjustment for the selling price when constructing HODL waves
Since the price of bitcoin within market cyclesfluctuates significantly, and HODL waves only take into account the absolute number of bitcoins moved, the resulting chart does not take into account the total value of bitcoins sold by sellers on a given day.
Since as the price rises, profit-taking forAs hodlers are becoming more and more profitable, HODL waves can be weighted by selling price, that is, by the average value of the last buy / sell price of each bitcoin.
This adjustment allows you to visualize the value-taking profit by day through the price-adjusted color segments of the HODL waves.
Bitcoin cycle tops usually coincide with short-term coin turnover peaks
Having adjusted the HODL waves for the selling price, wewe get the Realized Cap HODL Waves (RC-HODL Waves) metric, the concept of which was first presented by on-chain analyst Typerbole. This adjustment shows that so far the peaks of the 1w – 1m group have coincided with the top of each of the previous bull markets.
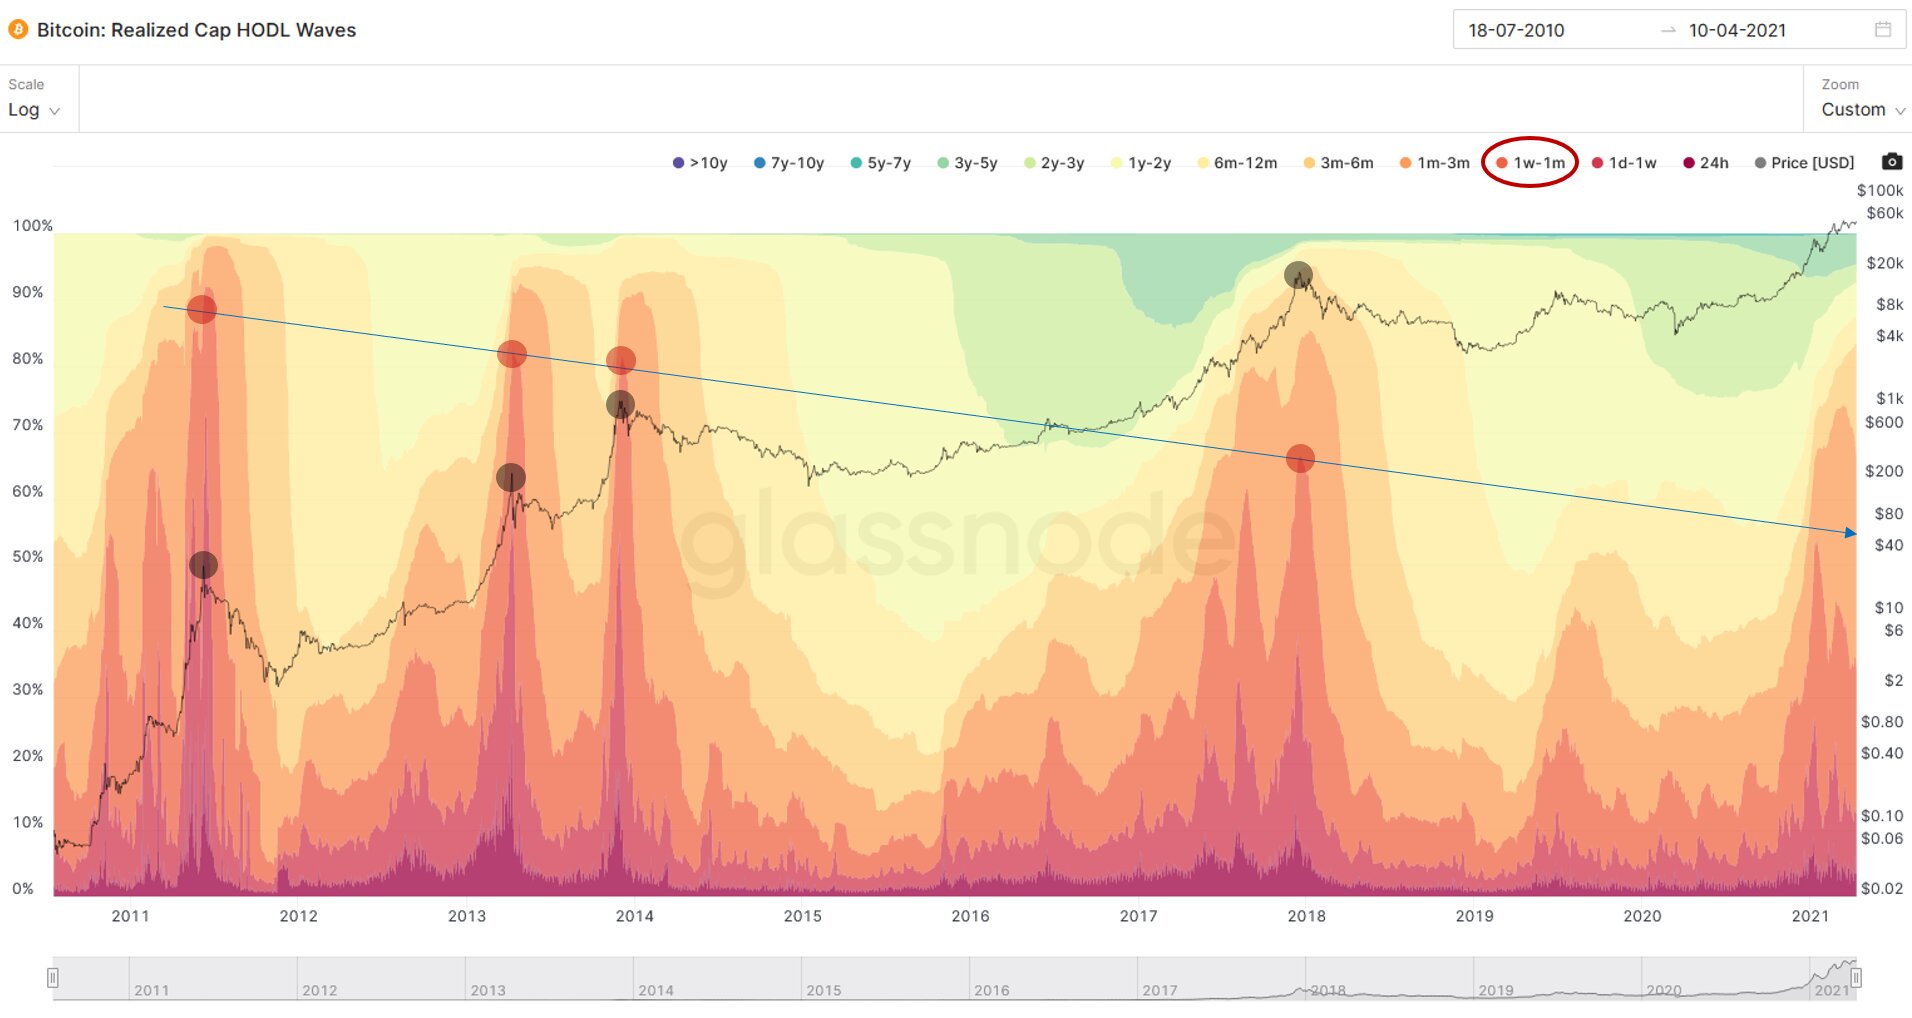
Bitcoin RC-HODL Waves. :Glassnode
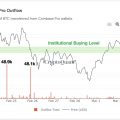
This indicator not only suggests thatcurrent selling activity has yet to reach the highs of a bull market, but it shows that for the first time in Bitcoin history, short-term turnover peaks are forming a downtrend while the price of BTC continues to rise.
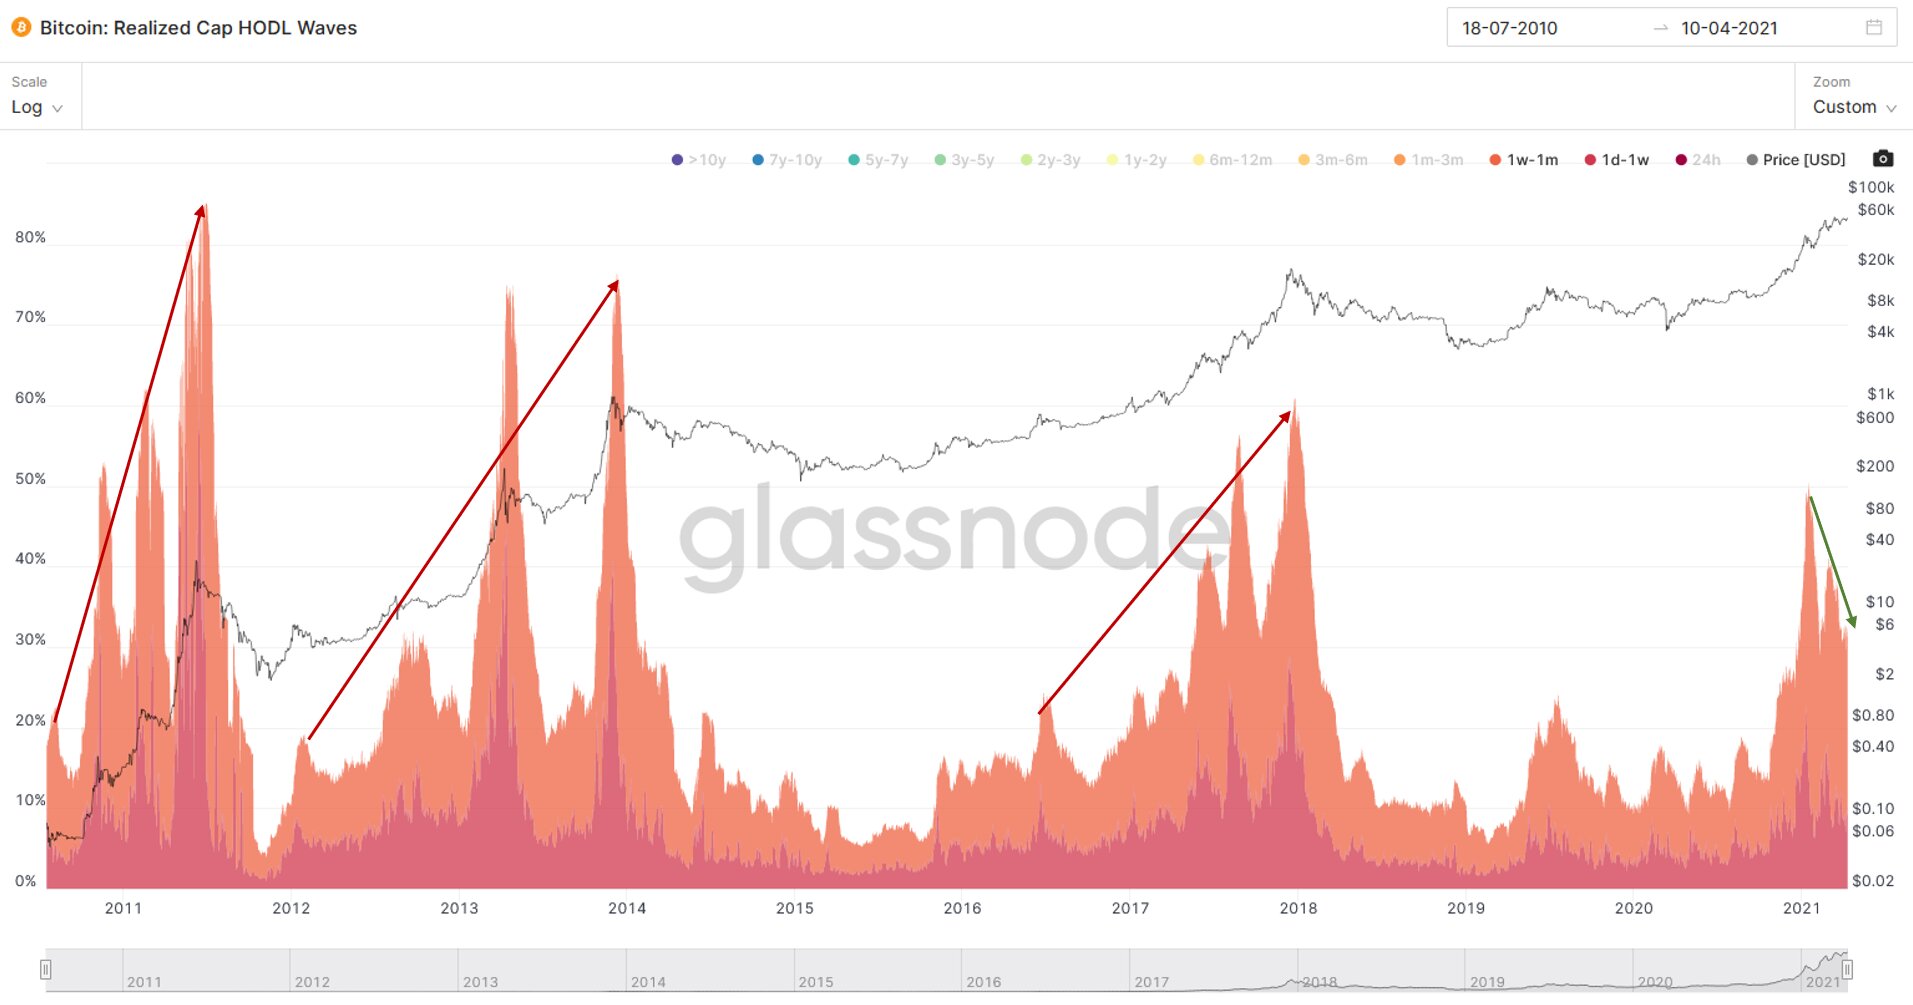
Bitcoin RC-HODL Waves, 1d-1m. :Glassnode
This is very unusual in a bull market.Assuming that the price peaks have not yet been reached, this tells us that both short-term and long-term investors are again beginning to hold their coins to a greater extent, expecting further price growth, and thereby contribute to reducing the supply of BTC on exchanges. ...
Bitcoin selling activity relative to the average holding period is quite low
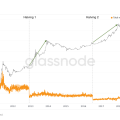
Raphael Schulze-Kraft, Technical DirectorGlassnode takes a similar view, measuring the sentiment of long-term owners using the Coin Days Destroyed metric, which reflects the total number of days a coin has been “destroyed” when a coin is sold.
The three-month moving average of this indicator returned to the level that was last observed in the summer of 2019, after reaching the price peak.
Ok, this is beautiful.
Experimenting with Coin Days Destroyed: Despite $ BTC prices above $ 50k, 3-month CDD at low levels and recently declining.
Old hands extremely strong here, HODLers showing conviction and doing what they do best.
Doesn't look like a top to me.#Bitcoin pic.twitter.com/z8OL8Gt73E
— Rafael Schultze-Kraft (@n3ocortex) April 9, 2021
@ n3ocortex:
Look how beautiful it is: despite BTC being above $50k, Coin Days Destroyed's three-month moving average is at a fairly low level and has been declining lately.
Old "hands" show strength. The HODLers look very confident and continue to do what they do best.
To me, this doesn't look like the top.
As the price approaches the peak of the bull market, you canmuch higher values of the indicator would be expected, since this would be accompanied by profit taking by long-term holders in large volumes, which is not currently observed.
Bitcoin spending relative to total market capitalization is small
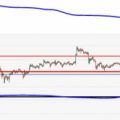
If we develop the concept of Coin Days a littleDestroyed and looking at it in terms of the average destroyed value in a market cap perspective, we arrive at the so-called Dormancy Flow Ratio. This concept was developed by renowned analyst and trader David Puell.
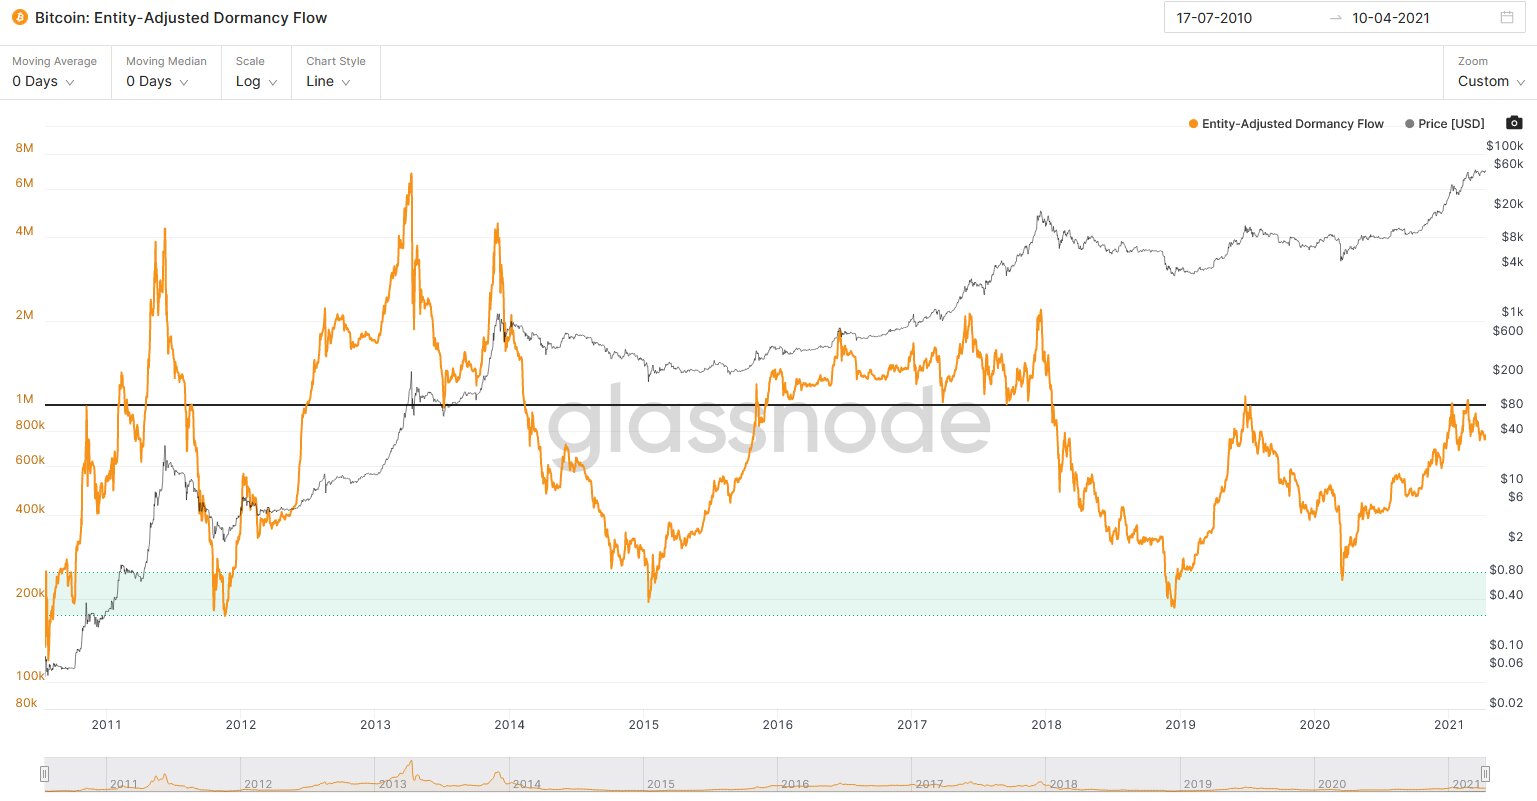
Bitcoin's User-Adjusted Dormancy Flow (Entity-Adjusted Dormancy Flow). :Glassnode
The Dormancy Flow coefficient describes the annualmoving average of bitcoin spending. It is based on the ratio of the retained value destroyed at the time of spending to the total value accumulated in the market.
The value of this indicator is currently at a very healthy level, well below those seen at the peaks of previous bull markets.
Jet fuel for BTC price
Bitcoin sales activity in both long-term andand short-term owners are declining, while the ratio of the average annual consumption of coins to market capitalization is also surprisingly low - this data suggests that the market is gradually approaching an even greater reduction in supply. And this is an excellent jet fuel that can propel the price of bitcoin to new heights.
However, these factors alone cannotto guarantee robust growth, since in the current circumstances, a prerequisite for this is the maintenance of stable demand, the main source of which has recently been wealthy private and institutional investors.
The article does not contain investment recommendations,all the opinions expressed express exclusively the personal opinions of the author and the respondents. Any activity related to investing and trading in the markets carries risks. Make your own decisions responsibly and independently.
</p>
Read this:
 Whales accumulate BTC at around $48 thousand, on-chain data shows
 Buying on a decline: investors accumulate bitcoin ahead of halving
 Bakkt sales hit record highs
 BTC indication of sales and purchases.
 Data shows that more and more investors are holding bitcoins before halving
 Report: on-chain activity of bitcoin increased by 21% in May