Narrow trading range in BTC/USD after closing above the $45K support and retesting the breakout level in ETH/USD inanother review fromCredAndDonAlt, authors of the newsletterTechnical Roundup. Also on the program: strong upward momentum in Tezos and a short commentary on the situation in the S&P 500 index.
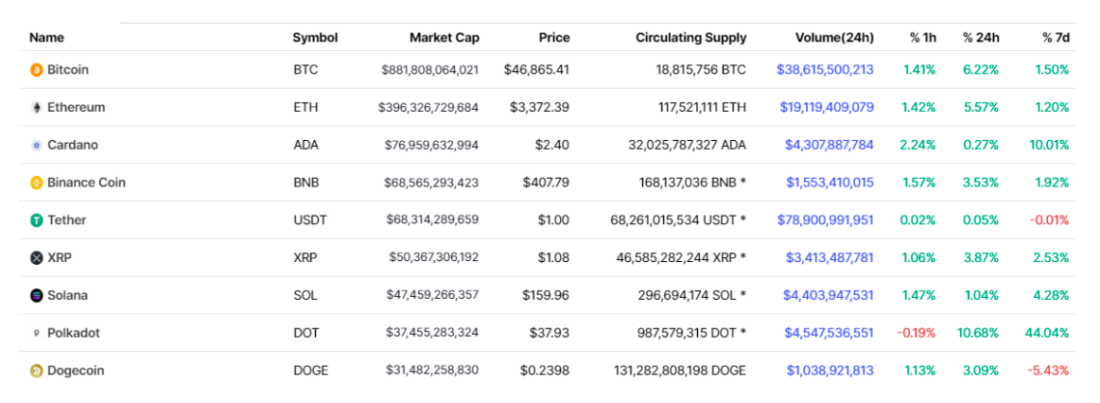
https://coinmarketcap.com/coins/views/all/
BTC above $45k support.
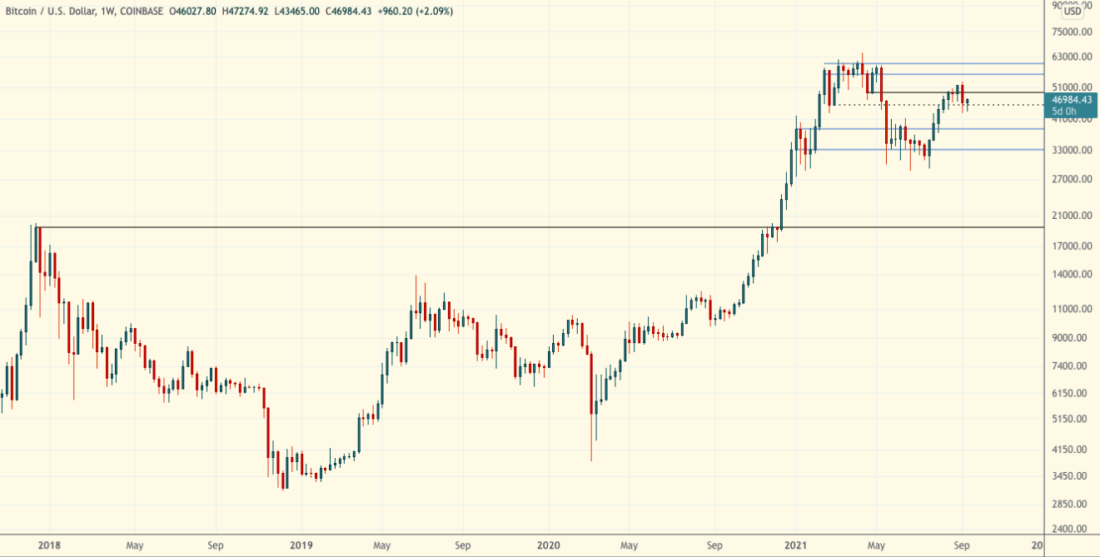
Chart executed in TradingView
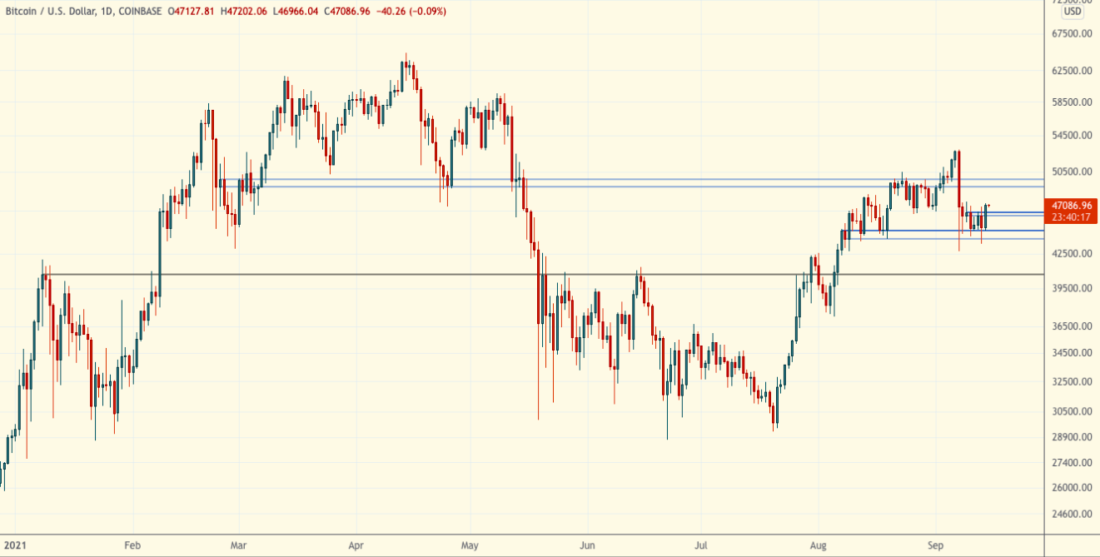
Chart executed in TradingView
Bitcoin is trading between $45k and $46.4k against the dollar.
The narrowness of this range reflects the apparent volatility in the market after a significant drop last week.
Support at $45K on the weekly chart was held at the close of the candle. This is a positive signal that increases the chances of this short-term range breaking upward rather than downward.
If this rally continues, what will it be about?signal a close above $46.4 thousand, then a retest of $49–49.7 thousand is likely. This is an area of significant resistance, which is clearly evidenced by the strength of the price rollback after a false breakout of this level.
Aside from the short-term range, the $40k and $50k areas are most significant.
Below $40 thousand, the thesis about a lower minimum in the macrostructure becomes relevant. Above $50K, the trend to new all-time highs is likely to continue.
Everything else is more noise than signal.
ETH: retest $ 3000
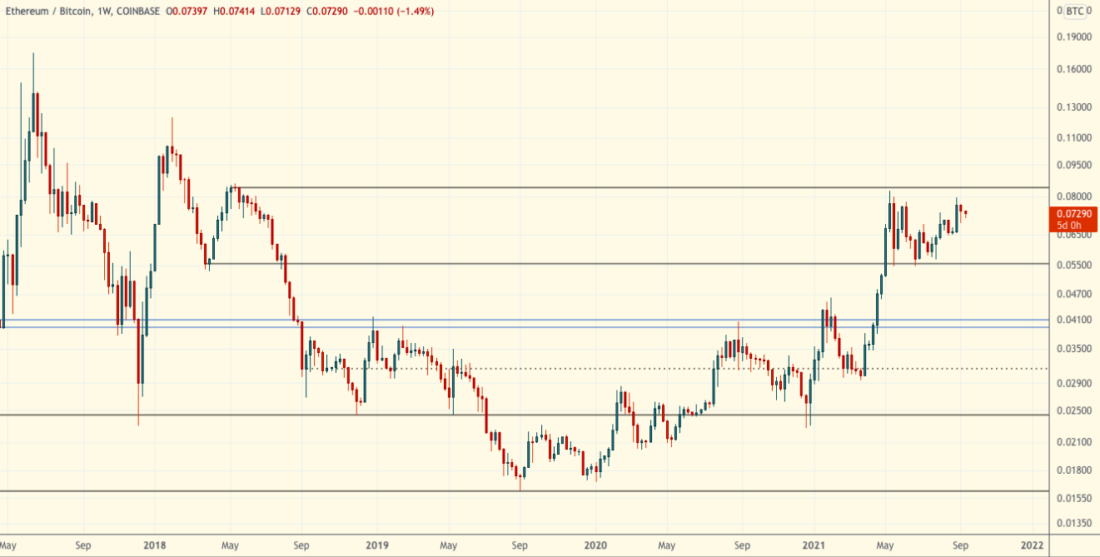
Chart executed in TradingView
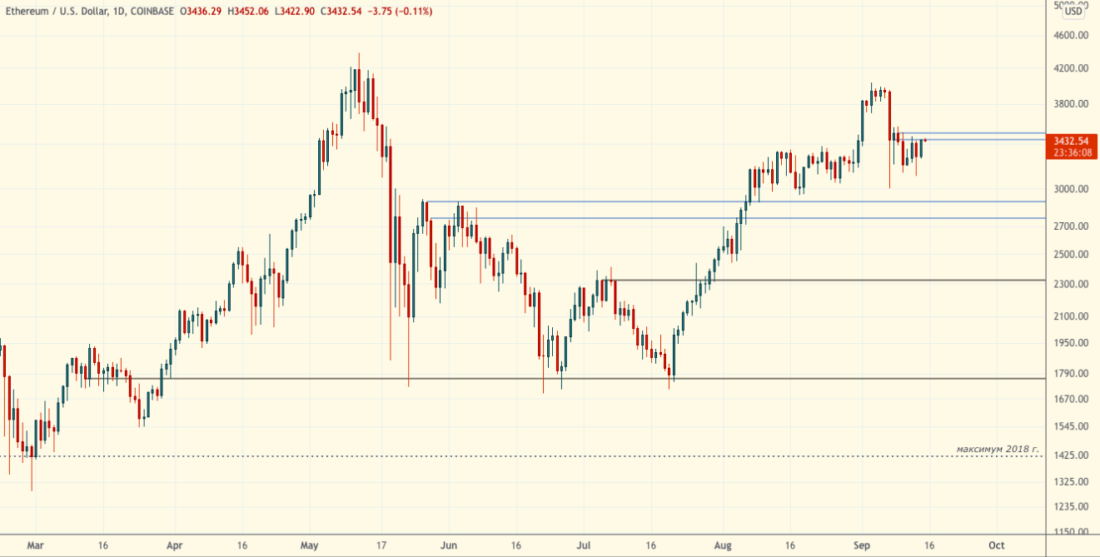
Chart executed in TradingView
In ETH / USD, the situation also does not look calm and stable, as in the crypto market as a whole.
Support is formed by the previous trading range (~ $ 3000 +), resistance is immediately higher, at the level of $ 3430–3500.
If the upper limit of the range isovercome, then there is a significant probability of movement to new record highs. If the market falls below, then $ 2,750-2,890 appears to be an attractive untested support level.
The current range ($ 3200-3400) is somewhat narrow for trading on higher timeframes, but in general, the support for $ 3000 is still valid, as well as in BTC / USD.
Strong bullish momentum in Tezos
Chart executed in TradingView
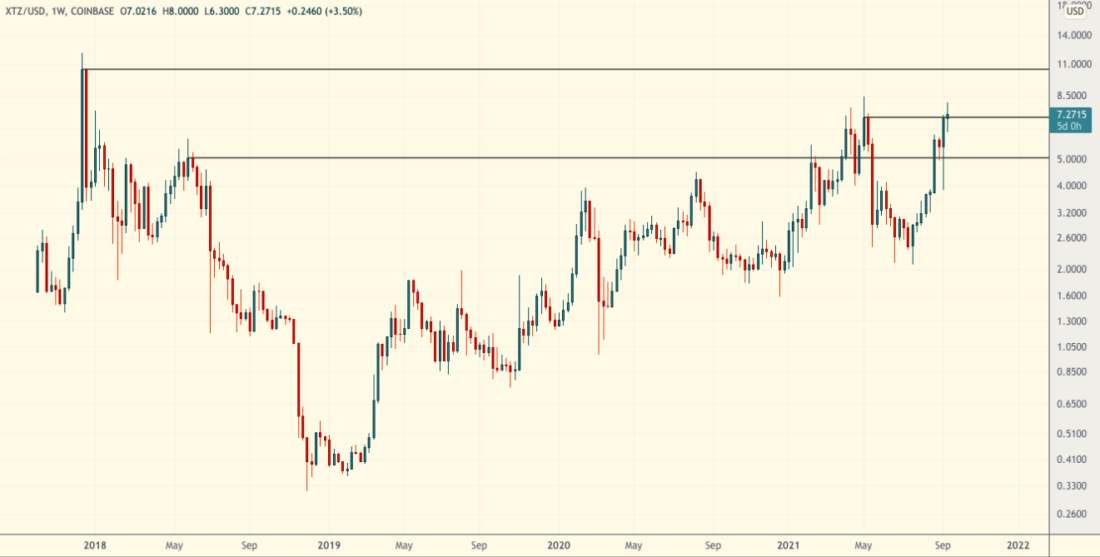
Chart executed in TradingView
Tezos demonstrates strength against the background of the general weakness of the crypto market.
This is generally a good indicator.availability of demand for the asset. In other words, if an asset shows strength against the background of the weakness of the market as a whole, then it is likely that it will look even stronger against the generally favorable background. There is also news of Tezos' upcoming NFT collaboration with OpenSea, which could be a good tailwind for this market.
But, as always, a significant drop in bitcoincan ruin a brewing party in the bud. So a bet on any altcoins assumes a certain amount of strength and stability in the main cryptoassets.
Finally, how the situation looks from the point of view of TA. In essence, it develops as a breakout into the zone of defining new price levels. Double tops are not very common in practice.
However, any weakness in BTC / USD orpost-breakout indecision potentially refutes this thesis. The best possible scenario here is a strong continuation of momentum with no pullback or meaningful consolidation.
Pullback in the S&P 500
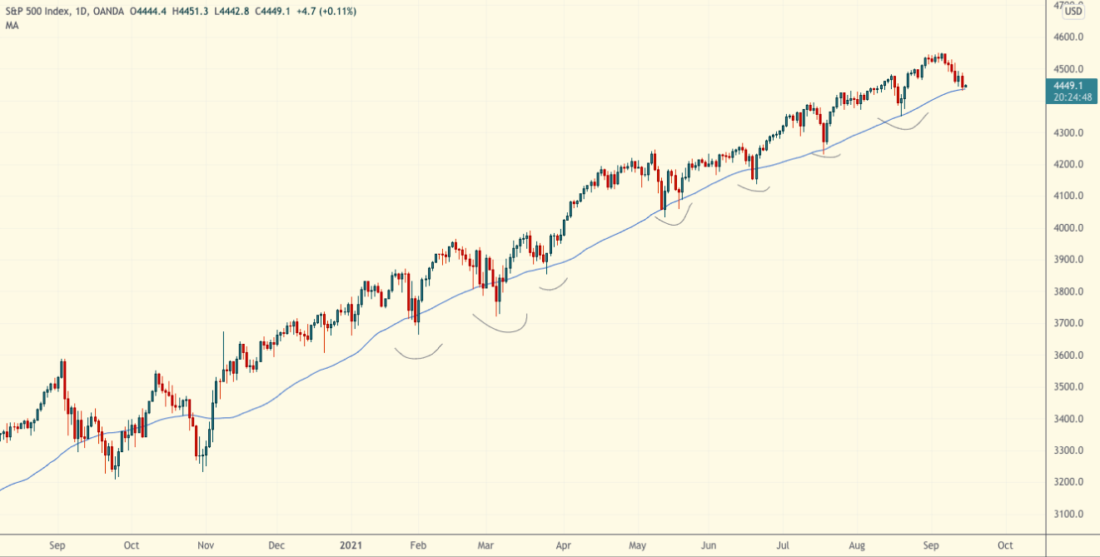
Chart executed in TradingView
There is a certain correlation between the bitcoin to dollar rate and the S&P 500 index.
More specifically, BTC/USD periodically shows a positive correlation with the S&P 500, especially to the downside. That is, when the S&P 500 falls, the crypto market also experiences a sell-off.
The crypto industry, of course, is not immune to major dips in traditional markets. You won't have to look for examples of this for a long time.
The S&P 500 has now corrected to its 50-day moving average (MA).
At this level the S&P 500 is trendingforming a bottom and, more importantly, the upward market structure (bigger lows/bigger highs) remains in place since the March 2020 “pandemic” lows.
In general, the situation in the S&P 500 looks like a standard bullish retest of the 50d MA.
If “this time everything is different”TM and support 50dIf the MA in the S&P 500 does not work out, then any signs of short-term and medium-term optimism in the crypto market will apparently be destroyed along with this support.
This is something worth adding to your watchlist for the next week or so.
BitNews disclaims responsibility forany investment recommendations that may be contained in this article. All opinions expressed express exclusively the personal opinions of the author and respondents. Any actions related to investment and trading in crypto markets involve the risk of losing invested funds. Based on the data provided, you make investment decisions carefully, responsibly and at your own risk.
�
</p>Read this:
 Correction to Support Levels - Technical Review September 8, 2021
 Weekly Support Breakout - Technical Review July 21, 2021
 Attempted ETH Exit Consolidation And Many Altcoins - Technical Review September 1, 2021
 Narrowing the Trading Range - Technical Review July 7, 2021
 Break of Weekly Resistance - Technical Review Aug 4, 2021
 Прорыв биткойна достигает сопротивления — Технический обзор от 11 августа 2021