Narrowing trading range in BTC/USD and bullish closing weekly candles in both major Ethereum pairsanother review by Cred and DonAlt, the authors of the Technical Roundup mailing list. From the altcoins, consider the DeFi index, which returned to the range after trying to break its lower border.
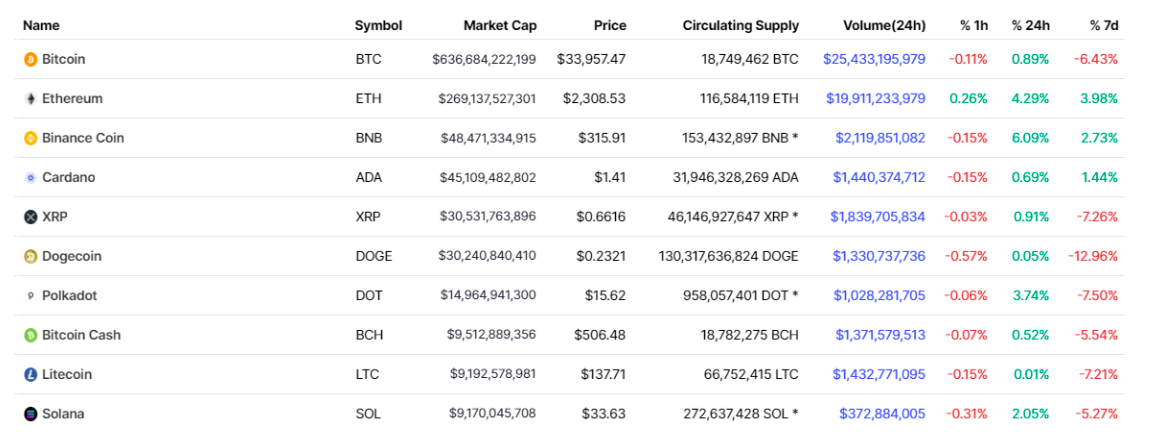
https://coinmarketcap.com/coins/views/all/
Bitcoin: range continues to narrow
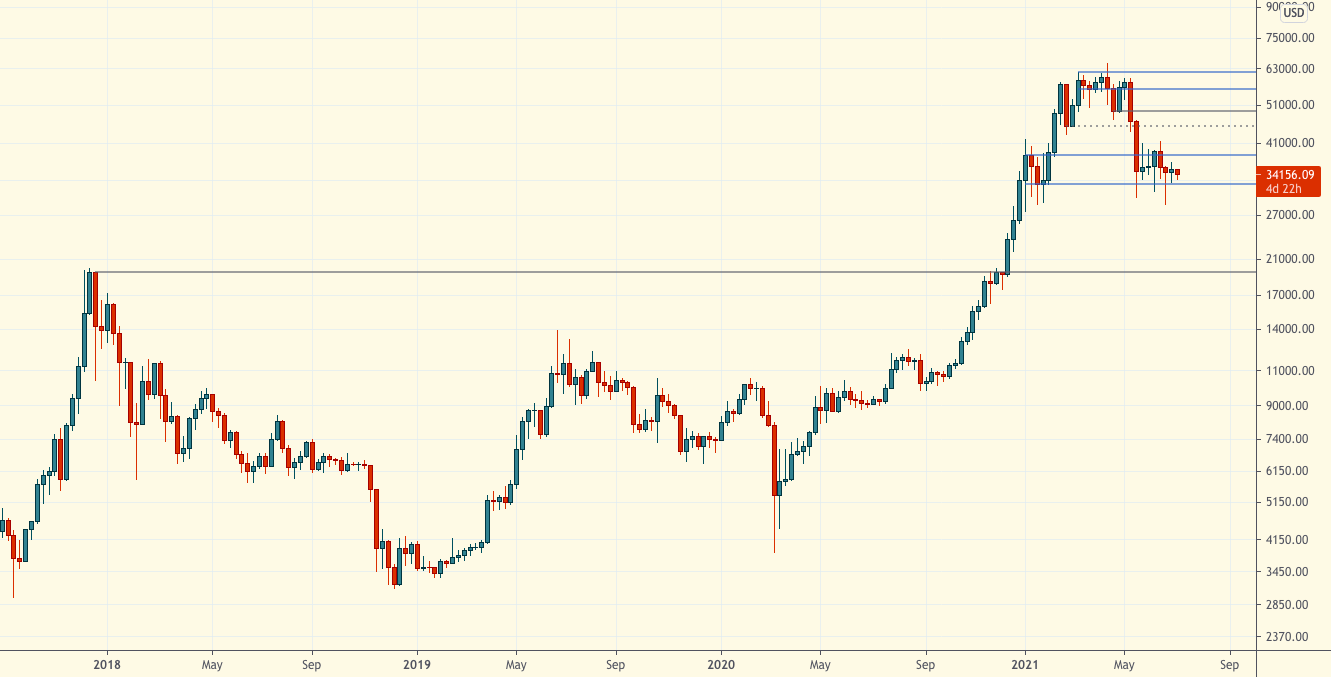
Chart executed in TradingView
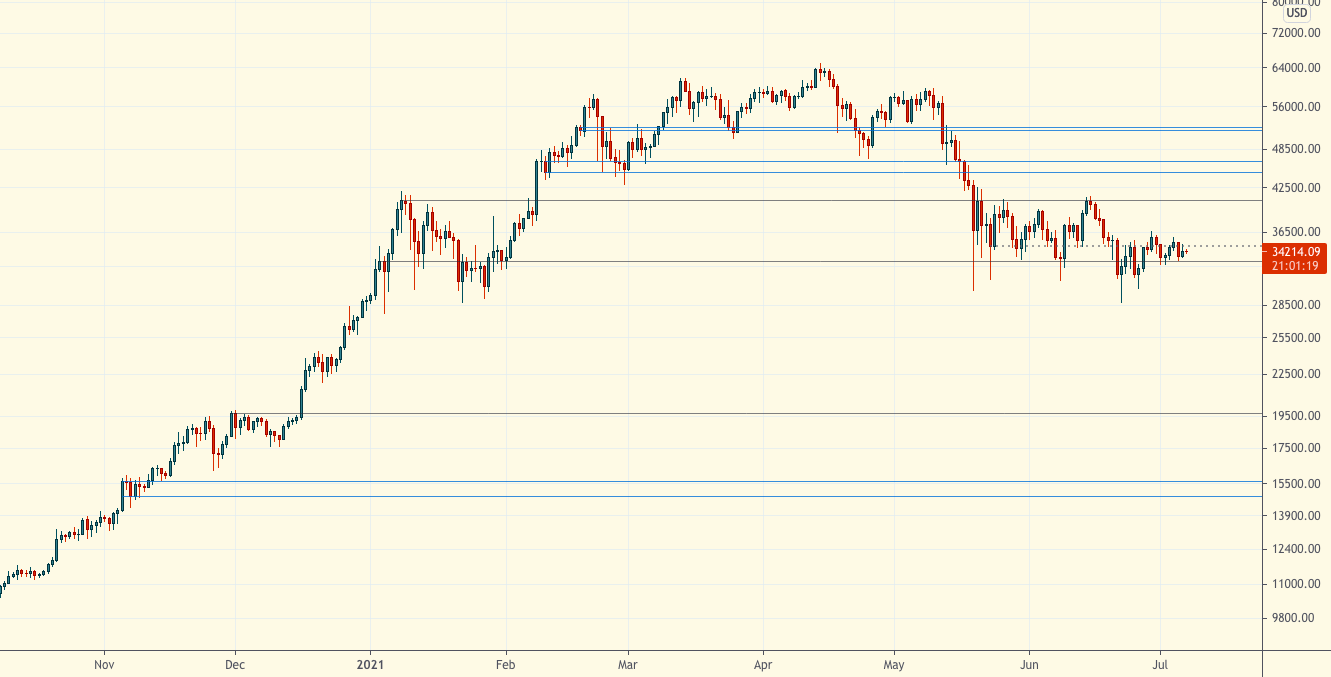
Chart executed in TradingView
On high timeframes the picture remains the same. BTC/USD is still trading in a range between support at $32.3k and resistance at $38.2k.
The price spent the past week away from the edges of the range (where the best trading opportunities usually occur), trading near its midpoint around $35,000.
From a TA perspective, a strong daily closethrough the middle of the range ($35 thousand) would be a reasonable signal to continue the movement to the upper limit. However, frankly speaking, this area has become the epicenter of the market's haircut this past week. Trading in this area has been challenging, and in general, the midpoints of ranges generally do not generate compelling market signals.
The news background was also mixed.The market is still reacting to headlines from China, such as yesterday's news that the company was shutting down for trading cryptocurrencies. At the same time, there is some positive news about the traditional hedge fund's plans to invest in the crypto industry.
For today we are stuck in a dead center, formingsmaller highs and larger lows in the middle of the trading range on high time frames. In our opinion, this is an unfavorable moment for long-term rates. If during this "haircut" you managed to avoid burning the deposit, then you probably coped with the situation better than most market participants.
Ethereum holds the $ 2000 level
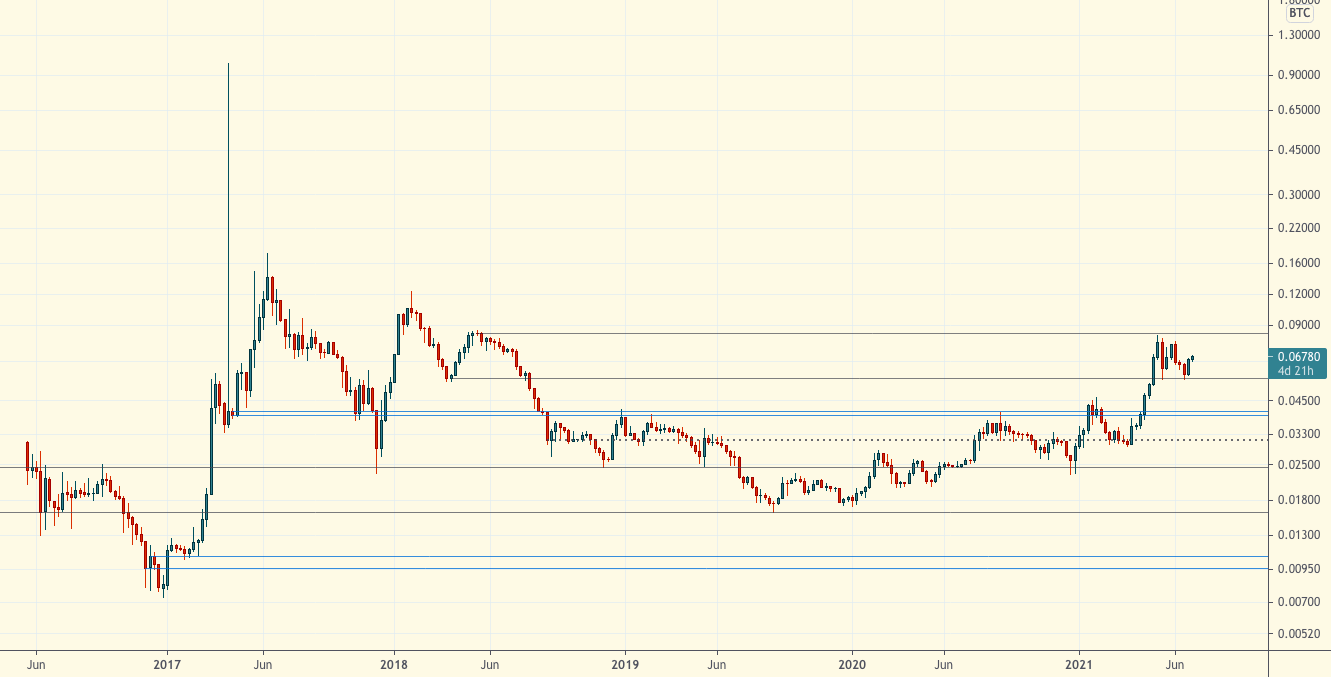
Chart executed in TradingView
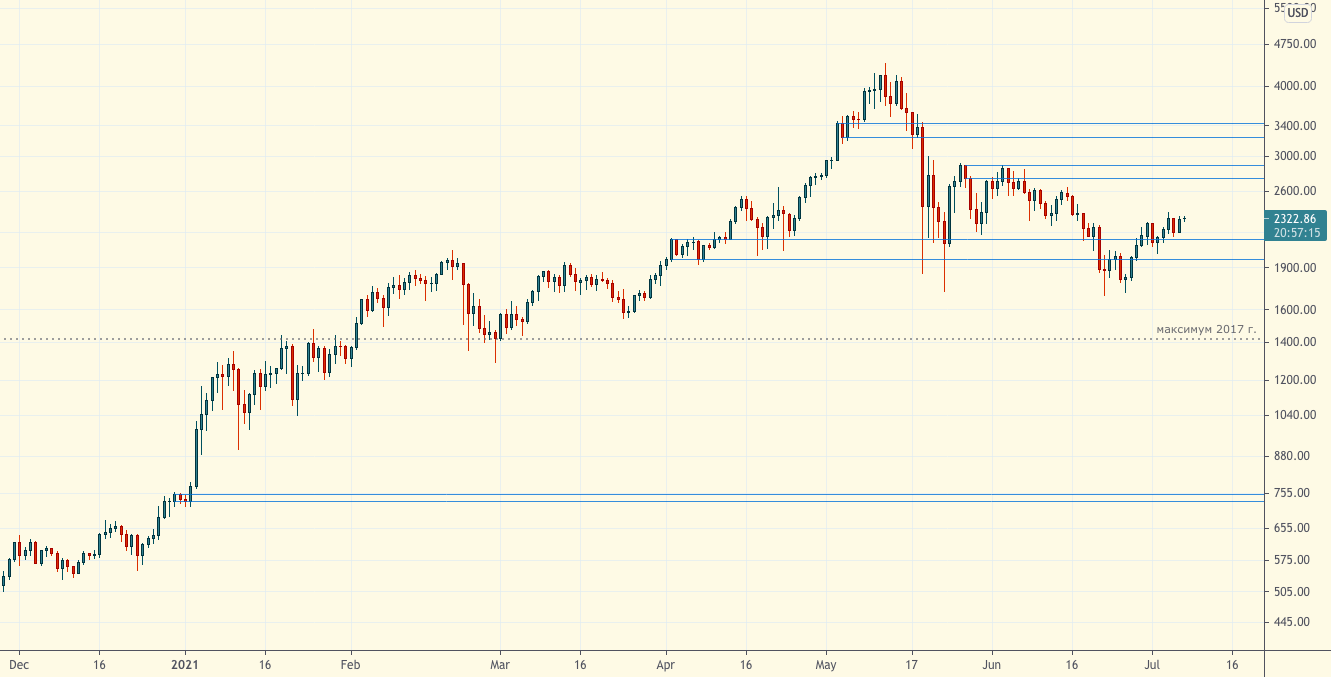
Chart executed in TradingView
Ethereum's weekly close was strong in both pairs. The main risk factor remains the Bitcoin situation.
ETH / BTC pair closed above the lower borderrange (₿0.055). The rebound that followed restored the daily structure in the ₿0.062 area. She is now support. Resistance is still at the upper border of the weekly range (₿0.084).
ETH/USD also looks good.Weekly support ($1800-1940) has held in the last couple of weeks at the close of the candles and the price has also recovered above the daily level at $1940-1960. As a result, we see a recovery in the daily range due to a rebound from weekly support. This is a testament to the strength of the market. The logical target level for such a recovery is the top of the range, i.e. the $2,750-$2,900 area.
As we mentioned above, in addition to the "technical"aspects, the main risk for bullish setups in ETH remains the situation in bitcoin. We still have no evidence of ETH decoupling from major movements in BTC / USD, and in the current circumstances, the peg is likely only getting stronger.
We wrote about one more consideration in the lastweek - that the altcoin-led market recovery is, on average, less reliable than the bitcoin-led recovery. Which is happening right now. Altseasons without the power of bitcoin can be profitable, but they are likely to be very short-lived. One way to mitigate the risks is to practice altcoin setups if they meet your criteria, but either in the spot market or in USD leveraged instruments.
DeFi Index: Rebounding To Range
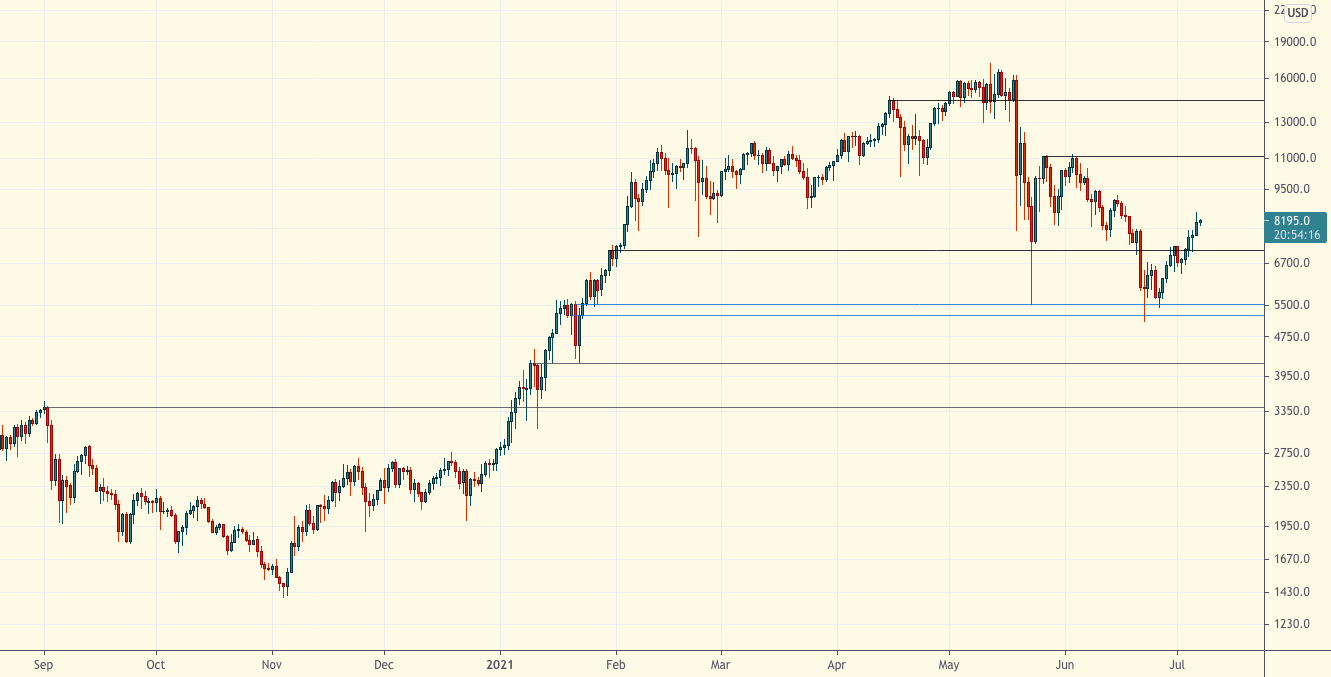
Chart executed in TradingView
DeFi is spearheading the recovery.At the time of writing, the rebound in the DeFi index is outperforming BTC, ETH, and other major coins. Also, and more importantly, the DeFi Index outperforms the Shitcoin Index ($ SHIT).
Last week we noted a movement towards the bottomthe range boundary is at $7140. This range has been restored. And while the lower limit acts as support, we expect a movement to the upper limit of the range at $11,070.
The technical levels are not perfect.What is probably more important is to see a confident continuation of the trend without excessive fluctuations in the $ 7000 area. If this is a quality recovery, then the price should quickly move away from this level and stay away from it.
This week we did not include graphics in the review.specific DeFi assets. There is a good reason for this. While the DeFi index points to broader strength, many of the DeFi assets we are following have quickly pushed off lows (some have accidentally doubled in value) and have now reached resistance or areas where some profit taking can be expected.
In other words, the DeFi index looks decent,but we do not want to recommend individual DeFi assets for resistance. Perhaps next week will provide us with clearer technical setups for DeFi assets.
The article does not contain investment recommendations,all the opinions expressed express exclusively the personal opinions of the author and the respondents. Any activity related to investing and trading in the markets carries risks. Make your own decisions responsibly and independently.
</p>
Read this:
 Tired Market Structure and Gloomy Macro Environment - Technical Review June 23, 2021
 Bears Are Out of Business Again on the Weekly Timeframe - Technical Review June 30, 2021
 Technical Overview | May 26, 2021
 Technical Overview | June 16, 2021
 Technical Overview | May 5, 2021
 Technical Overview | May 19, 2021