Bitcoin price appears poised for a breakout above $40K, putting new all-time highs within reach.highs.
The price of BTC broke through the important level of $35 thousand.and continued that momentum to $40K and beyond on February 6, just days after MicroStrategy held its presentation on Bitcoin and investing in it to over 1,400 companies.
Breakout of $35k resistance.was significant because it opened the way to a new test of recently established price highs. The level around $40K remains the last obstacle for BTC on the way to new heights, while many altcoins updated their highs last week.
Indeed, the crypto market has moved intoparabolic growth, and many investors are now happy to watch the value of their portfolios rise. However, the DeFi market in particular appears to be at serious risk of overheating, as with a breakout of $40k, Bitcoin could regain dominant momentum and market focus.
Also, is the upcoming listing of ETH futures on the CME likely to have a significant impact on the market, or will Bitcoin continue to rise? Let's turn to the graphs.
Bitcoin Needs To Break Last Resistance Before New Price Highs
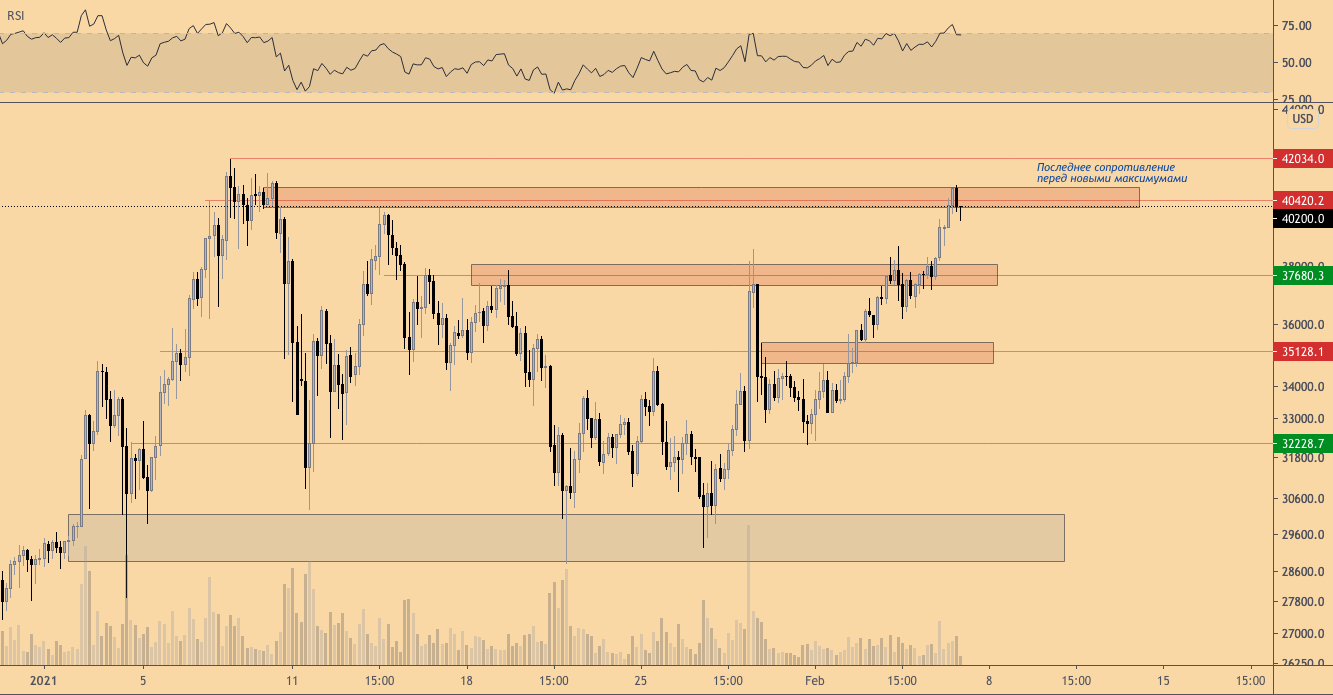
XBT/USD, 4-hour chart. :TradingView
On the 4-hour BTC price chart we see a beautifulbreakout above $35K and a healthy continuation of this momentum to $40K. There was a small pullback from $38K, but overall this level did not provide significant resistance for the price.
Before that, it had already been tested during the “pump”Mask” and then the price sharply rolled back on the same day. So when Bitcoin managed to break above $35K again, it was not surprising that this momentum continued into the $40K level instead of another pullback from $38K.
This area is $40k.is the last hurdle for Bitcoin before heading to new all-time highs. However, this new show of force also means that its dominance in the cryptocurrency market is set to be restored at the expense of the majority of altcoins.
Is the Bitcoin Dominance Index ready for such a move?
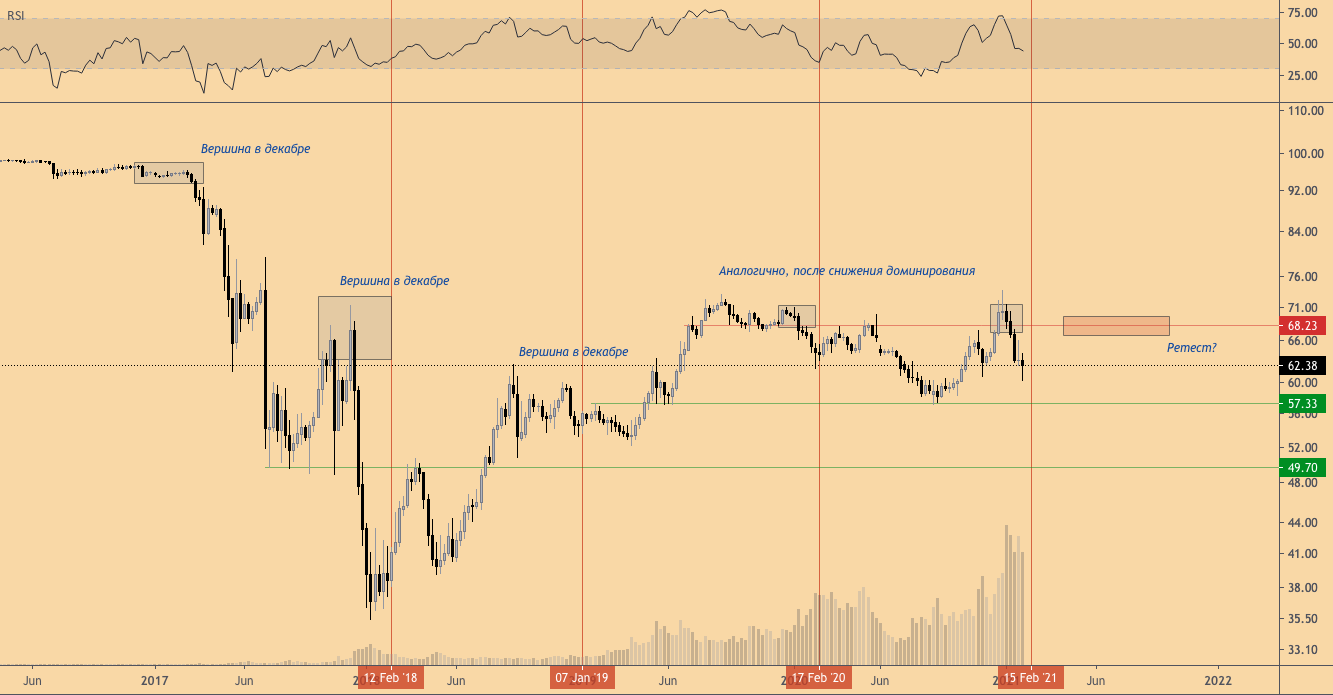
BTC Dominance Index, 1-week chart. :TradingView
Bitcoin Dominance Index is a beautiful graph,clearly demonstrating how market cycles work. In recent years, bitcoin dominance peaked in December, followed by a surge in altcoins traditionally led by Ethereum. This was accompanied by a significant decline in the BTC dominance index in January.
This year, the trend repeated itself. Altcoins have moved into parabolic rallies, setting new all-time highs amid the consolidation of BTC in a relatively tight price range.
However, any market rally has a beginning andthe end, and altcoins will inevitably be corrected. Historically, in February, the bitcoin dominance index formed a temporary bottom, after which its value increased slightly. This rise in BTC dominance would appear to be in line with a potential correction in ETH.
CME Launches ETH Futures Trading atMonday 8 February and a correction in the near future shouldn't come as a surprise to us. This is exactly what happened when Bitcoin futures were launched in December 2017. That listing marked the top of the previous Bitcoin bull cycle and the start of a multi-year bear market.
Thus, the ETH price correction appears to bevery likely when investors switch attention back to bitcoin, especially given the absurdly high gas fees of late. The market shift that can be expected with this combination of factors will lead to a significant increase in Bitcoin's dominance.
What are the following points of interest for Bitcoin?
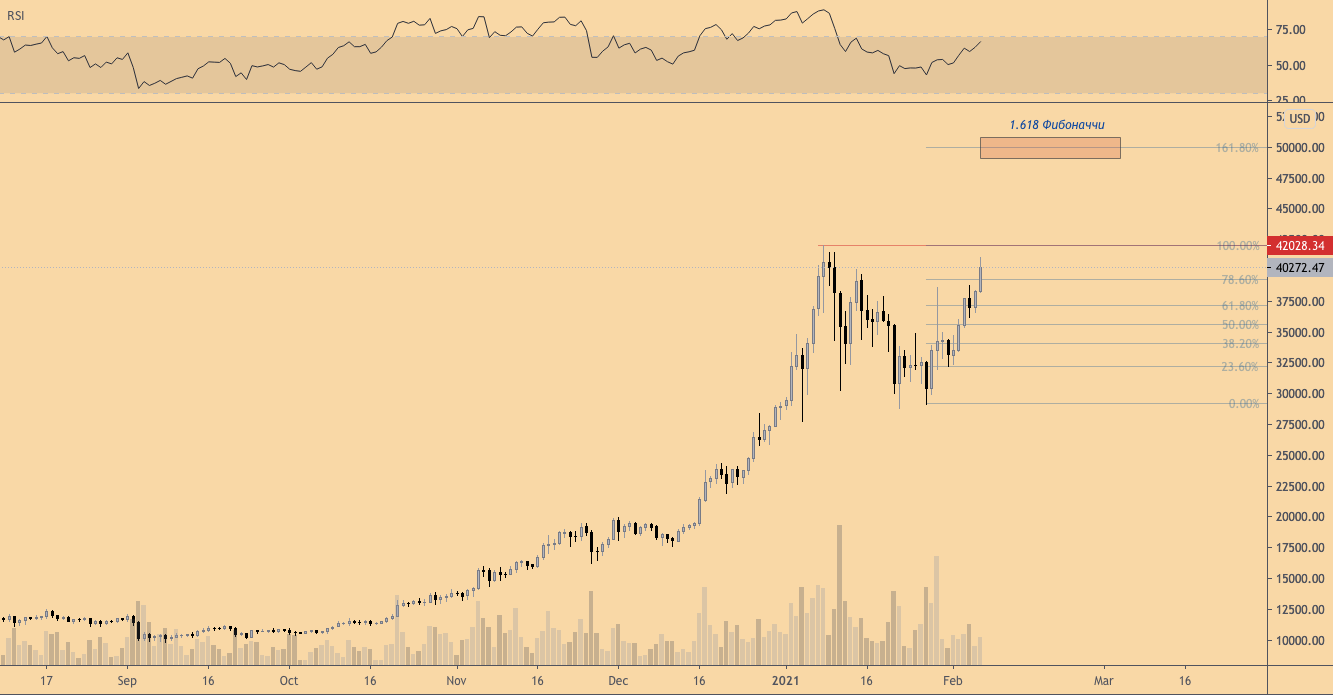
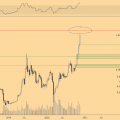
BTC/USD, 1-day chart. :TradingView
To determine the next target levels forBTC prices can be used on a 1-day chart. If Bitcoin can break through the resistance area around $40.5K, then the next high interest levels can be tried to be identified using a Fibonacci extension.
When using this technical toolanalysis, most often the price clearly reacts to the level of 1.618. Should Bitcoin break through the current resistance, this suggests a potential target level for its price of around $50K.
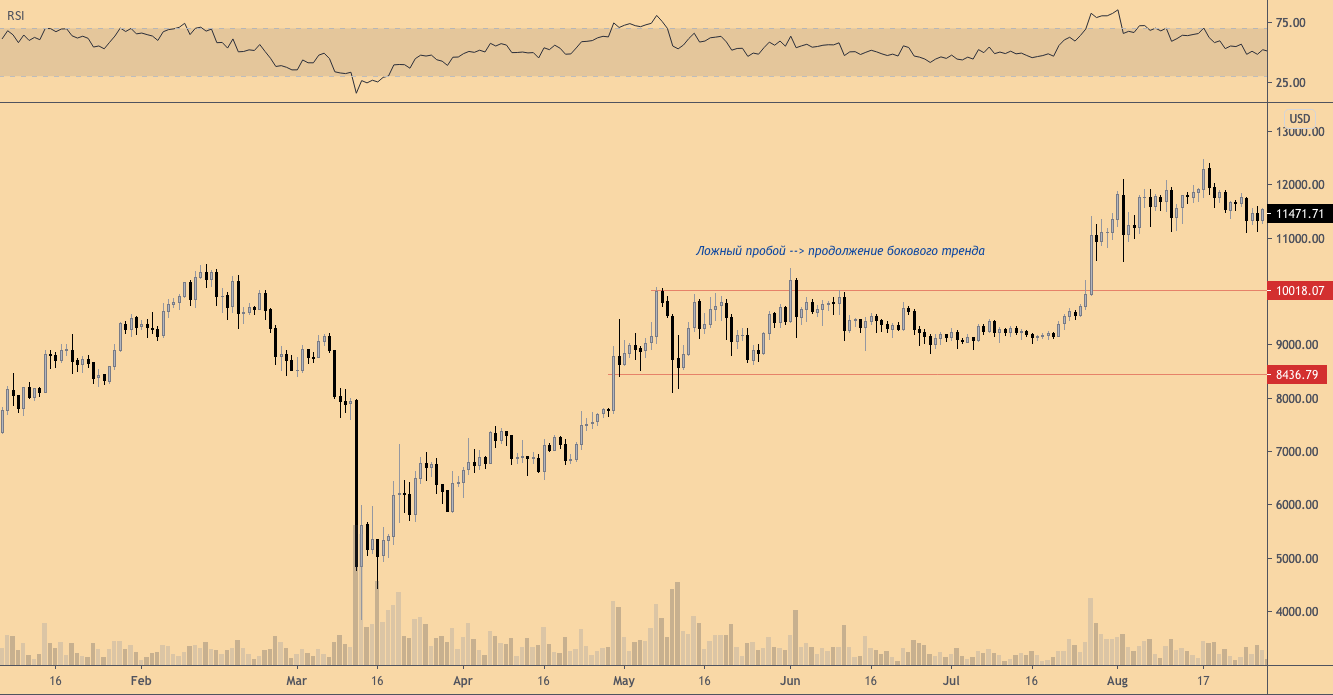
BTC/USD, 1-day chart. :TradingView
However, in recent months, the price of BTC has already passedthrough a very serious rally. Therefore, a clear breakout of the previous peak level must be combined with a clear flip of this resistance to support. Otherwise, as history shows, the most likely scenario would be continued consolidation in the same range.
In the historical chart above, BTC attemptIt failed to break above the recently established (post-halving) highs, which led to further long-term consolidation in the horizontal range. However, a clear breakout above the previous peak of $42K would likely ensure Bitcoin's price rises quickly to $50K.
The article does not contain investment recommendations,all opinions expressed are solely the personal opinion of the author. Any activity related to investing and trading in the markets carries risks. Make your own decisions responsibly and independently.
</p>
Read this:
 Bitcoin bounced back to $ 18K after a successful support retest. What's next?
 Should traders worry about a series of smaller highs after a pullback from $ 12K?
Bitcoin hasn't seen three positive quarters in a row since 2017
Should traders worry about a series of smaller highs after a pullback from $ 12K?
Bitcoin hasn't seen three positive quarters in a row since 2017
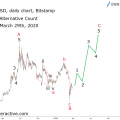 Ahead of the 2017 bitcoin growth with Elliott waves
PlanB: average monthly investments in BTC since 2017 amounted to $ 400 million
Ahead of the 2017 bitcoin growth with Elliott waves
PlanB: average monthly investments in BTC since 2017 amounted to $ 400 million
 Binance delisted FTX credit tokens after significant user losses, and a month later added their clones