The BTC price has impressively held the support level at $17.200, and this putsWithin Reach of the Newhike to historical highs.
Bitcoin has seen breathtaking gains this year, especially since September - rallying from $ 10,500 to $ 18,400 - up 75% - in less than three months.
Moreover, since March, the BTC / USD rate has risen by almost 400%, making Bitcoin the most profitable asset in 2020 and likely caught many investors by surprise.
Let's take a look at the charts and try to understand whether the current rally is sustainable and whether we should expect a reversal in the near future.
Bitcoin Reaches 1.618 Fibonacci And May Form A Peak Soon
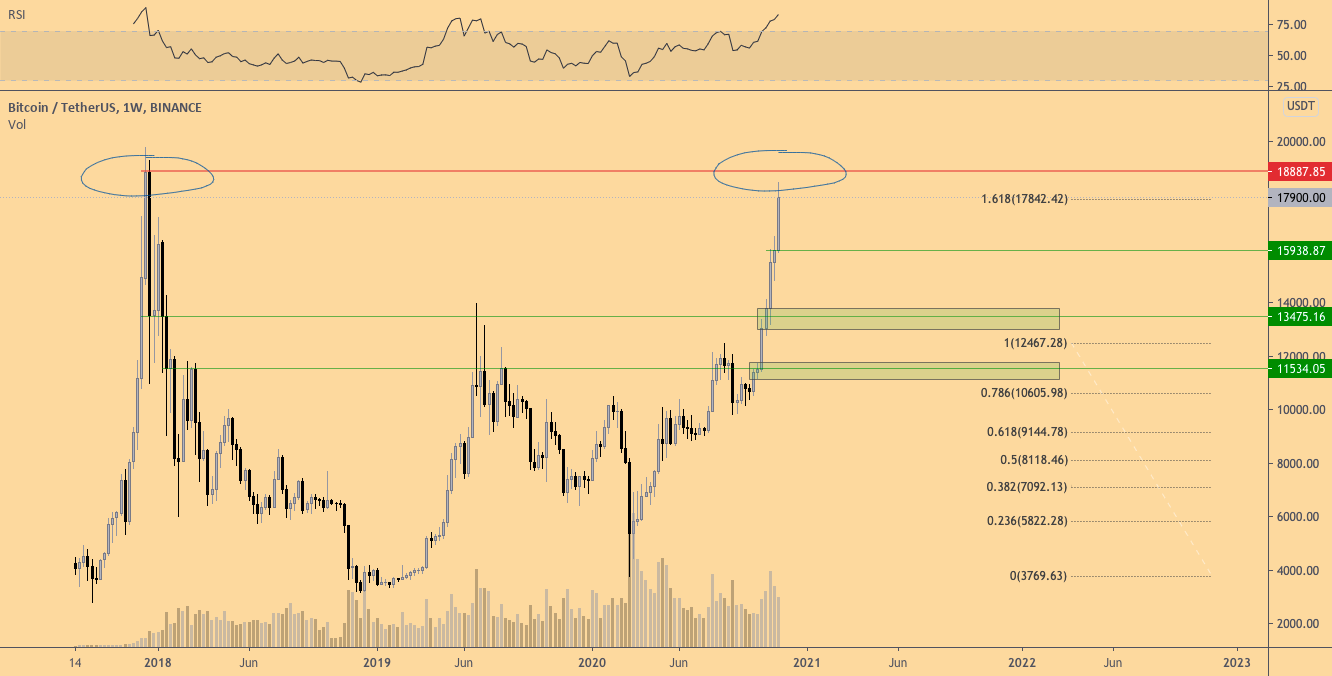
BTC/USDT, weekly chart. :TradingView
On the weekly chart, we are seeing a strong rally and reaching an area of historical highs.
An obvious resistance zone is indicated at this high, which can serve as a signal for investors to take some profit.
Which, however, may be even more important,also reached the 1.618 Fibonacci extension level. The Fibonacci Expansion is a powerful indicator for indicating potential local highs and lows, and the 1.618 level is perhaps the most significant.
Today, there are many arguments in favor of a possible correction in Bitcoin, including the record high values of the fear and greed index.
There are several key levels worthpay special attention in case bitcoin corrects before taking $ 20,000. The first potentially interesting level for traders can be found around $ 16,000. The next ones are around $ 13,500 and $ 11,600.
Total market capitalization reaches $ 500 billion
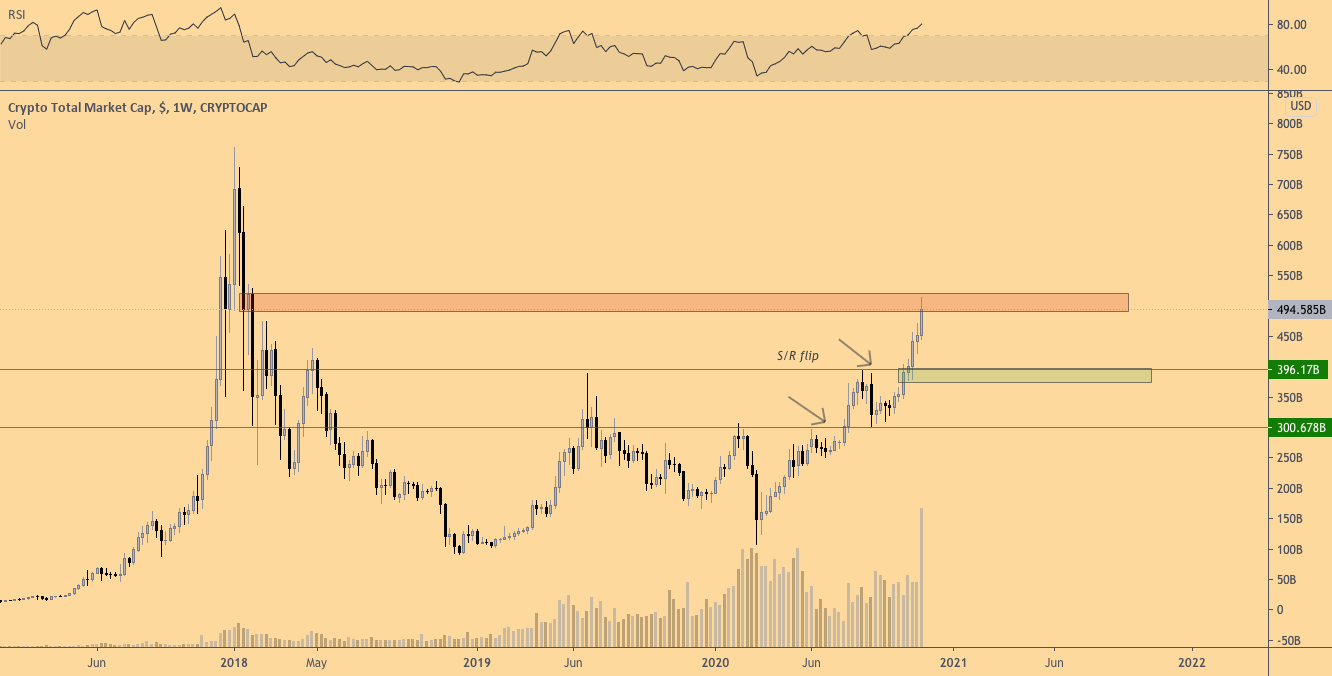
Total capitalization of the crypto market, 1-week chart. :TradingView
The total market capitalization of cryptocurrencies has reachednext and last zone of resistance before a possible hike to new all-time highs: $ 500 billion is likely to be a significant obstacle along the way.
It is noteworthy that bitcoin is now only ~ 10% below its historical price maximum and has already renewed its record for market capitalization.
Meanwhile, the total cryptocurrency market capitalization is still35% below its all-time high. This shows once again that Bitcoin is currently in the spotlight. Altcoins are likely to start catching up later.
However, if the cryptocurrency market startscorrected, the most probable area of change of support / resistance (S / R) is $ 380-400 billion. This level has not yet been tested, so a successful test of it as a support will certainly be a signal of readiness for continued growth.
S / R retests like this are quite common in bull markets and are very useful for continuing a sustained uptrend.
Will Bitcoin Dominance Peak in December?
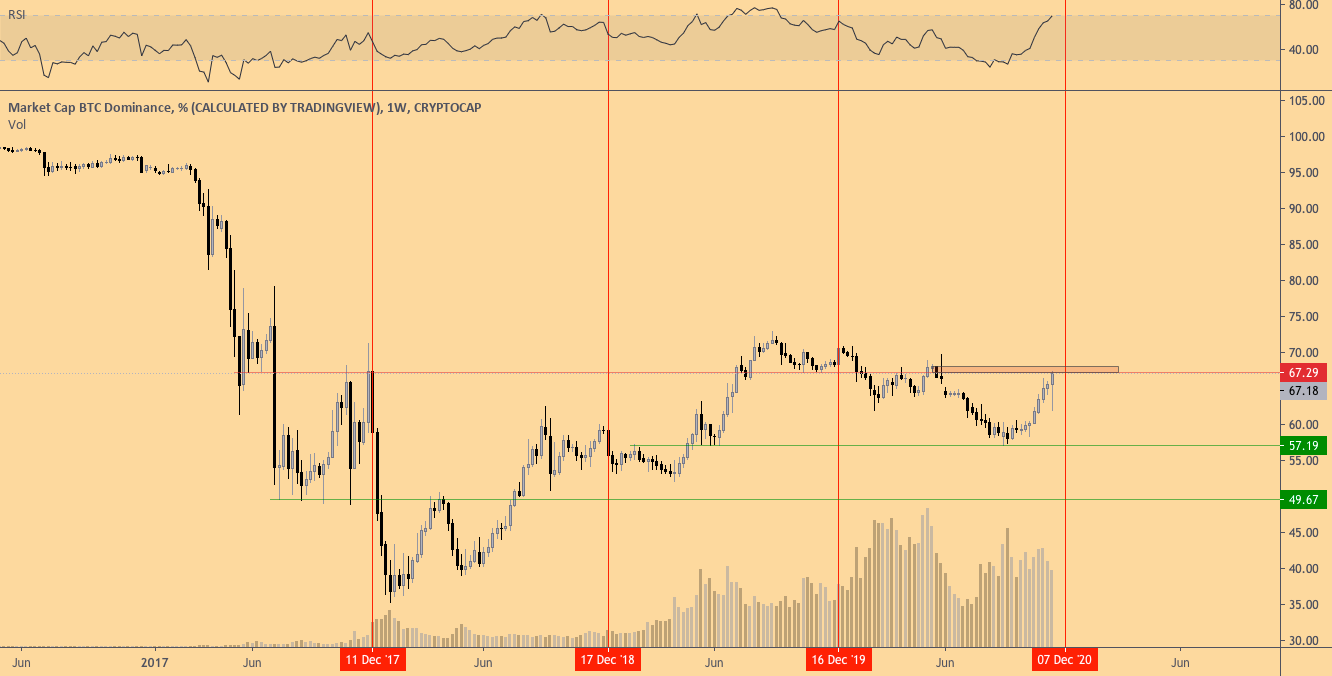
BTC Dominance Index, 1-week chart. :TradingView
Historical data tells a lot about marketcycles. So far, the fourth quarter of 2020 is showing many signals reminiscent of previous years. One of them is the rise in the Bitcoin Dominance Index, which has risen to 66% in recent weeks.
As long as bitcoin is in the spotlight, altcoins have little chance of a solid rally. And if Bitcoin starts a correction, then altcoins are likely to fall even more.
However, it is likely that the moment whenaltcoins will explode with dizzying fireworks, approaching every day. The key indicator here is traditionally the strength of the ETH / BTC exchange rate and whether the ETH / BTC price has already formed a bottom.
The best conditions for altcoins are usuallygradual and steady growth of bitcoin. As soon as such a period comes - most likely in the first quarter of 2021 - a powerful upward momentum can be expected for very, very many altcoins.
The article does not contain investment recommendations,all opinions expressed are solely the personal opinion of the author. Any activity related to investing and trading in the markets carries risks. Make your own decisions responsibly and independently.
�
</p>Read this:
 Should traders worry about a series of smaller highs after a pullback from $ 12K?
Dan Morehead: “Bitcoin and blockchain can transform 50 industries”
Should traders worry about a series of smaller highs after a pullback from $ 12K?
Dan Morehead: “Bitcoin and blockchain can transform 50 industries”
 Bitcoin fell below $ 8,000
Bitcoin, what's next?
Tony Weiss: “Bitcoin is strong and without the support of the Lightning Network”
Tim Draper: “It is Bitcoin that will help the world after the crisis”
Bitcoin fell below $ 8,000
Bitcoin, what's next?
Tony Weiss: “Bitcoin is strong and without the support of the Lightning Network”
Tim Draper: “It is Bitcoin that will help the world after the crisis”