In another review, analyst Will Clemente analyzes the current situation in the bitcoin market, with the help ofon-chain metrics separating signal from noise.
Dear readers, I hope all is well and a successful week for you. Let's take a look at some of the top trends this week.
Key points:
- The dynamics of on-chain supply correspond to the levels previously observed at prices of $58–59 thousand.
- All kinds of macrometrics from the Supply Shock series speak of market strength.
- BTC exchange balances have decreased by ₿17,104 in the last week and by ₿125,501 in the last 30 days.
- Long-term owners continue to sit idle, not using the liquidity of this price rally to exit the market.
- Bitcoin is consolidating between $50k and 200d MA, also at the top of the on-chain volume cluster.
- It's already five days in the volatility squeeze zone, which is likely to resolve next week.
- The market as a whole remains profitable.
- Hashpower keeps coming back to the networkthe Hash Ribbons indicator gives a buy signal, the profitability of mining has slightly decreased after adjusting the difficulty, the aggregate balance of miners has decreased by ₿1658 over the past 10 days.
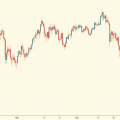
Bitcoin Continues Consolidation Between 200 Daymoving average (MA) and key technical and psychological resistance at the level of $ 50,000. Also, from the point of view of TA, we entered the volatility squeeze zone, which is indicated by the Wick HTF indicator. This portends a lot of movement. But in what direction should this contraction be resolved? I think you can look for clues in on-chain metrics.
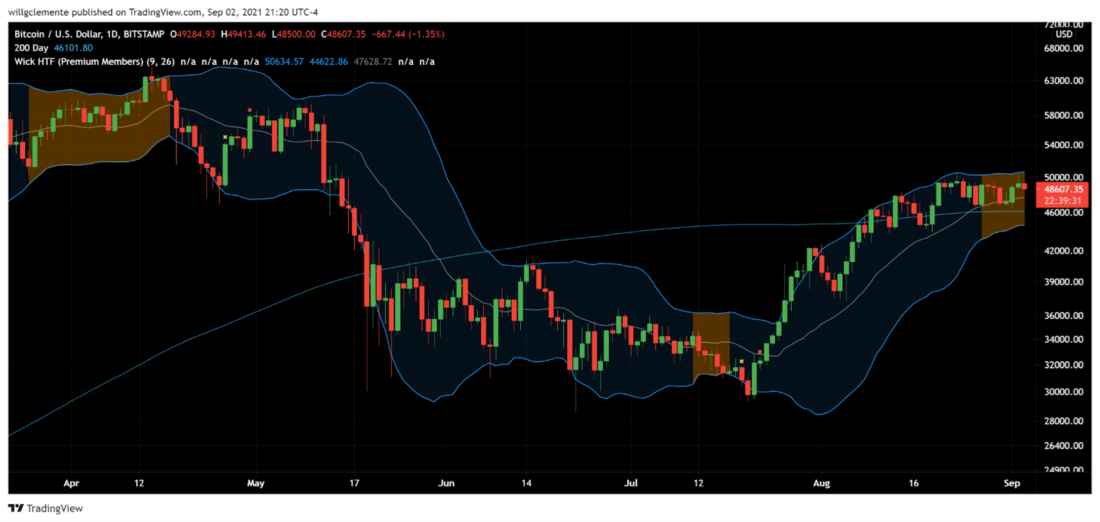
Chart executed in TradingView
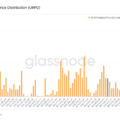
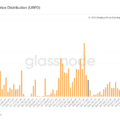
We can observe three main clusterson-chain volumes representing key levels of capital flow into the market. 15.48% of Bitcoin's money supply moved between $32K and $40K, 9.63% moved between $46K and $50K, and 7.08% moved between $54K and $60K. If Bitcoin can break solidly resistance is $50 thousand, then from the point of view of on-chain volume, it will enter the free space between this level and $54 thousand.
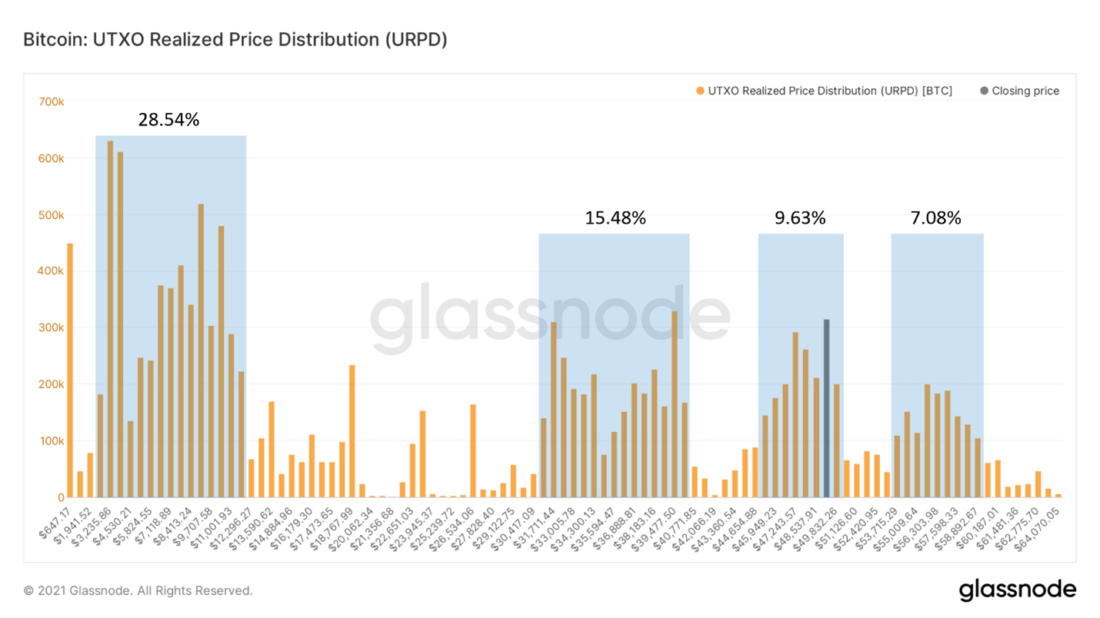
URPD (UTXO Realized Price Distribution)
As a way to assess the state of profitability of the market inIn general, we can use the SOPR (Spent Output Profit Ratio) metric. The SOPR reproduced the textbook trend reversal pattern, breaking through the 1.0 threshold, testing it as a support and stabilizing above it. This confirms that in terms of on-chain indicators, the market as a whole is in an upward trend.
Note:from the moment the indicator is reset to 1.0 (at a pricecorrection) a month has already passed, so I would not be surprised if we see another such reset in the near future. On the other hand, at the end of last year the market went without it for months.
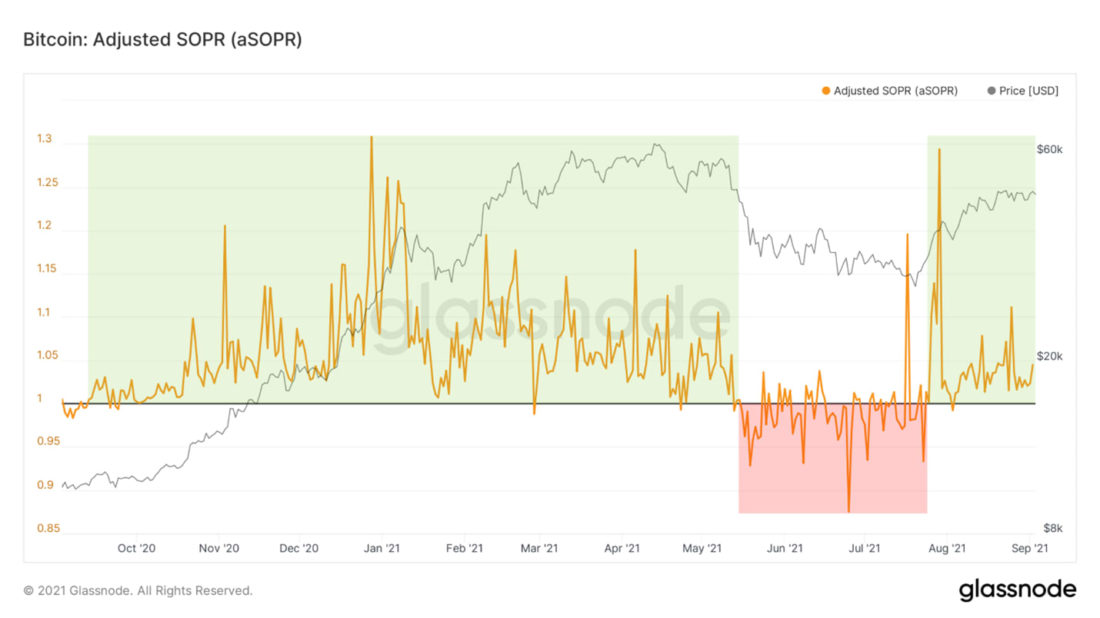
Adjusted profitability ratio of spent outputs
Let's move on to our accumulation metrics. Currently, Bitcoin's supply dynamics looks very strong for reasons which I will discuss below.
First, the RSI of the illiquid proposal (I createdthis indicator a few months ago). It tracks the broader “supply shock” trend in the market using a 365-day stochastic RSI applied to a metric that measures the 30-day change in illiquid supply.
When this oscillator goes from full resetto go beyond the range, I see this as a signal to buy or a supply shock in the market. As illiquid supply only increases, it looks like the full impact of the current supply shock is just beginning to manifest.
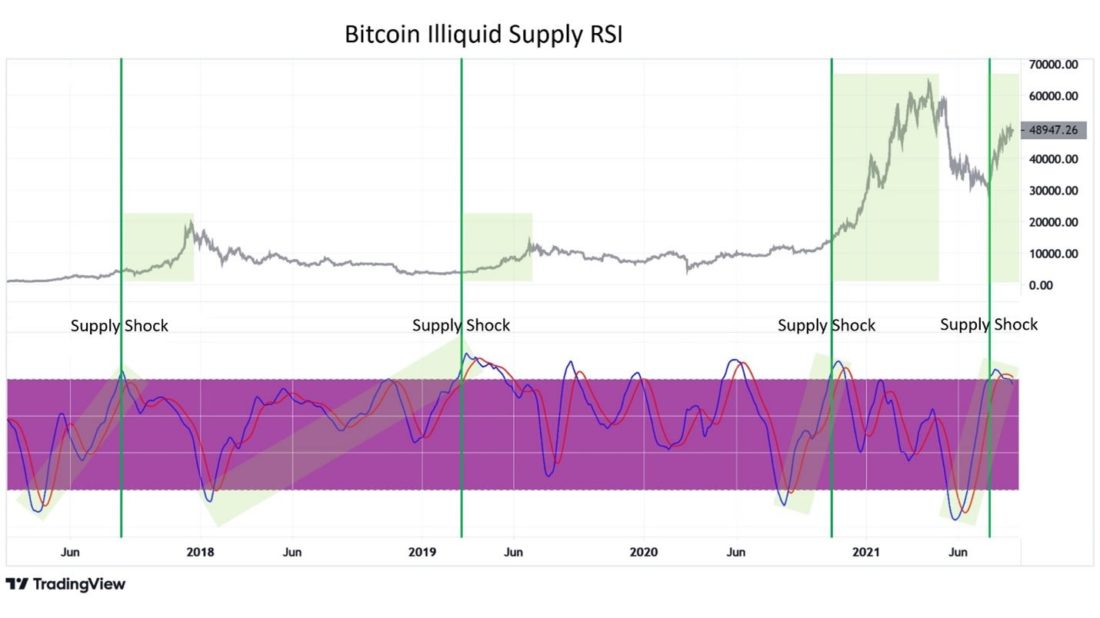
RSI for Bitcoin Illiquid Supply
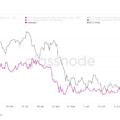
Second, there is a series of Supply Shock ratios:for illiquid supply (monitors the movement of coins from speculators to "strong hands"), highly liquid supply (monitors the movement of coins from highly liquid to liquid network entities) and exchange supply (in essence, correlates the number of coins readily available for purchase with the total volume of circulating supply).
The momentum in these metrics, outlined this week, has already raised the price to $ 50 thousand, but all three metrics continue to grow, signaling the continuation of the upward movement.
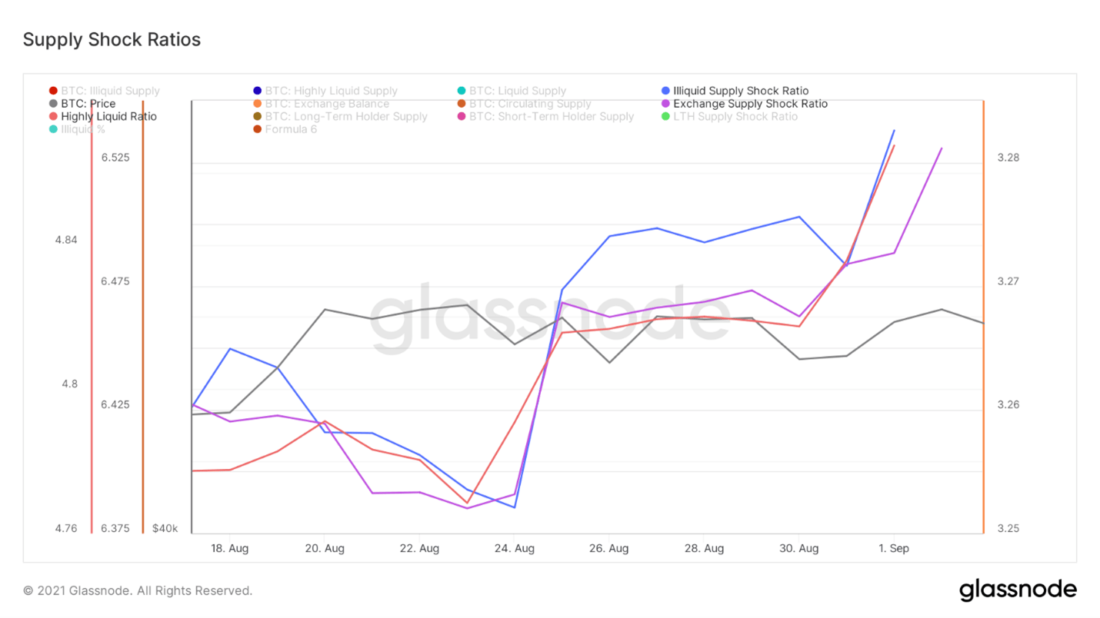
Supply Shock Ratios: Highly Liquid Supply (Red Curve) Illiquid Supply (Blue), Stock Offer (Purple)
From a macro perspective, illiquidsupply has clearly gone beyond the boundaries of its historical pattern, demonstrating levels of accumulation never seen before. If I were looking for a graph that vividly illustrates that this time everything is different, then I would choose this one. After last year's COVID-19 collapse, collectively, market players are holding onto their coins stronger than ever.
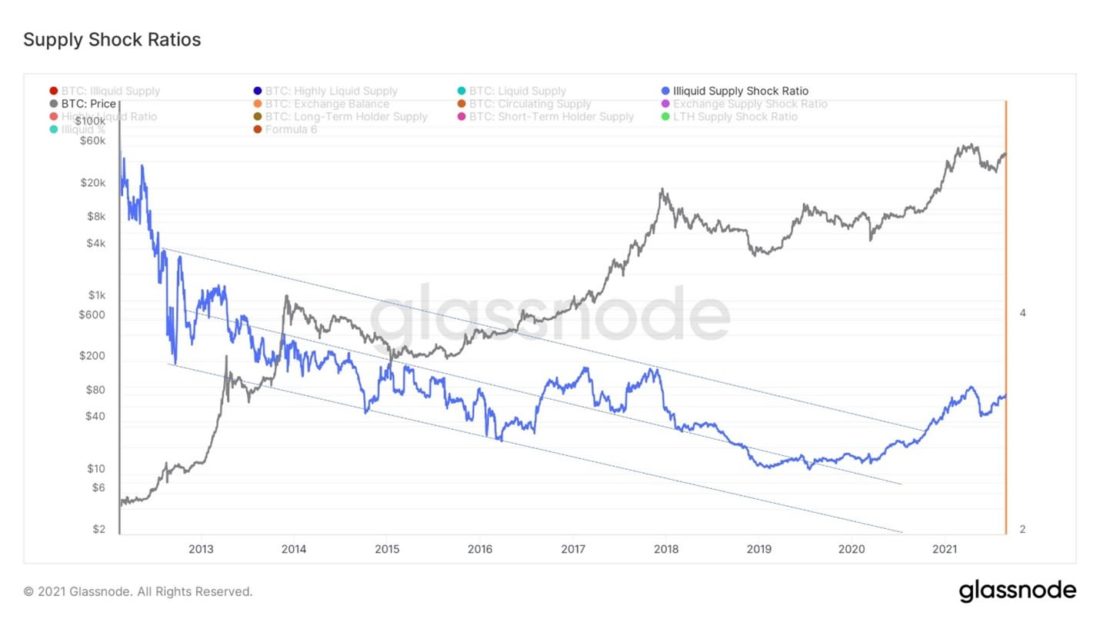
Supply Shock Ratio for Illiquid Supply
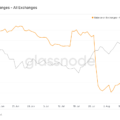
Moving on to the supply flows onstock addresses, here are the four main charts I used to track these flows. As you can see in the graph on the top left, total exchange balances are declining again this week, down 17,104 BTC in the last week and 124,501 BTC in the last month. The chart of changes in the net position of the exchanges on the top right indicates the continuation of the trend towards accumulation.
Finally, comparing the graphs of the balances of the two largestexchanges, you can see an interesting dynamic: it looks like the coins are being withdrawn from Coinbase, but coming to Binance. This may reflect the difference in sales between East and West, but it could also simply reflect the demand for speculative products that Binance makes available.
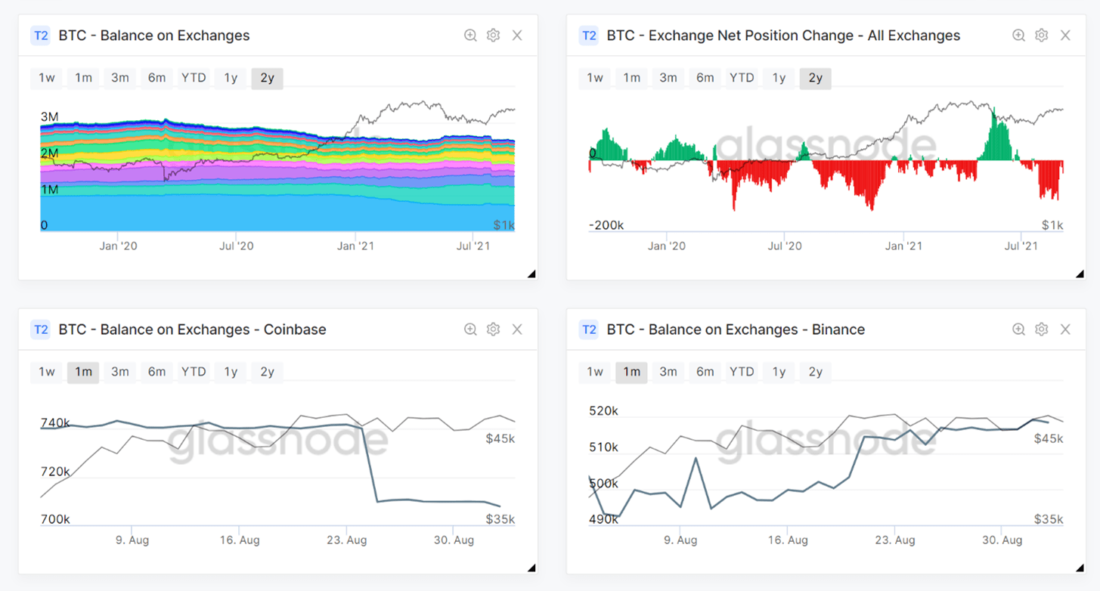
Exchange balances (all exchanges), change in net position of exchanges (all exchanges), exchange balances (Coinbase), exchange balances (Binance)
Then I prepared another metric, whichcreated a few weeks ago: stablecoin exchange reserve ratio. It monitors the supply of stablecoins on exchanges. In general, combining this coefficient with the exchange flows of BTC, it is clear that stablecoins are received on exchanges, and BTC are withdrawn.
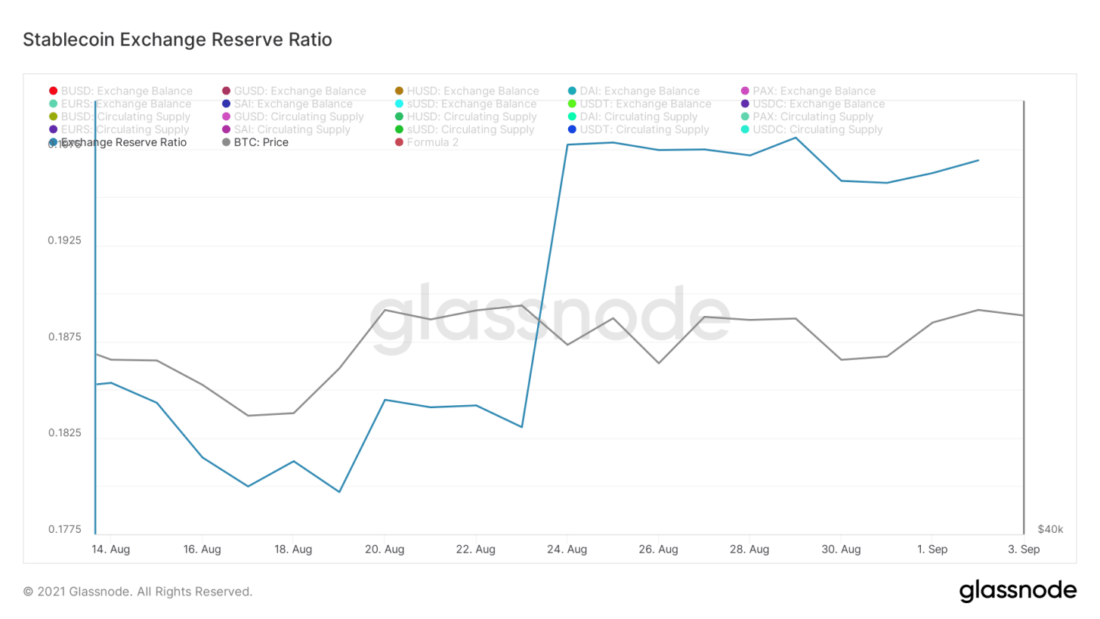
Stablecoin exchange reserve ratio
One final note on accumulation:long-term owners still show no visible signs of waning confidence. The volumes of BTC they hold continue to hit record highs. As a percentage of the adjusted supply volume (adjusted for lost coins, defined as UTXOs that have not moved in over 7 years), long-term holders now hold 85.2% of the supply, and 68.1% of the total circulating supply.
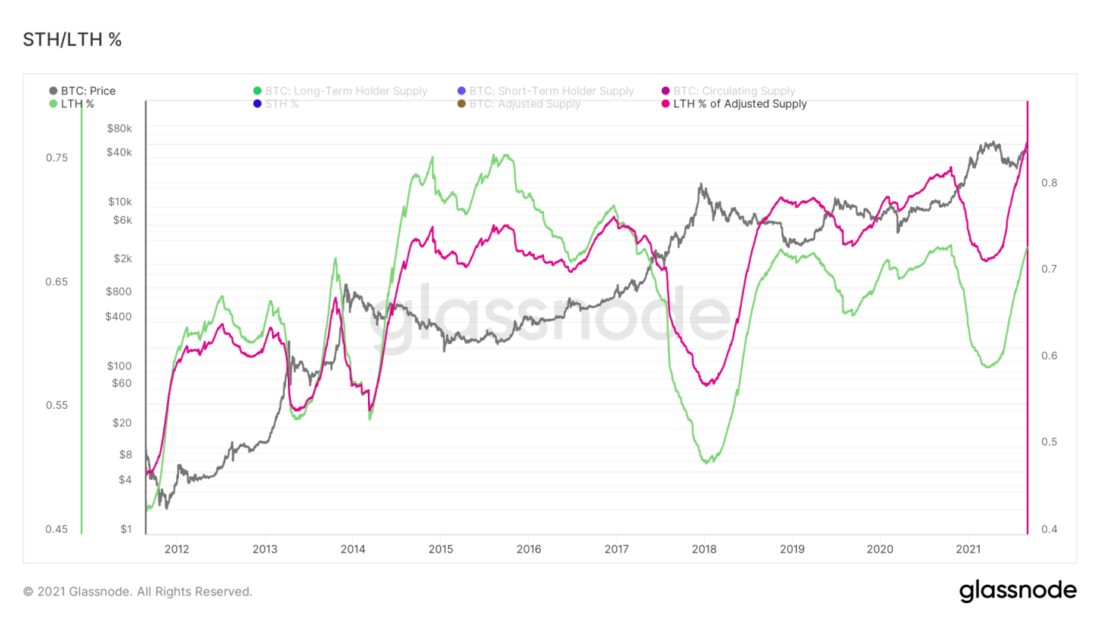
Supply held by long-term owners: green curve - percentage of total circulating supply, red - percentage of adjusted supply volume
By correlating the supply volume in the hands of long-term andshort-term owners, we get the Supply Shock ratio for the supply held by long-term owners. From a macro perspective, the value of this ratio is now approaching a zone that previously caused a serious supply shock in the market.
Notice how much faster the currentthe rate of recovery compared to 2017, as well as to a higher base, in which there was a reversal and return to growth. Long-term investors are holding on with confidence.
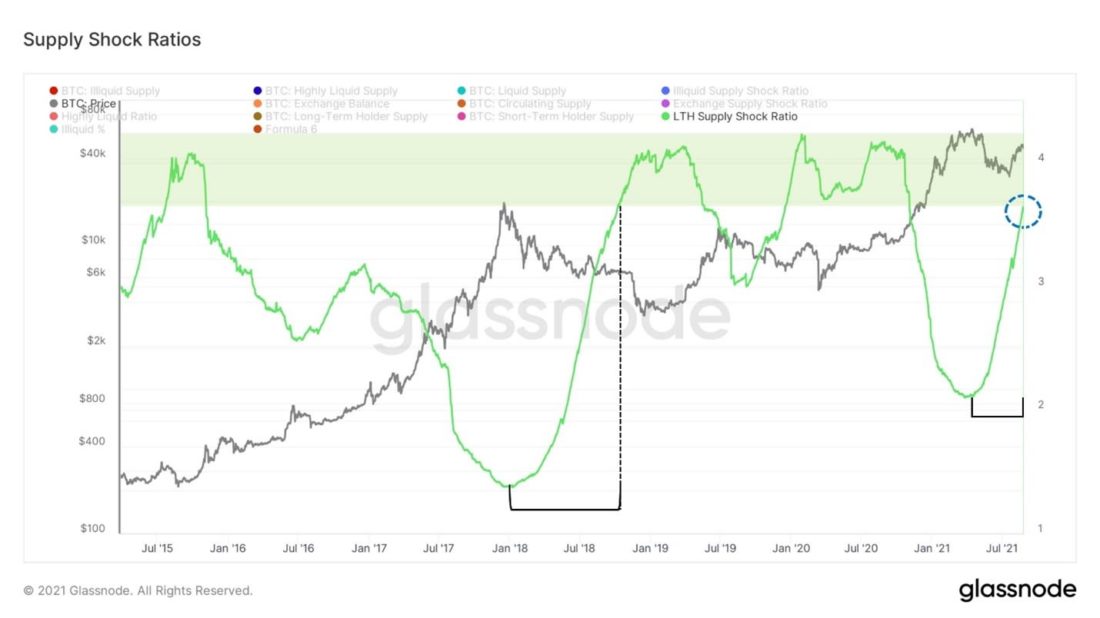
Supply Shock Ratio for Supply in the Hands of Long-Term Owners
Developing this topic, one of the factors that II always try to pay attention to whether these long-term holders are starting to use liquidity to exit the market. And for today the answer to this question is no.
Apart from a one-time spike a couple of weeks ago,long-term BTC holders are in no hurry to part with their coins, which does not even remotely resemble their behavior during the "dead cat bounce" in 2017.
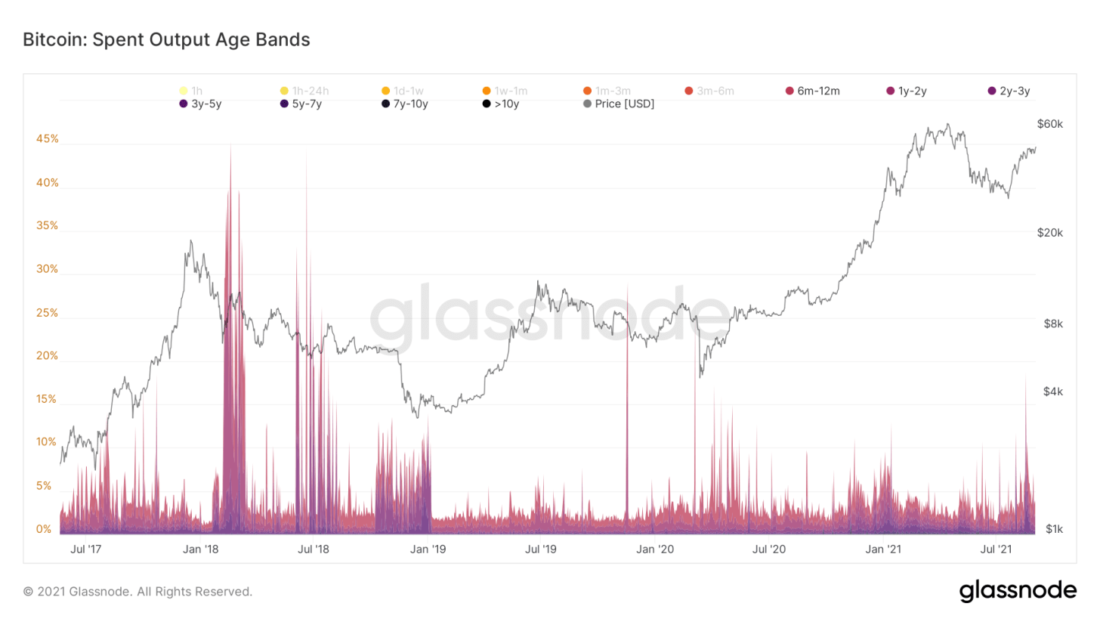
Outputs spent by age group
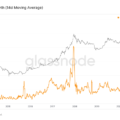
Hashpowers keep slowly returning tonetwork, but peak levels are still a long way off. At the same time, the profitability of mining in BTC for hash naturally decreases. This decrease in profitability, coupled with the rise in price, could explain the 1658 BTC reduction in miners' balances.
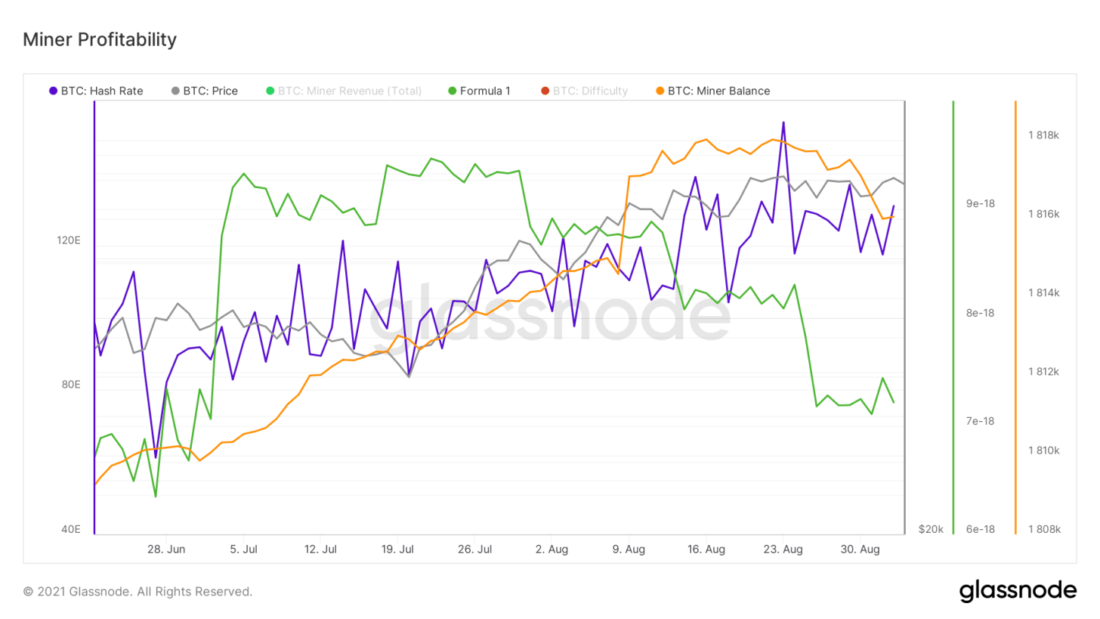
Profitability of miners
Such a volume of sales, frankly, may not have any significant impact on the price, but, nevertheless, the movements of the miners may be of some interest.
That's all for today. Have a great weekend everyone and see you next week.
BitNews disclaim responsibility forany investment advice that this article may contain. All the opinions expressed express exclusively the personal opinions of the author and respondents. Any actions related to investments and trading on crypto markets involve the risk of losing the invested funds. Based on the data provided, you make investment decisions in a balanced, responsible manner and at your own risk.
</p>
Read this:
 Strong Savings and a Buy Signal in the Hash Ribbon - On-Chain Pulse from Aug 14, 2021
 Onchain Pulse: Fast Update 25 Aug 2021
 Supply liquidity is drying up, the main parameters of the market are normal - Onchain Pulse from August 21, 2021
 Could this be a repeat of October 2020 before the bull rally? - Onchain Pulse from August 7, 2021
 Onchain Pulse | 04 May 2021
 Light Surge from New Whales - Onchain Pulse from July 10, 2021