I recently published a forecast price reversal/correction level based on the External Attraction Model. Thisone of the models that will be used in the future PRISM technical analysis service.
Now that the actual price movement relative to this level is known, I propose to understand how the published model and its level actually worked.
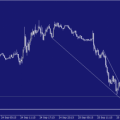
Before placing detention orderstrades, I needed to determine where I planned to take profits if the correction/reversal forecast turned out to be successful. Looking ahead, I note that in my trading system there are usually 2 such levels and I close the position in parts. But in this example, we will consider the decline only at the nearest take profit level. The blue segment in the graph below is the minimum range for working out the model. If the upper (in this case) limit of this range is reached by the price, then the model has worked, and if it is not reached, then the model has not worked.
In addition, we need to decide at what point wemust open a position. Initially, our reference point is level t.6 and according to the simplest logic, we should open against the trend when the price reaches this level.

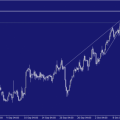
However, practice and logic suggest thatthe calculated level t.6 works (gives a reversal or correction) with an error. One of the advantages when working with a future service will be the ability to find out where the boundaries of a given error are. Moreover, this error can be both in the positive zone (i.e., not reaching level t.6) and in the minus zone (i.e., beyond level t.6). The set of these zones (plus and minus errors) will be denoted by yellow shading. The following events are noted in the screenshot below: the price reached the t.6 level, and thennotHaving reached the level of the 1st target, it leaves the yellow range towards the breakdown of level t.6. Thus, the model did not work.

However, was it possible to predict suchscenario before reaching level 6? Of course yes, that's why I canceled the orders before opening the trade. The thing is that after the price reached the yellow zone, it reached the level of the 1st target. That is, as soon as the price reached the error zone, I immediately began to track the first target. That's why I call the yellow zone the 1st target tracking zone.
As soon as the first goal was achieved, I immediately realized that, in fact, level t.6 had already been worked out, and from that moment on, level t.6 had already, by and large, worked out with precision.
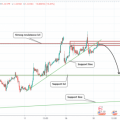
Now a few more words about the potential deal,which I had planned. In order for the transaction to comply with the MM rules, I would in any case not open simply because the price entered the tracking zone t.6. But it is not always advisable to wait to achieve level t.6, because it very often is not achieved until the first goal. Therefore, we calculate a certain amount of error, which is statistically quite often achieved by the price, and at the same time allows us to obtain a good ratio of potential profit and potential loss on the transaction. In the graph below, this error is indicated by a green segment. Its upper border would be the entry point, and the lower border would be the stop loss level.

That's all for today, we will continue to publish potential deals soon;)
P.S.
We slightly (almost imperceptibly) edited the cartoon about Vic, so the old link no longer works, but here is the new one:
youtu.be/agu9JOiqFtU
Read this:
 Startup PRISM. Example No. 1
 Startup PRISM service tech. analysis for traders
 Startup PRISM, what is the basis? Let's look at examples.
 We are waiting for the decline in USDCAD and the growth of XRPUSD
 Cryptocurrency mining on ASIC: relevance, profitability, models
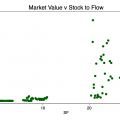 Falsifying Stock-to-Flow Ratio as a Bitcoin Cost Model