…and the bottom has probably already been reached. Assessment of the situation on the BTC and ETH markets and forecast for them from Willy Woo.
BriefSummary as of Dec 13, 2021:
- Macrostructure:purchases by hodlers in the last monthhave slowed down somewhat amid a decline, but are still in the area of peak accumulation. Structurally, we are still in a bullish macro area. Despite the decline, fundamentally the market structure does not show signs of a bearish trend.
- Short term:hodlers buy the decline.Coins are withdrawn from exchanges. The number of coins held by hodlers is growing, recovering from recent weakness. Our on-chain supply pricing model (via Supply Shock Ratio) suggests that BTC is currently trading at a discount of over $6K.
- Derivatives data suggests that demand is increasing, while hidden bullish divergence signals that the bottom is likely to have been hit.
- Price Expectations:recovery from lows with further consolidation in December.
- Confidence in price movement:average.
Be careful!
Please do not make trading decisions based on these forecasts and assume they are perfectly accurate. Allforecasts are probabilistic. Short-term market movements are subject to unpredictable events and market randomness.Manage risks accordingly.Longer-term forecasts are generally more reliable because it takes time for the fundamental effect to develop fully.
Macro structure: no signs of a bear market
Although the price has corrected quite significantlyfrom the peak values for the last month, the net inflow of coins to the wallets of hodlers remains in the “bullish” area. The heatmap below shows that this flow has slowed somewhat in the past month, but there has not yet been enough sell-off to signal a deeper bearish phase. I am following this closely.

The chart tracks the net inflow / outflow of coins forhodlers' wallets over a 50-day period. Hodlers are defined here as investors who have a historical savings-to-use ratio of at least 3: 1.
Meanwhile, in the diagram below, we see thatlong-term holders have been distributing their coins and taking profits in the last month, but as a cohort they are still in the area of peak accumulation. Until now, bear markets have been accompanied by getting rid of hodlers from their coins amid the fear prevailing in the market. Structurally, the current setup does not correspond to the bear market.

Long Term Holder Supply Shock (SupplyShock for long-term holders) is the ratio of coins held for 5 months (155 days) or more to the number of coins held for less than this period. Coins that are more than 5 months old are generally statistically less likely to be spent (strong hands).
Short term: investors buy back the fall
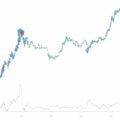
The net inflow of coins into exchange wallets has returned to negative territory, meaning coins are being withdrawn from exchanges, signaling significant spot demand.

Weekly inflow / outflow of coins at exchange addresses. Negative values here are a bullish factor, since they indicate the withdrawal of coins to "cold" (and, presumably, longer-term) storage.
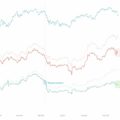
Looking at demand through the prism of the Supply Shock ratio, the structure is recovering from the weakness of the last month.

Supply Shock Ratio determines the levelon-chain investor demand by tracking the ratio of coins that are less likely to be sold to the number of coins that are more likely to be sold. We also split investors into two cohorts, determining the Supply Shock value for each of them.
Below, the same data is presented in the form of thermalcards. It can be seen that the hodlers are redeeming this fall. This is a moderate buying level, and while not necessarily a bullish signal in the short term, it adds strength to the market to reverse this downturn.

Heatmap of net buy / sell BTC by hodlers
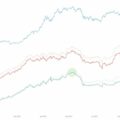
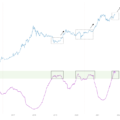
Our Supply Shock Ratio Valuation Model,which measures how the market has valued BTC in previous periods when on-chain demand levels were roughly similar, gives a “fair” valuation of just under $60K. Today, Bitcoin is trading at a discount to this value.

Bitcoin Pricing Model Based on Supply Shock Ratio
Shortest-term outlook: bottom may already be hit
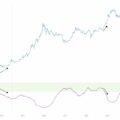
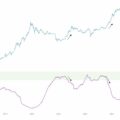
My PDL oscillator tracking dynamicsspeculative demand on derivatives exchanges has bottomed out and is now showing signs of strength, simultaneously forming a hidden bullish divergence. This signals that the bottom has been reached.

PDL Oscillator
All charts are made at charts.woobull.com
BitNews disclaim responsibility for anyinvestment recommendations that may be contained in this article. All the opinions expressed express exclusively the personal opinions of the author and the respondents. Any actions related to investments and trading on crypto markets involve the risk of losing the invested funds. Based on the data provided, you make investment decisions in a balanced, responsible manner and at your own risk.