Willy Wu, alchemist and legend of on-chain analysis, presents his point of view on the current market situationbitcoin.
I usually try to write about the fundamentalindicators that affect long-term exchange rate changes. But given the decline in the market over the past few days, this time I decided to publish my vision for a much shorter term.
Brief summary as of January 24, 2022 (current price ~$35.6 thousand):
- Conditions for price movements:the market is in a prolonged phasere-accumulation similar to the period from mid-2019 to the end of 2020. In such situations, it is typical for BTC to trade in strong correlation with stocks and in isolation from on-chain performance. Stock markets have seen a significant decline and this has been the main reason for the weakness in the Bitcoin market. Traders today determine the market situation to a greater extent than spot investors tracked by on-chain data.
- Early signs of a return can be seendemand in the futures markets and "technical" indicators indicate that the market is in a zone of high probability of a reversal. If this level is held, a strong rebound can be expected.
- The sell-off was not accompanied by a proportional change in investor behavior.
- Whales (network entities with a balance of ≥₿1000),those who sold in November and December returned to accumulation. This may be an early sign of an expected reallocation of institutional capital in the new calendar year.
- In relation to on-chain demand, the market is approachingpeak “oversold” levels. Each time Bitcoin reached this zone, it showed strong and prolonged rebounds. The last time it was a bounce was from the ~$29k low in July 2021. The rally from $10 thousand to $60 thousand in October 2020 also began from a similar structure.
Be careful!
Please do not make trading decisions based on these forecasts and assume they are perfectly accurate. Allforecasts are probabilistic. Short-term market movements are subject to unpredictable events and market randomness.Manage risks accordingly.Longer-term forecasts are generally more reliable because it takes time for the fundamental effect to develop fully.
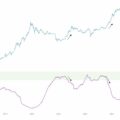
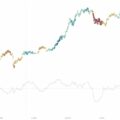
Trader influence outweighs spot investors
Experienced swing traders, as far as can be judged bystock data, sold on this bearish move. This contrasts with the accumulation between May and July 2021, which eventually led to a price rally.

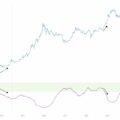
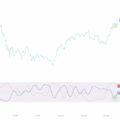
PDL Oscillator
The main source of selling pressure on BTC(since November) there were futures markets. On-chain data actually only reacted to price movements with some lag. We found ourselves in a situation where speculators were pushing the holders of the spot asset to sell, and not vice versa.
In a situation of dominance of traders, let's take a look at the "technical" indicators
This brings me to the point that the marketis in the re-accumulation zone. The last time it was in this phase (from mid-2019 to late 2020), BTC traded in the strongest correlation with the stock market. On-chain analysis was almost useless in predicting short-term price movements, although it did show an impending supply shock that eventually broke the correlation.
Today the market is not in the modedominance of spot investors, and this is an unfavorable situation for on-chain analysis. When I talk about on-chain analysis, I am primarily referring to the behavior of long-term investors moving their coins in and out of cold storage.
Today, short-term weekly price movements are best predicted by data from the derivatives market and technical analysis of the price chart.
On lower timeframes in the last 48 hours you canobserve the first signs of returning demand to the market. In addition, Monday completes the formation of the 9th bearish candle in the TD Sequential indicator on the 1- and 3-day time frames, so the likelihood of a reversal from this zone appears high. If confirmed, this will form a hidden bullish divergence, indicating that the market is “oversold” compared to normal values, which means there is reason to expect a rebound.
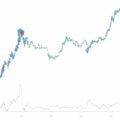
Whales begin to accumulate
Looking at net inflow/outflow of coins on walletswhales over the 30-day rolling period, we see that the net selling on their part that started in November has finally subsided and we are now in the early stages of net accumulation. This looks like the first signs of the return of institutional capital, which left at the close of the calendar year.

Net inflow / outflow of coins on the wallets of "whales"
Bearish price movement is not supported by fundamentals
The current values of this net flow schedulecoins between hodlers and speculators I find quite interesting. I noted on it how strong the sell-off we saw in May-June 2021. We are now seeing a correction of a similar magnitude, but actual selling by hodlers is small compared to that period.

Heat map of net buying/selling by hodlers (macro). 50-day net coin flow between hodlers and speculators.
Our Supply Shock indicator (below) confirmsthis picture. The scale of sales by hodlers is very small and it is completely unlike what happened in the summer of 2021. The reason is probably the weak liquidity of December-January.

Adjusted Supply Shock
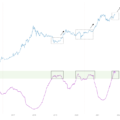
We enter the area of the "launching pad"
I've been waiting a long time to post this chart.The oscillator on the chart below tracks the price-to-fundamental behavior of BTC hodlers. The price has been trading at a premium since October 2020. Now we are approaching the zone of complete reset and zeroing of this bonus.

Bitcoin Liquid Supply Shock Oscillator is a Supply Shock oscillator for BTC liquid supply. The indicator tracks the divergence between price and fundamental on-chain demand.
Such periods are rare. The previous examples are:
- October 2021, before rally from $10k to $60k;
- March 2020, at the lows after the "covid" collapse;
- December 2019 when BTC surged 50% in 60 days;
- September 2016, setup before the 2017 bull market;
- January 2015, 2014 bear market lows.
BitNews disclaim responsibility for anyinvestment recommendations that may be contained in this article. All the opinions expressed express exclusively the personal opinions of the author and the respondents. Any actions related to investments and trading on crypto markets involve the risk of losing the invested funds. Based on the data provided, you make investment decisions in a balanced, responsible manner and at your own risk.