
While many may feel that Bitcoin's current price action is bearish, leading digitalthe asset has several bullish indicators that hint at an imminent recovery, writes Cointelegraph analyst Keith Waring.
What will be the last month of 2019 for bitcoin - bullish or will the price show the next minimum?
Since the beginning of November, the daily chart has been bearish. Many unsuccessful attempts were made to break through $ 9,500, and as a result, Bitcoin survived three and a half weeks of the bear market, dropping to $ 6,500 on November 25. The good news is that Bitcoin quickly rebounded from its new level, earning $ 1300 and changed the trend on the daily chart from bearish to bullish.
Using the Bollinger Bands Indicator (BB), we can assume that the moving average, which is currently at $ 8000, will be the next level for a break.
</p>Are there any other indicators that indicate the BTC is moving up?
The MACD indicator shows a bullish intersection and a transition to the green zone. Although it is difficult to say how long this period will last, it is definitely a buy signal for traders.
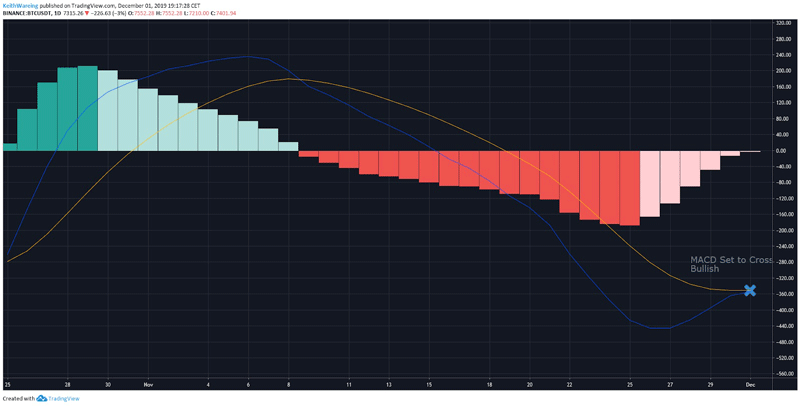
Also November 29, the market for bitcoin futures market onCME closed at $ 7,800, and at the time of this writing, Bitcoin is trading at around $ 7,300. This means that if the gap (or gap) closes on the CME, Bitcoin should show an increase of 7%.
Although a gap on CME futures alone does not guarantee anything, recently it has become a very reliable indicator, and the bulls would welcome such growth in addition to other indicators.
The last bullish indicator on the daily chart, onwhich I want to pay attention to is the relative strength index (RSI). During the last week of November, RSI revealed that BTC / USD was heavily resold. November 25 was the lowest point - 17.65, and although the RSI is currently down, it shows a value above 30. When the RSI approaches 30, it sends a signal to traders to buy.
Cryptocurrency traders are faced with a lot of bullish signals and it begins to seem that all this is “too good to be true”? Maybe we missed something?
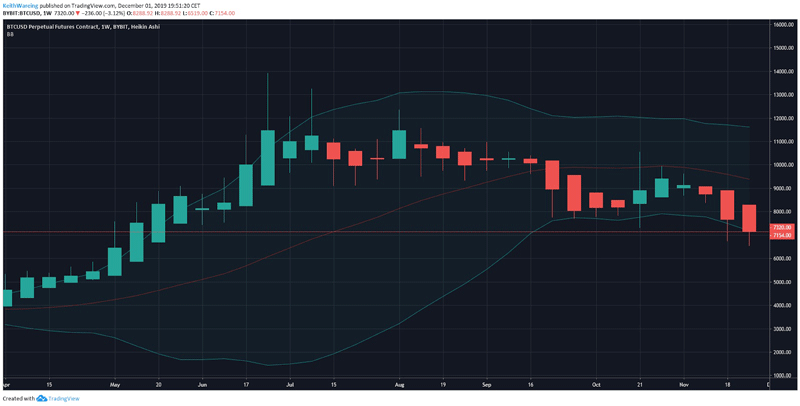
Bitcoin weekly chart shows thatBollinger line indicator support has been broken twice. Bears may take this as a sign that the price is about to fall, and bulls may interpret it as an asset that holds its price before a reversal.
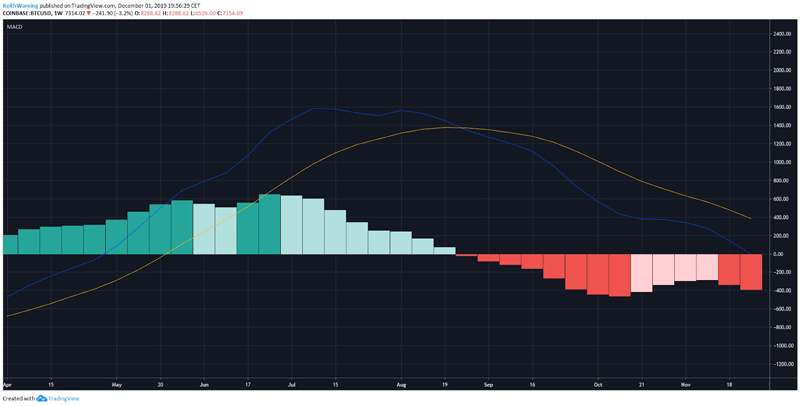
MACD also looks bearish on the weeklyschedule. Signal and MACD line down. As a rule, this indicates that for Bitcoin the situation does not look too rosy, however, traders should also consider that the MACD does not show any positives from last week, which is noticeable on smaller timeframes.
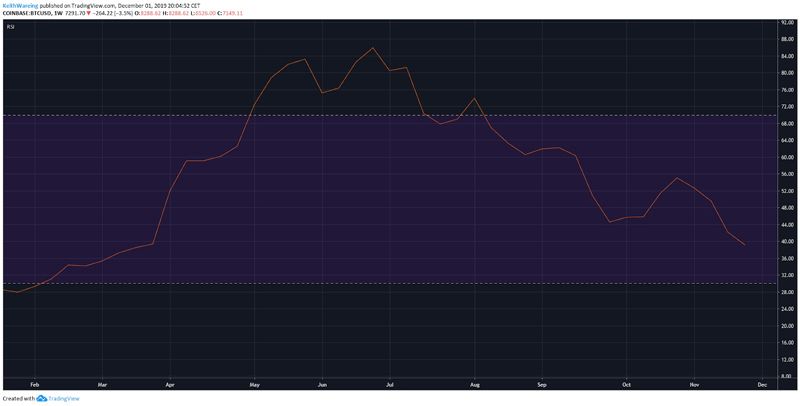
Finally, traders should also analyze RSIon the weekly timeframe. Currently, the RSI is heading down to oversold at 38. As a rule, about 30 readings are considered a buy signal for traders, and I see the weekly RSI as a positive indicator.
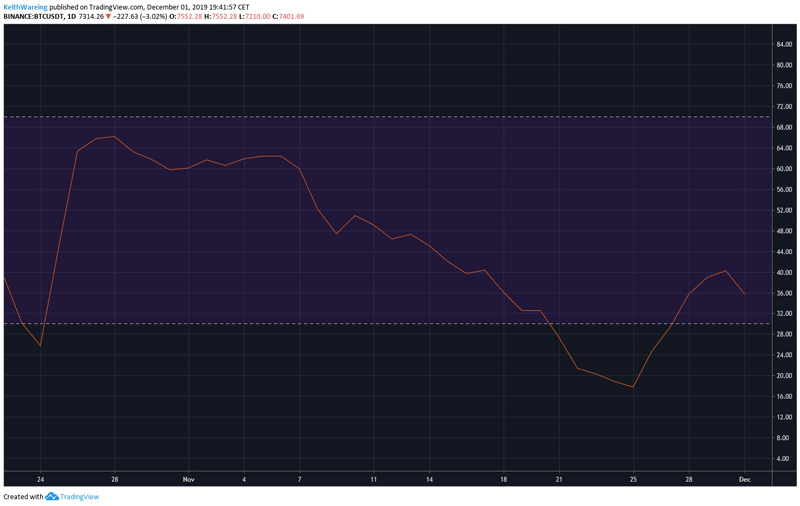
If the RSI was at 50-70, then traders,perhaps they would decide not to buy bitcoin this week. Nevertheless, all the indicators analyzed suggest that the bears temporarily left the market and we are not waiting for such a cold week.
Given bullish MACD and possible gap fillingon CMEs up to $ 7,800 this week, traders can expect Bitcoin to hold $ 7,800 as a new level of support. This could open up growth to $ 9050 as the next key resistance level.
</p> 5
/
5
(
1
vote
)


