This post focuses on the latest status statistics and rising value of the Bitcoin network. While the price of BTCis undergoing another cyclical correction from a record high, strengthening fundamentals continue to form large lows in the probable valuation.
One of these key indicators is growthnumber of active network subjects. Network entities are clusters of addresses determined by blockchain analysis methods, managed by one individual, organization or other market participant. An "active" entity is defined as someone who sent or received bitcoins on a given day. This metric is based on data analytics techniques and heuristics applied by the data provider (in this case Glassnode) and is not perfect, but works well for tracking demand changes over time. You can read more about the Glassnode methodology here: original / translation.
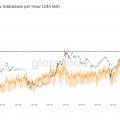
The graph below shows thatThe number of active entities on the network has more than doubled since 2016, from 126,904 to 255,333. The two most recent price peaks were preceded by episodes of sharp increases in the number of active entities, reaching 376,549 and 432,636 in 2016 and 2021. respectively. Each market cycle has resulted in new highs in the number of active entities on the Bitcoin network, and subsequent lows also tend to form higher than previous ones—technically, these are the main signs of an uptrend. This paints a clear picture of the growing number of new “users” using Bitcoin on-chain transactions over time.

Number of Active Bitcoin Network Entities (7-day MA)
Another way to look at this long-term network growth trend is to use a 90-day moving average instead of a 7-day one.

Number of Active Bitcoin Network Entities (90-day MA)
There are many attempts to determine the changingmarket valuation of Bitcoin. One such useful attempt is the NVT (Network Value to Transactions) coefficient, which is the ratio of the value of the network (capitalization in $) to the volume of on-chain transactions (in $), adjusted for users (network subjects). This is the cryptocurrency equivalent of a P/E ratio, tracking the market valuation of the Bitcoin network relative to each dollar moved on-chain.
Despite the high volatility, in many respectsdue to the amplitude of price movements, the NVT ratio shows a clear trend: the value of the Bitcoin network increases over time. Readings above the trend line indicate that the market appears to be "overvalued", below the trend line it is "undervalued". Since February, under the pressure of macroeconomic factors, bitcoin has been “undervalued” in terms of fundamental analysis, given the volume of on-chain transactions.
However, one should not forget about the growing volumeBTC supply that can change hands off-chain (primarily on exchanges), as well as the growth of the Lightning Network - these factors are not accurately reflected in the NVT ratio in the chart below.

Bitcoin NVT Ratio (30-day MA)
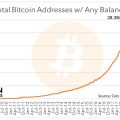
Next we have an idea of the quantityBitcoin addresses with non-zero balance since 2012. Determining the number of actual “users” of Bitcoin has always been a challenge, which is why the concept of “network entities” described above was introduced. While simply counting addresses has its own nuances (a user can have many addresses, and one exchange wallet address can represent thousands of users), it is still a simple and fairly powerful way to gauge the growth of Bitcoin adoption and adoption. The number of addresses with non-zero balances continues to grow by double digits annually, with year-on-year growth in 2022 currently standing at 18.2%.

Average annual number of bitcoin addresses with non-zero balance
According to a simple and conservative predictivemodel, at this rate, the number of addresses with a non-zero balance will almost double by 2026. And this is based on growth of only 10-13% per year, well below the current trend. In essence, this high-level view corresponds to Bitcoin's S-curve adoption over time.

Number of Bitcoin Addresses with Non-Zero Balance - 5-Year Forecast
Finally, it is important to note that the base layerBitcoin no longer provides a complete picture of the overall level of adoption and adoption of the network, as more users use services and applications that do not involve direct interaction with the blockchain for each transaction. Examples of such services include custodial exchanges (accepting user funds) such as Coinbase, where users buying or selling BTC does not necessarily involve on-chain movement of “coins” unless it is a withdrawal.
Another example is the growing useLightning Network by Bitcoin companies - such as Strike, Cash App or River Financial - allowing users to store their Bitcoins using a layer 2 protocol. We emphasize this point because it is very important to understand that Bitcoin is essentially a base layer settlement protocol.
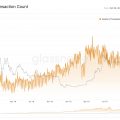
The speed / frequency of transactions that they love so muchreferred to by both skeptics and experts, is not an important statistic for such a protocol, which is worth focusing on. As shown below, the throughput of the base layer is limited in the number of transactions per second.

Bitcoin: number of on-chain transactions per second
In what it is not limited in any way, it is inthe amount of value that can be transferred over the protocol with unprecedented efficiency and final settlement guarantee. We've covered this concept in detail here, but it's worth pointing out again given how misunderstood it is often.

Bitcoin: total amount of on-chain transfer ($)
The important thing is that Bitcoin operates 24/7/365 as the world's most efficient and secure network of value and settlement, available to any user who wants to use it.
The true signal is that for the lastmonth, the Bitcoin network processed ~$50 billion in transactions daily with an average fee of 0.001012% - in a completely decentralized and trustless manner. That is, over the past 30 days, every $98,769 of value was transferred over the Bitcoin network with a commission of only $1, and there is not a person on planet Earth who can stop this.
These are network averages, but we cantake a look at the medians to level out the bias towards large transactions. In this case, over the same time period, we receive $1 network fees paid for every $450 transactions, which equates to a fee of 0.222%.

Bitcoin Value Calculation Efficiency: On-chain Transfer Volume Adjusted for Change / Total Fees (in BTC) (30-day MA)
The elegance of the Bitcoin network and its apparentboring, but at the same time remarkable efficiency and sustainability, is a real technological marvel. And no matter what bitcoin naysayers think or do, blocks will continue to be mined and bitcoin will continue to do what it does as the world's only truly decentralized, open and secure money settlement network.
BitNews disclaim responsibility for anyinvestment recommendations that may be contained in this article. All the opinions expressed express exclusively the personal opinions of the author and the respondents. Any actions related to investments and trading on crypto markets involve the risk of losing the invested funds. Based on the data provided, you make investment decisions in a balanced, responsible manner and at your own risk.
Read this:
 Study: the number of transactions in the Bitcoin network has been decreasing since June of this year
 Activity on the Polygon network bypasses Ethereum
 Almost 25,000 new addresses registered in the bitcoin network in one hour
 The number of active addresses in the Bitcoin network has reached a new record
 Bitcoin fees plummet 58% in four days
 Halfway to the next halving: Bitcoin status in 8 charts