Despite this, for most people, mining is still an activity that is obscure andperceived rather through a set of truisms,rather than through the prism of real data. The prejudice prevails in the community that miners have a great influence on the price of bitcoin and are literally its last bastion. Is there any truth to this?
The main economic activity of Bitcoin is extremely simple: people allocate their hashing power to the network in exchange for the opportunity to get coins issued by the network.
If Bitcoin had no one butminers, he would still be workable. The combination of miners and coin buyers is already creating a market, which means value. From the point of view of the fundamentals of economic theory, everything else only complements this basic system.
Despite this, for most people, mining is still an obscure activity and is perceived more through a set of truisms than through the prism of real data:
- «Hashing power follows price» (or «price follows hashing power»);
- «The cost of mining is a natural bottom for the price of Bitcoin»;
- «Capitulation of miners is a prerequisite for the start of a bullish rally»; and so on.
The prejudice prevails in the community that miners have a great influence on the price of bitcoin and are literally its last bastion.
Is there any truth to this?
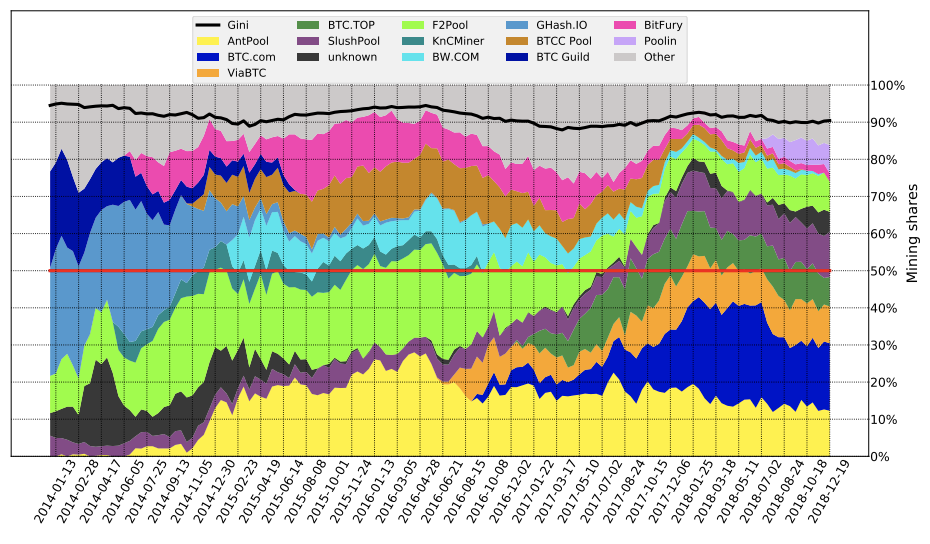
The red line indicates the (virtual) 50% security threshold, the black line indicates the Gini coefficient as a measure of the distribution of market shares. ()
⏱️ 1. Why are miners important
In 1931, Harold Hotelling formalized the concept of scarcity rent (Hotelling rent), on which the economic theory of the supply of non-renewable resources is largely based:
If the growth rate of net prices is different from the growth rateinterest rate, and the equilibrium is broken, then the current value that can be obtained from the sale, in some periods will be higher than in other periods.
Besides the fact that bitcoin is growing much fasterof any interest rate, its offer is also influenced by the fact that miners actively manage the time of production and sale of resources - that is, we can make a general assumption that miners sell their stocks when they believe that the prices of these resources will decrease and keep them when they believe that prices will rise. This is a simplified, but fundamental dynamics: the speed of the release of new coins to the market is a function of the intertemporal arbitration practiced by the miners.
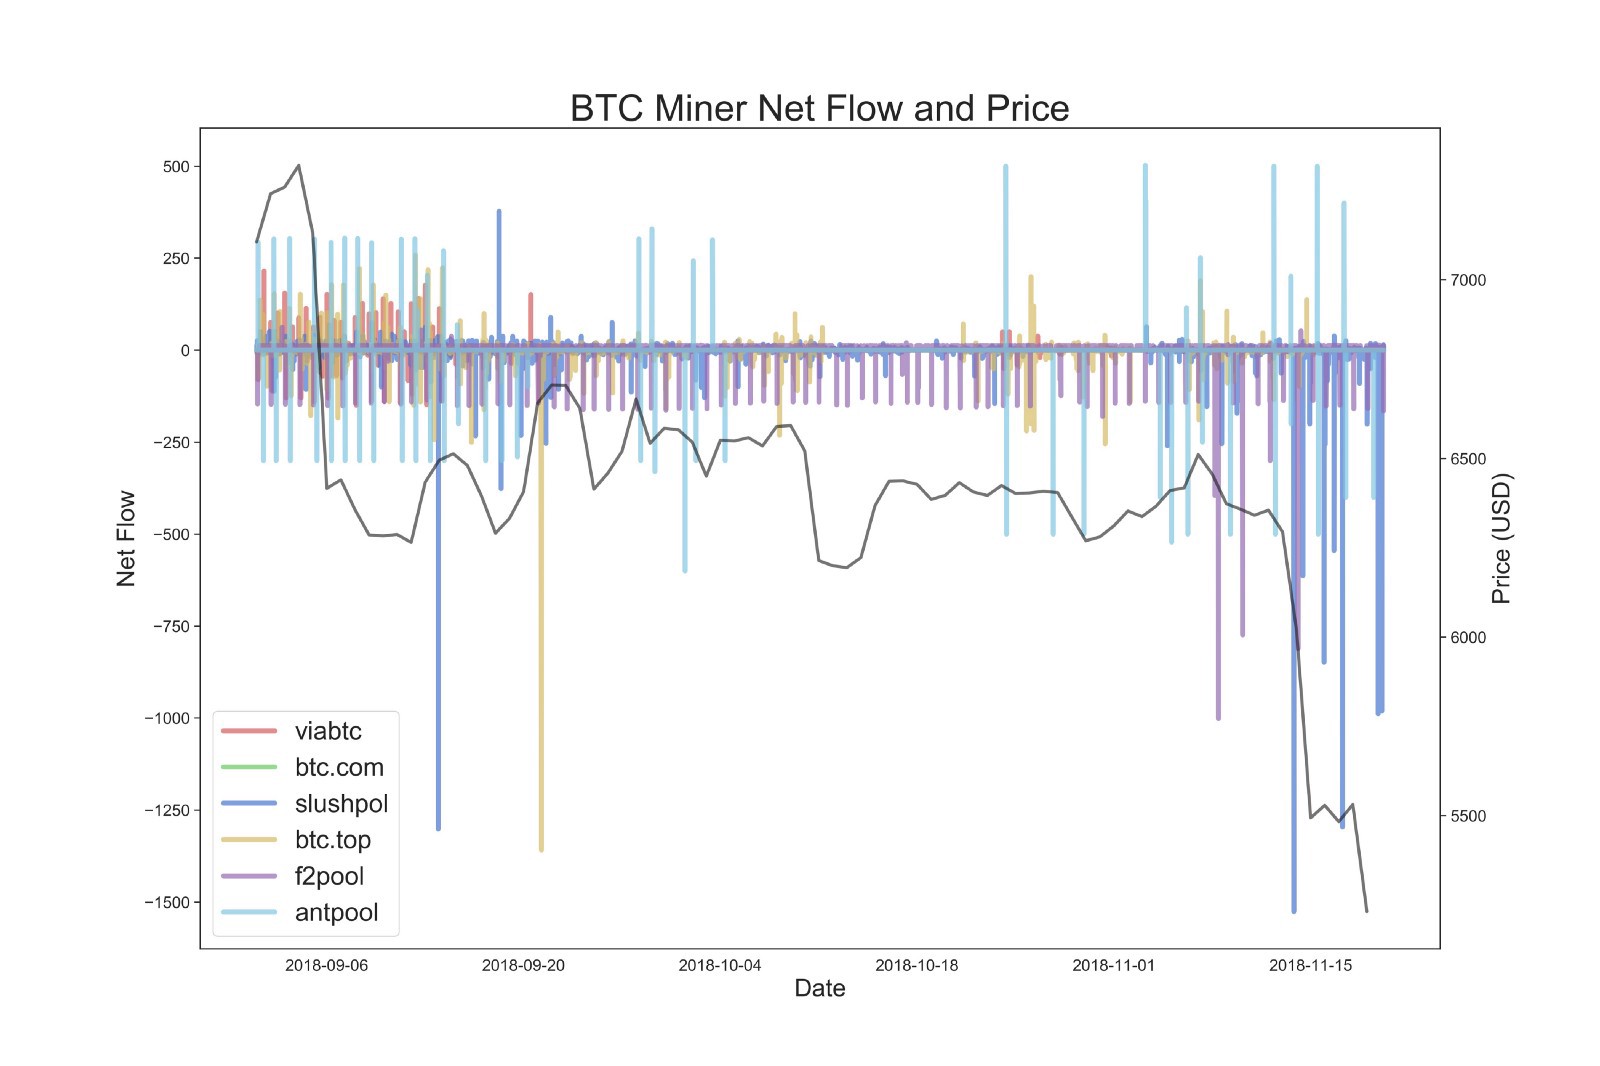
Boltzmann analysis of cleancapital inflows / outflows for large mining pools showed that F2Pool and SlushPool were selling their BTC stocks with 17.5 standard deviations below the average for the previous 3 months before last year’s BSV drama (source).
We should not forget about the inelasticity of the Bitcoin proposal. No matter how many miners are included in the competition for the right to write a block, this will not affect the number of BTC created with each block.
But this does not negate the fact that miners own the keys to a fresh offer of bitcoins - literally.
Every time spending new coinsbecomes available (100 blocks after they are added to the blockchain), the miner, consciously or not, decides whether to withdraw this reward or to save it for now.
In this way, the collective mind of miners operates a kind of metaphorical “faucet,” increasing or decreasing the available supply of new bitcoins in the market.
? 2. Crane… But what kind of pressure does it have?
Asymptotic Bitcoin block rewardimplies that economic «power» miners as a supply side factor decreases over time. The movement of bitcoins already in circulation will inevitably have a greater potential to influence the price than changes within the supply just being introduced into circulation.
At the beginning of 2009, 100% of the coins involved in on-chain transactions were newly mined BTC. By mid-2012, the share of new bitcoins in the total turnover decreased by 3 orders of magnitude.
The share of miners in the total volume of on-chain transactions(MSV, from Miner’s Share of (on-chain) Volume) is a simple metric for assessing the significance of a hypothetical implementation by miners of the entire volume of coins mined in relation to the total onchain volume.
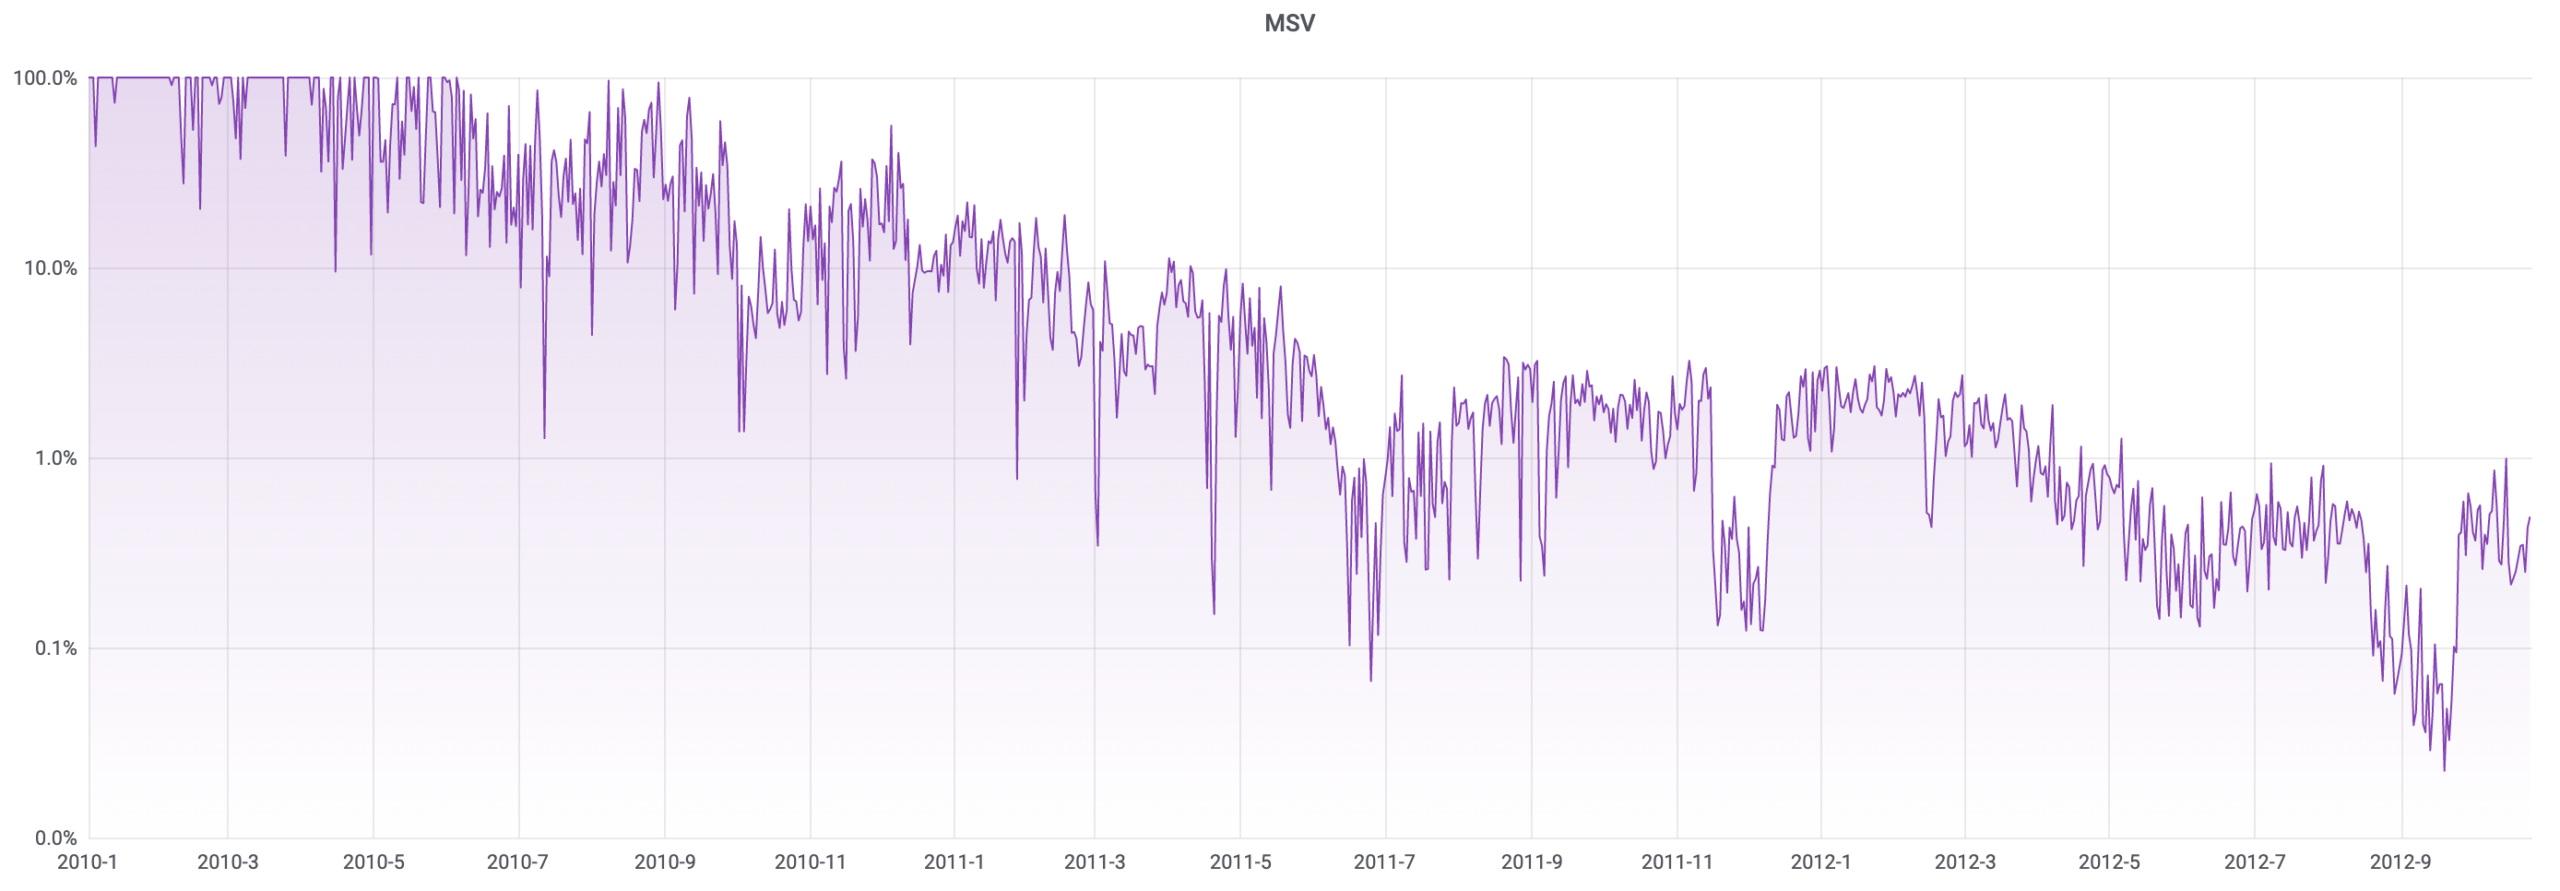
MSV = volume of onchain transactions (including inputs of coinbase transactions) / total onchain volume
Since today almost allthe volume of the reward for mining is spent on the day of receipt from the same address to which it was received, the MSV value in practice turns out to be inversely proportional to the onchain volume (gradually decreasing and sharply adjusted with each halving).
An MSV of 0.01% means that ifa monopolist miner simultaneously implements coinbase outputs obtained in three months on the market (without taking into account the rate of change in the rate), this volume will be 1/100 of the daily volume of on-chain transactions.
If the graph above is not convincing enoughshows the insignificance of the share of miners in the total volume of Bitcoin transactions, the link provides a visualization that also includes the volume of off-chain spending on the spot market and the derivatives market. In this visualization: on-chain volume = raw data multiplied by 4/9 to roughly minimize the impact of changing transaction outputs; spot volume = Bitcoinity data multiplied by 10% (again, approximation is made to be closer to «real volumes»).
? 3. Miners. Who you are?
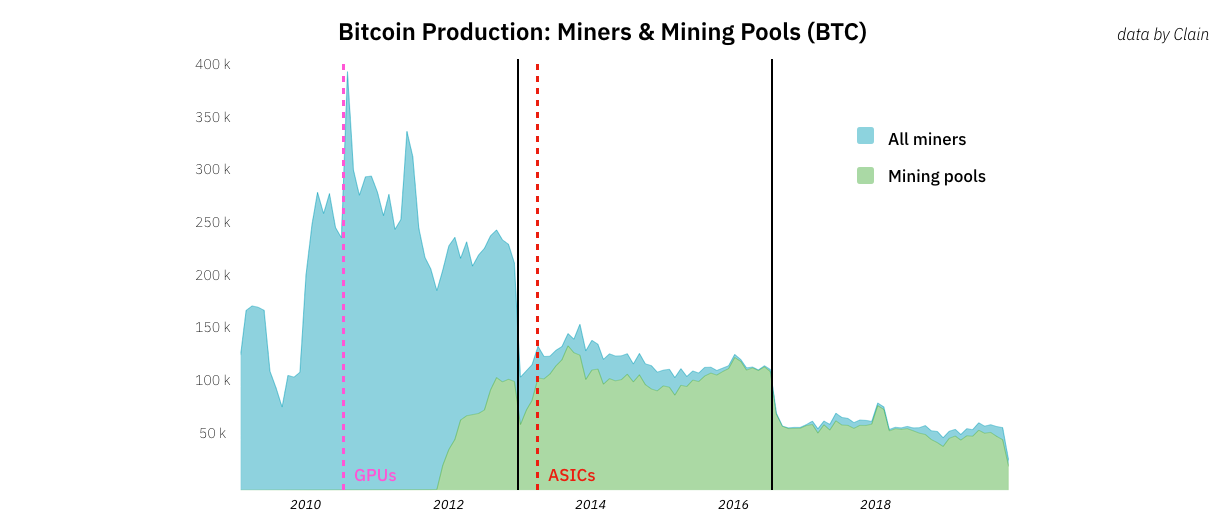
In just a couple of years, the enthusiasts who formedthe first hundred thousand blocks were almost completely replaced by mining pools. In 2011–2012 Identification has become the norm, but some pools may have existed before, unknown to us.
The well-documented transition from amateur to professional mining is clearly visible in this diagram:
()
Much of the economic mining analysisSo far, the activity has been aimed at solving two key questions: (1) how to model a game-theoretic competition, which is mining ?; and (2) how to map mining pools to track their power and / or behavior?
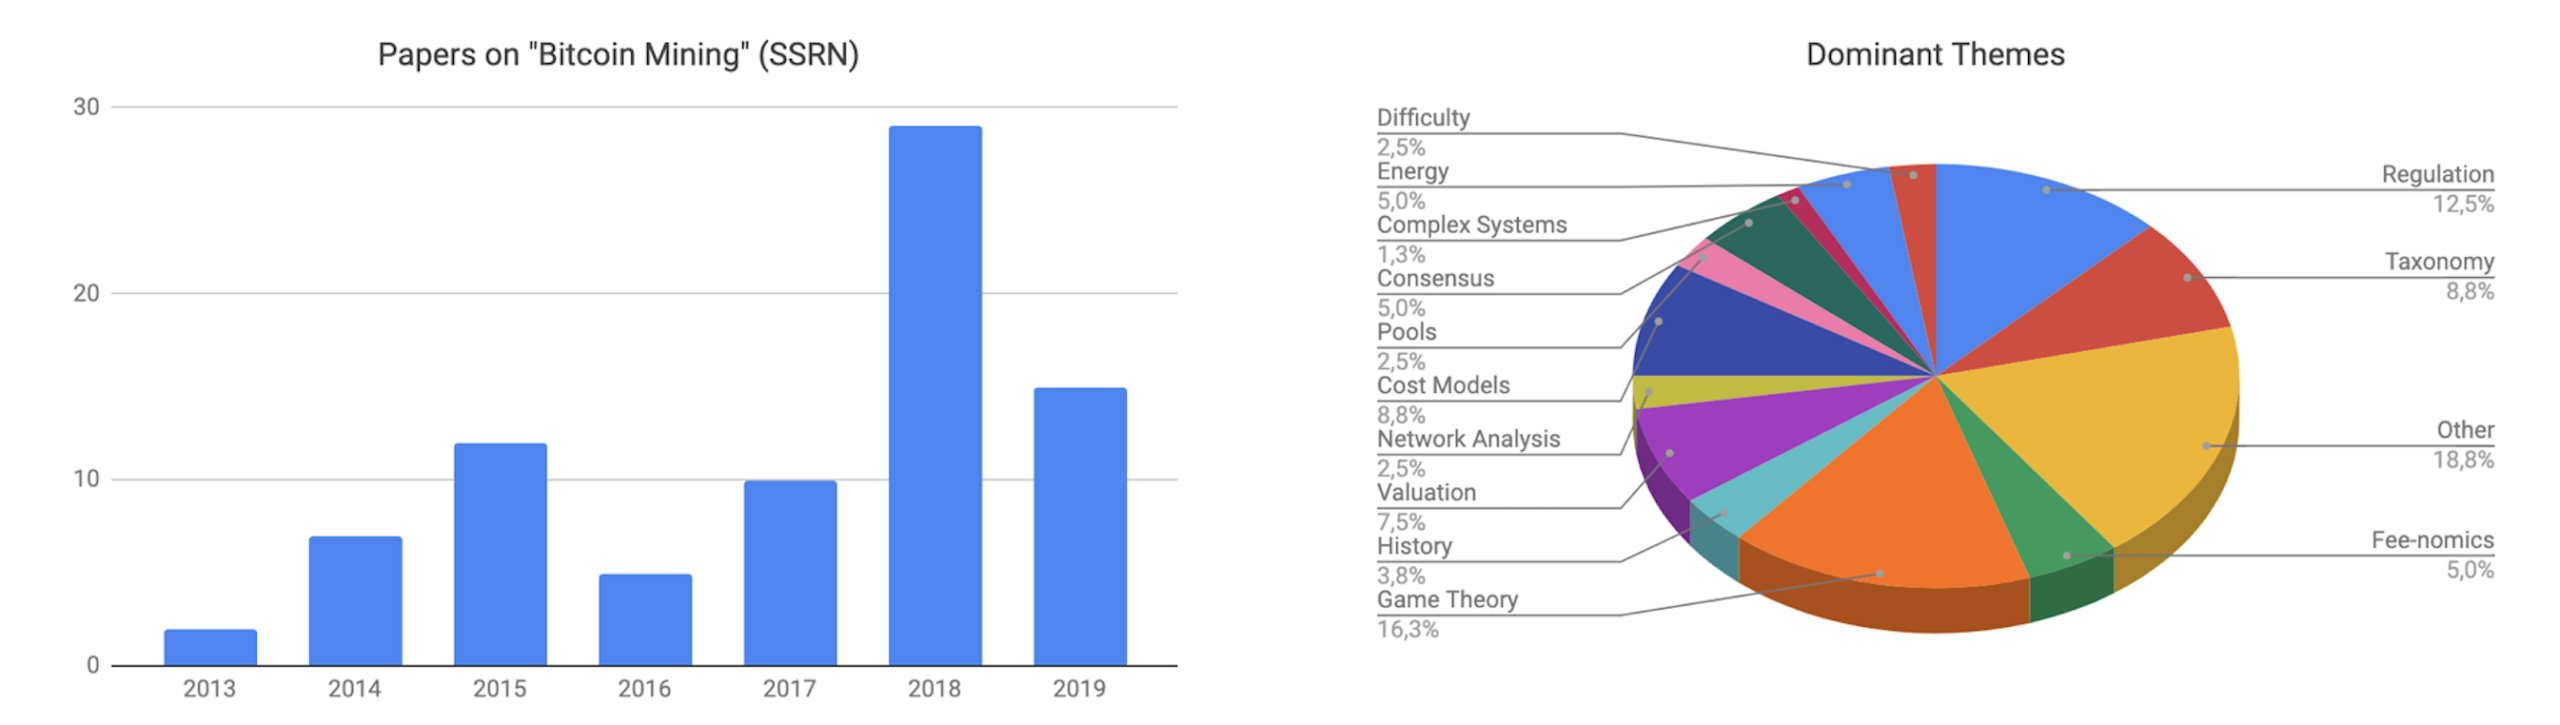
Statistics on 81 works on the topic «Bitcoin Mining» (out of 1032 for the keyword «Bitcoin») posted on SSRN for the period from January 2013 to July 2019.
Those that belong to the latter category rely on heuristic rules, which can be summarized as follows:
- clustering of addresses receiving coinbase transaction outputs;
- categorizing these clusters into pools, individuals, and «unknowns»;
- tracking the influx and outflow of bitcoins to and from these wallets (or, as an option, the movement between these wallets and other specific clusters, such as exchanges).
Boltzmann, BitMex Research, CoinMetrics, and TokenAnalyst examined these data from past variations of this method.
? 4. Outflow from (tagged) addresses of miners
There are two popular lists in the public domain.Bitcoin addresses with tags: Blockchain.info and WalletExplorer.com. Obviously, many custom tools have also been developed for cluster analysis of the Bitcoin network; some of them relied on these lists as a starting point.
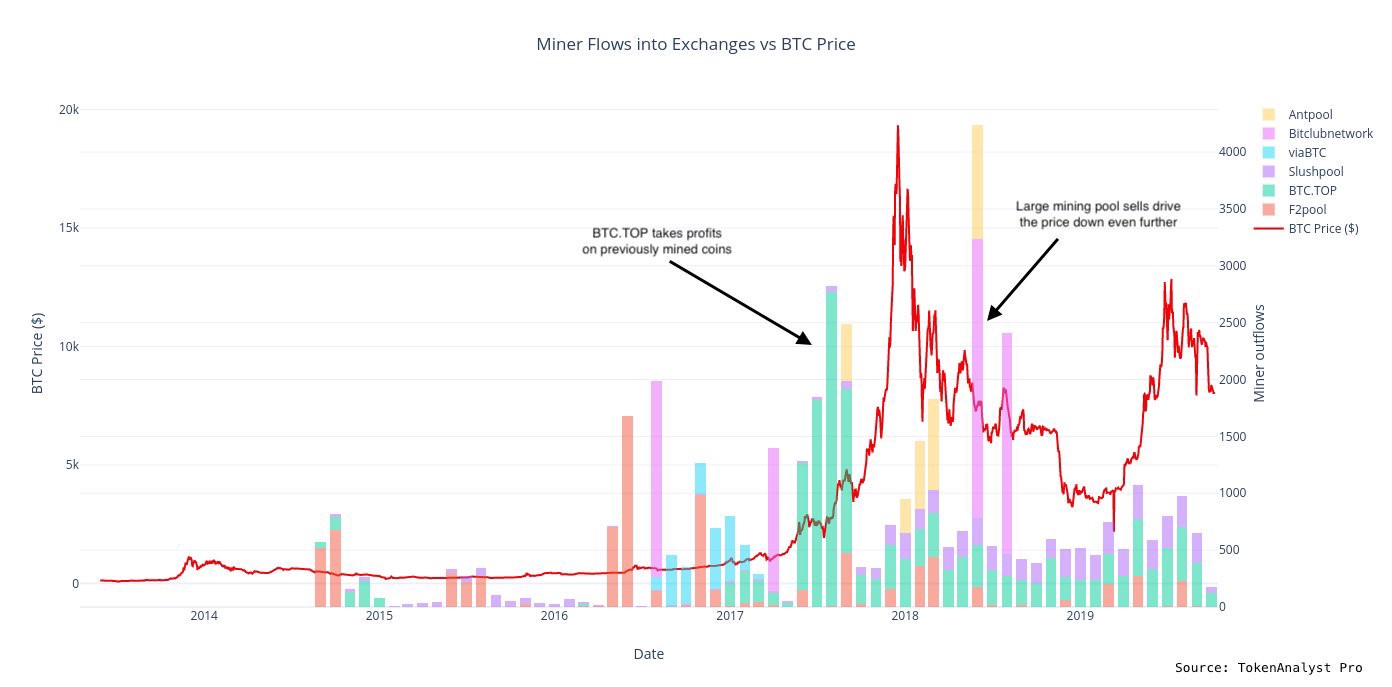
Below we look at the TokenAnalyst data, more precisely, an excerpt from the data set covering the period from October 2014 to October 2019.
Tagged streams include transactions from Antpool, BTCTOP, BitClubNetwork, F2Pool, Slush and ViaBTC to Bitstamp, Bittrex, Binance, Bitfinex, BitMex, Huobi, Kraken and Poloniex exchanges.
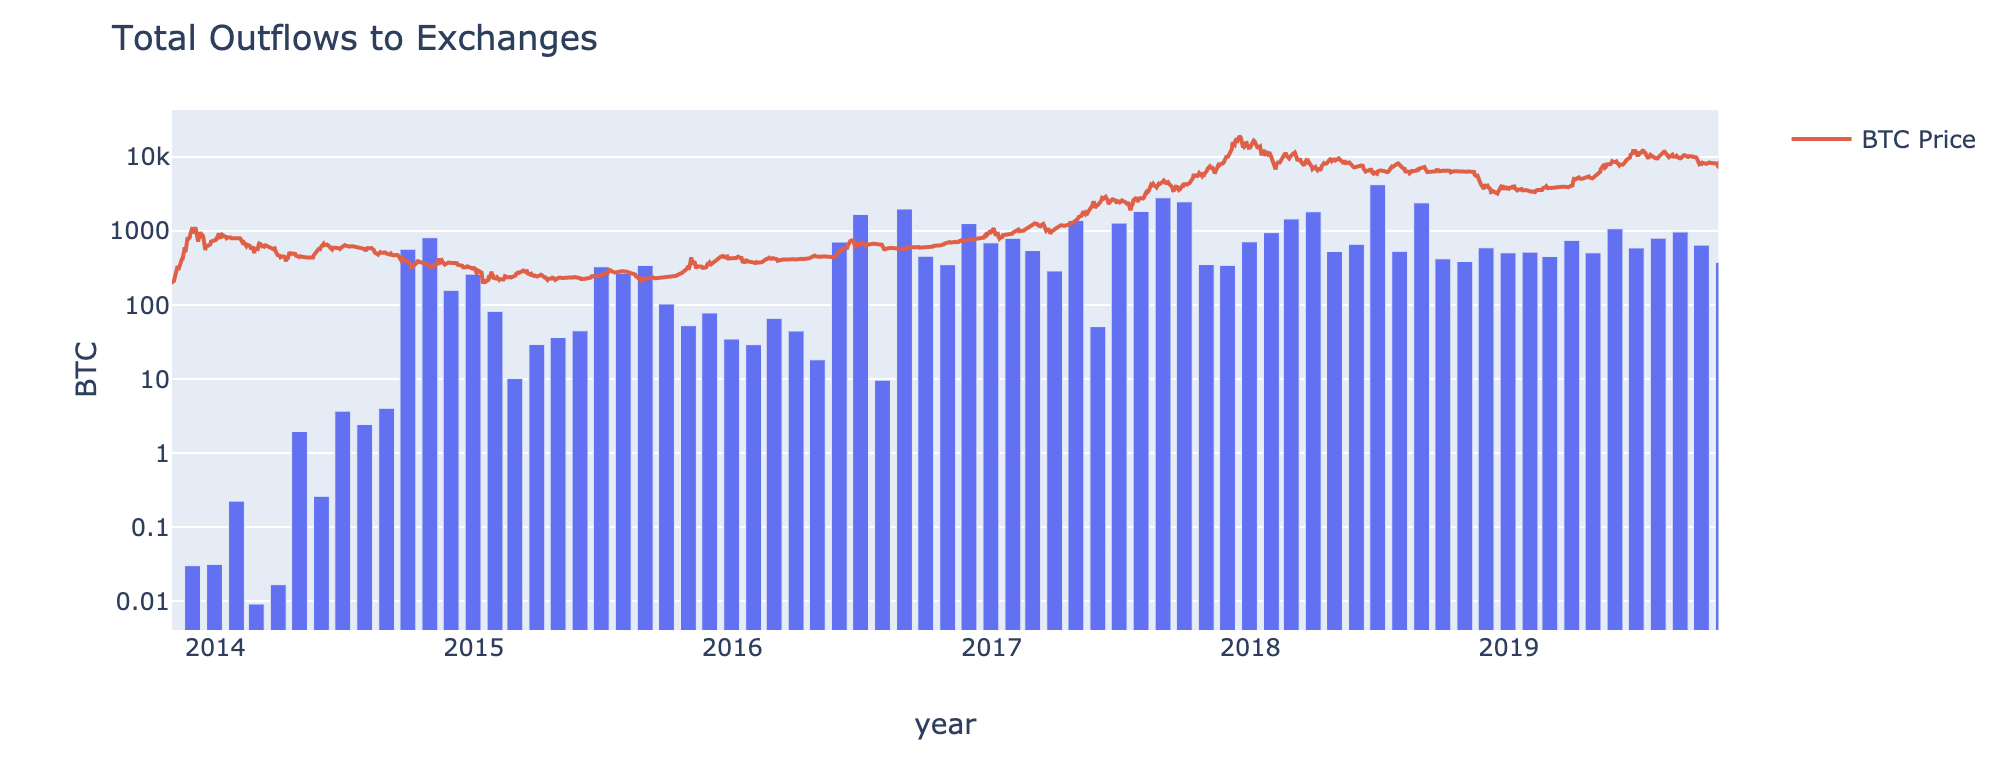
? Total outflow
At first glance, the straightforward description of the monthly outflow of bitcoins from miners to the addresses of exchanges can look quite meaningful:
Although on the logarithmic scale, the same graph no longer makes such an impression:
Since we are not interested in assessing the possibility of the influence of miners on the price a month after the withdrawal of funds, then we will operate with more granular daily data.
? About coverage and representativeness
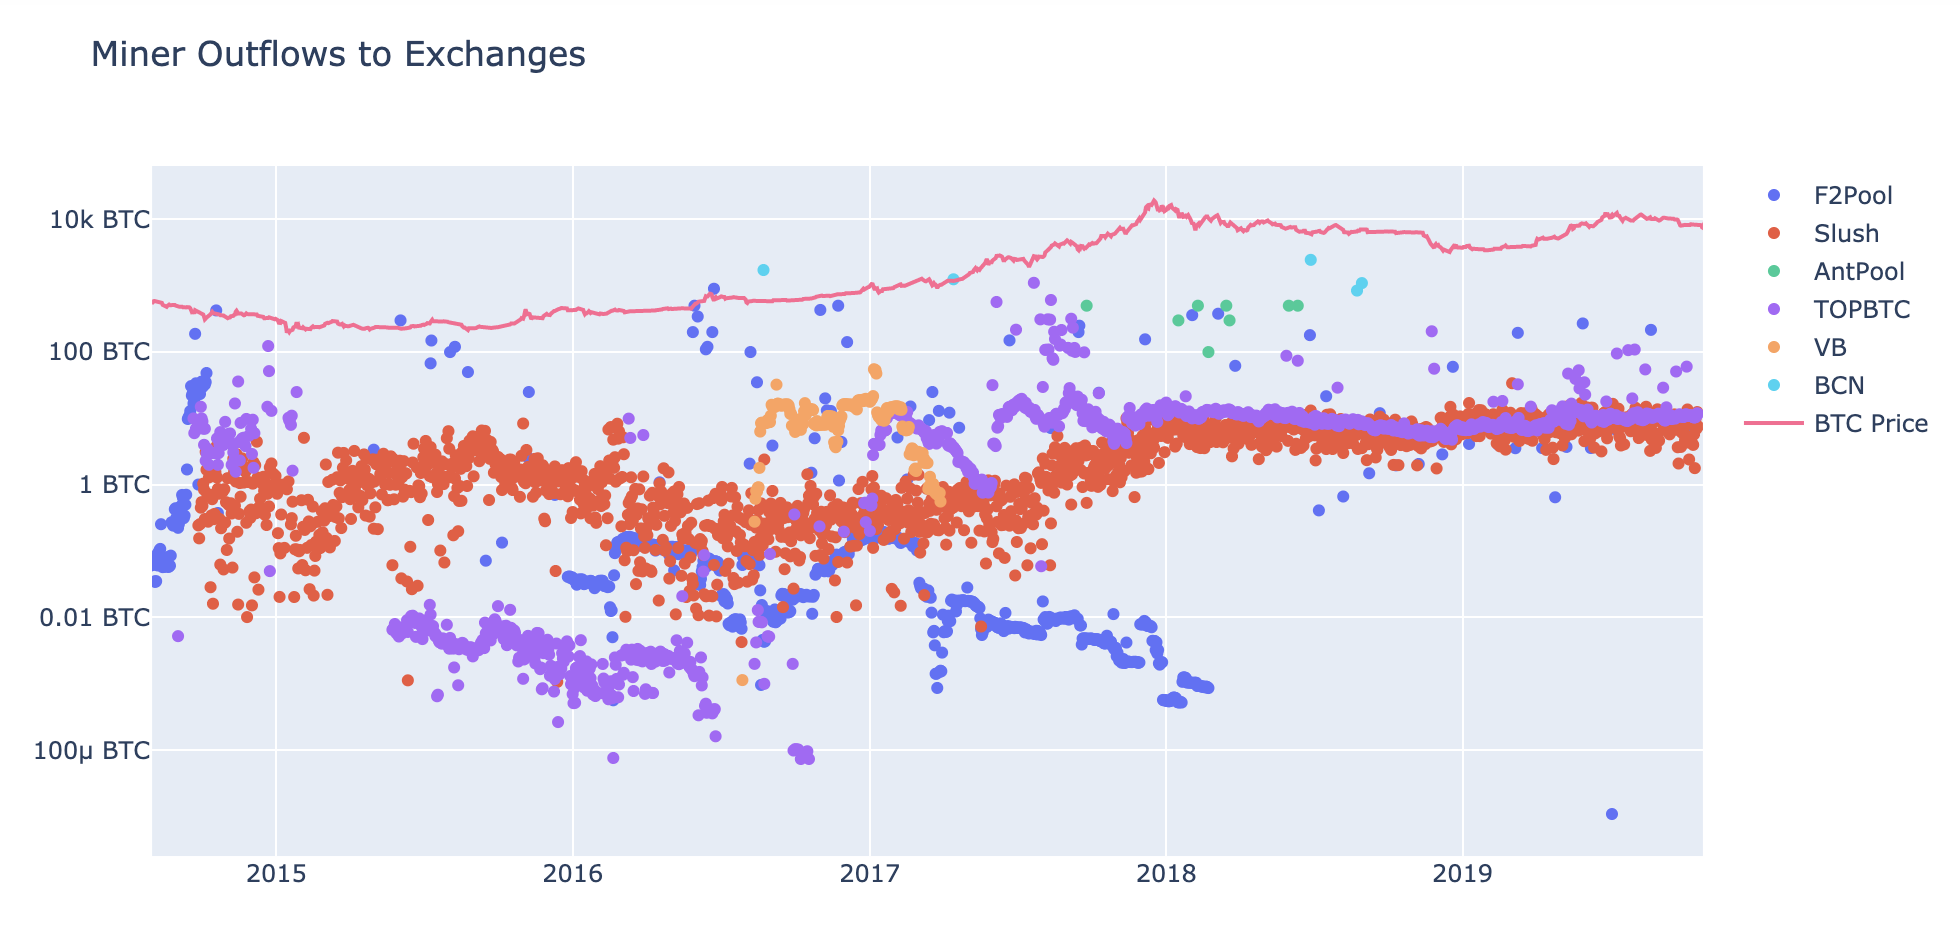
Ceteris Paribus calculated that these pools “currently constitute~ 40% Bitcoin Hashrate. With ~657,000 BTC mined (excluding transaction fees) over the past year, these pools ended up with ~270,000 BTC.
Of these mined ~ 270,000 BTC for the year, the data set used contains ~ 8500 BTC that were sold on exchanges in 2019 (i.e. ~ 3% of all mined BTC).
We can try to derive a similar degreeof underrepresentation, comparing the total marked outflow from Slush addresses - this is the pool with the most constant activity from the data presented in the data set - to exchanges with an alternative estimate of the amount of BTC that this pool has mined during its existence.
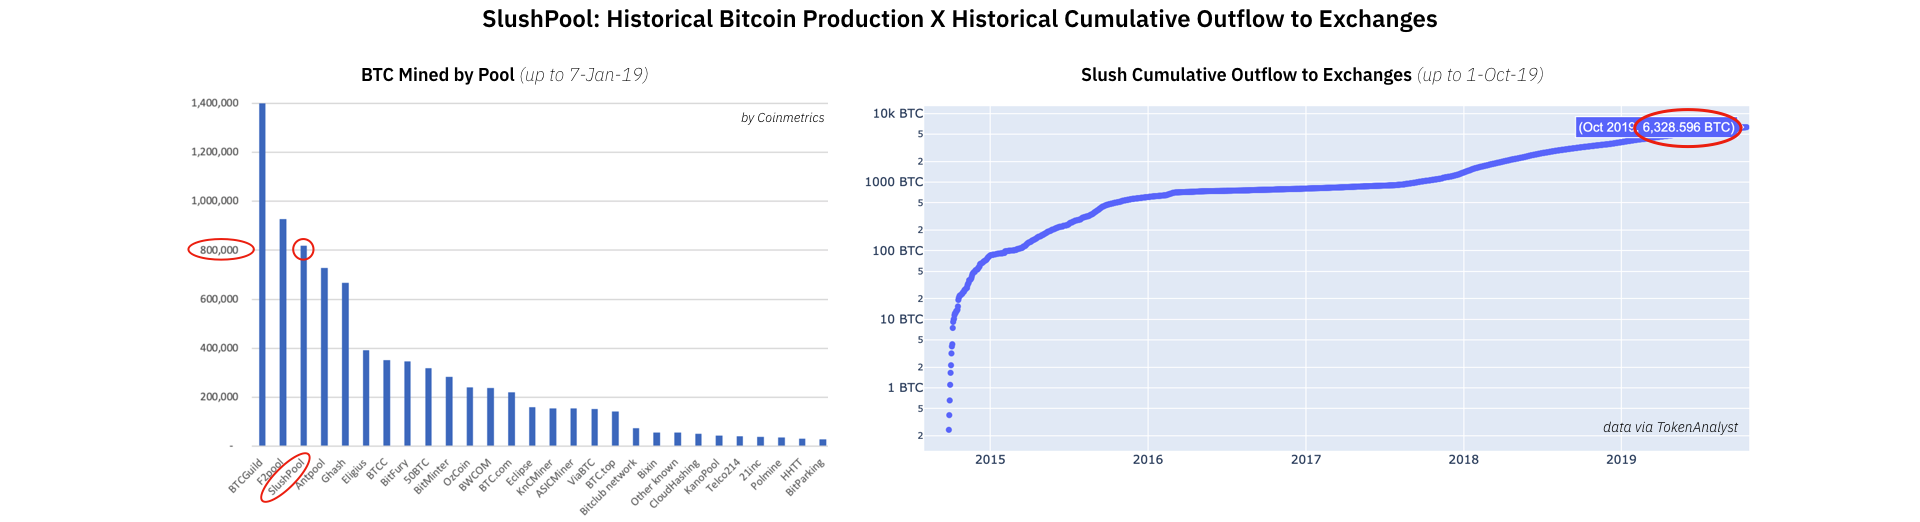
Slush: ~ 800 thousand BTC mined for the entire time (according to Coinmetrics); 6 thousand. BTC in total put on the stock exchange since the end of 2014.
Although most of the BTC outflow is with Slush, ratherSince it was concentrated at an earlier time (until 2014), it seems reasonable to assume that our data set covers approximately 1–5% of the actual BTC outflow from the pool wallets. This seems to be a good estimate for our coverage with respect to the amount of outflow from other pools.
It remains to answer the question: can these outflow figures tell us something significant about the price?
? Correlations
Answer: no (at least if you rely on the data used in our case).
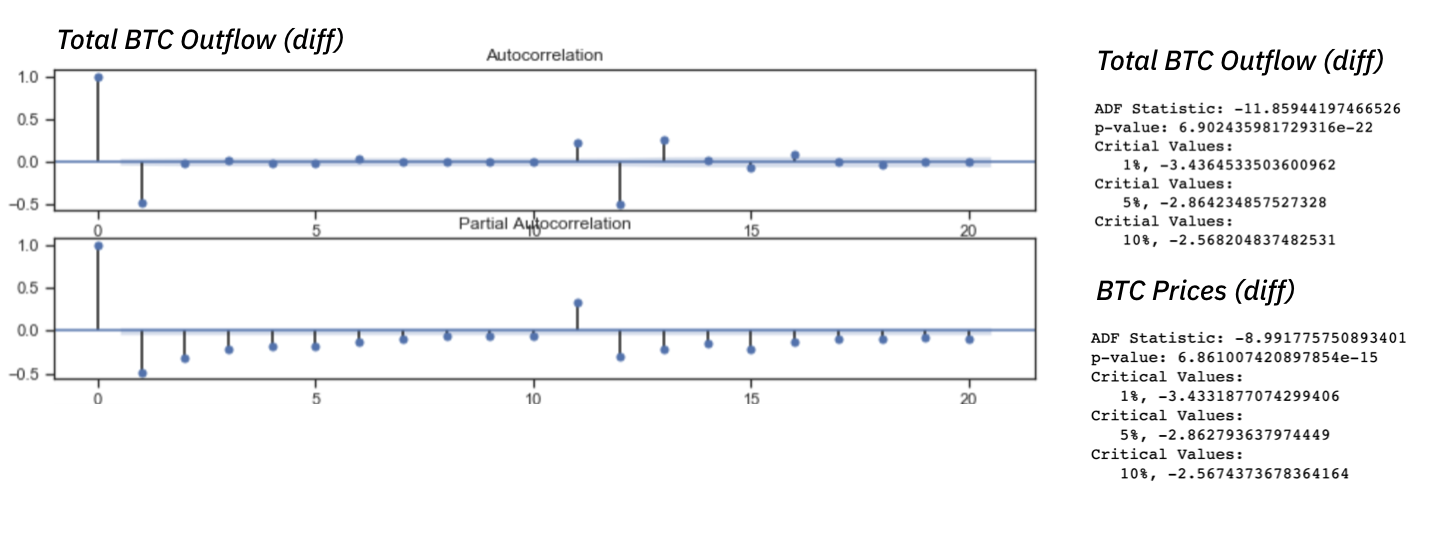
Correlogram and ADF tests for stationary total BTC outflow and prices.
After differentiating (1st order) series and checking for stationarity, we began to look for any significant connections between any movements of the marked pools and the behavior of the bitcoin price.
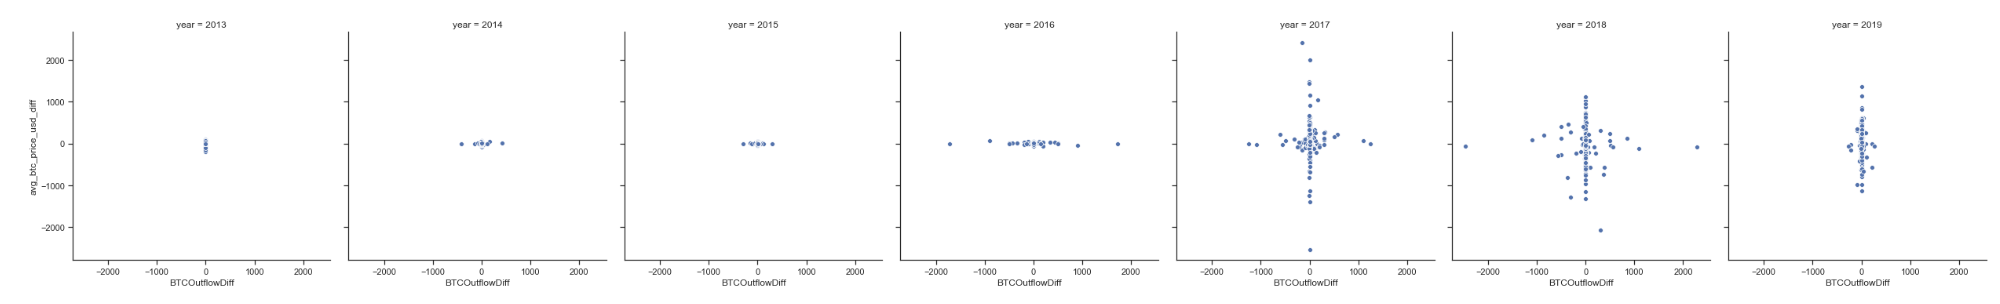
In the case of correlation scatterplots, howthose below - we generally want to be able to determine that «in cases where the outflow of BTC from miners increases, the price decreases» (either the opposite, or at least something discernible).
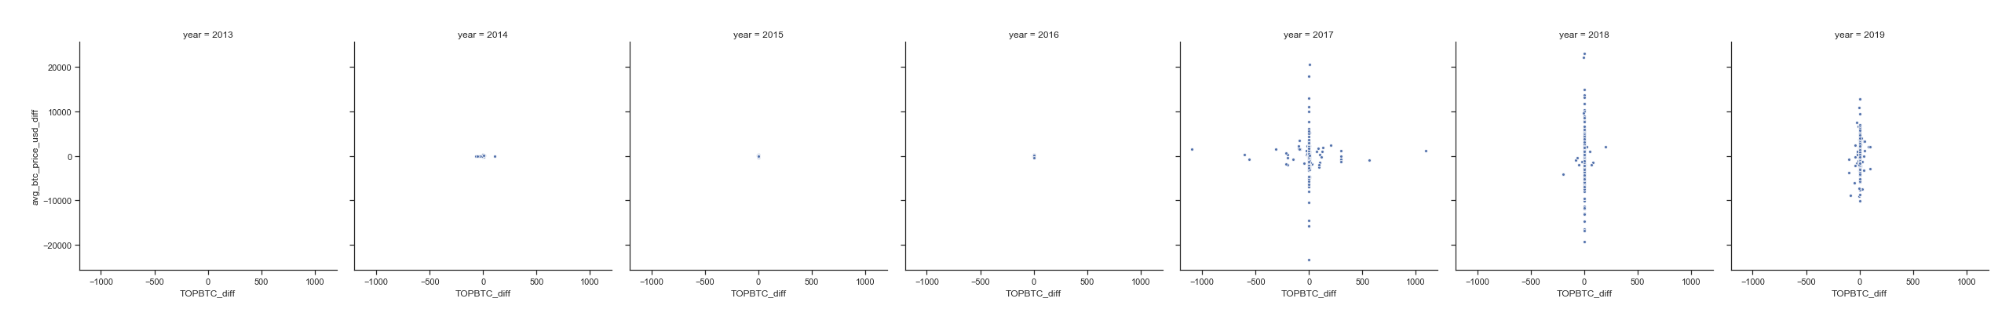
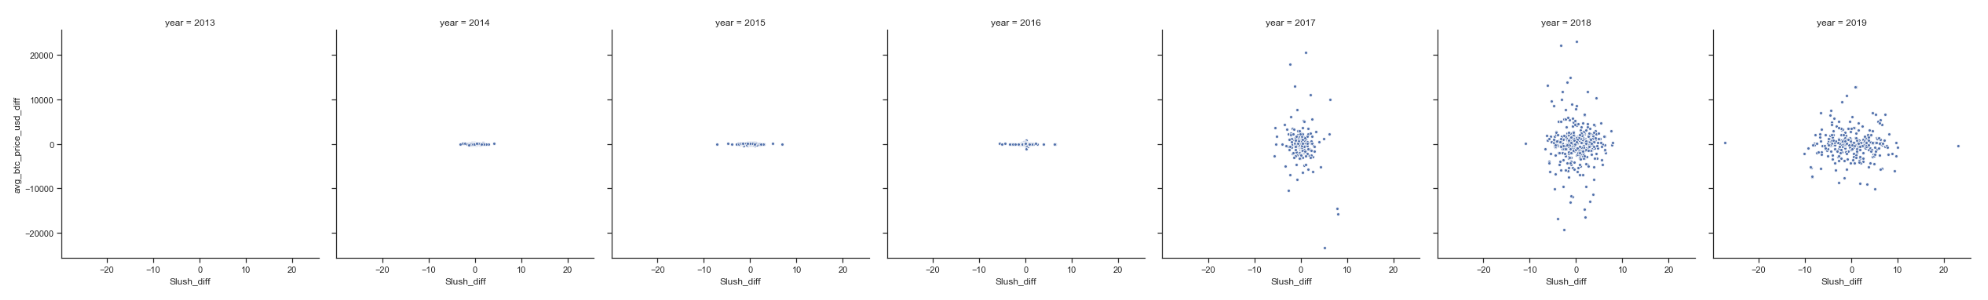
The correlation between diff (Slush) and diff (price BTC); then between diff (TOPBTC) and diff (priceBTC) for years.
A distribution resembling a shapeless amoeba or a cross indicates a weak connection (changes in one variable do not consistently lead to changes in another).
We present Slush and TOPBTC here because (1) these are the most active pools in the dataset and (2) the same diagram for the overall BTC outflow seems to contain even less signals.
Correlation between diff (total outflow of BTC) and diff (price of BTC).
The correlation coefficient for both the above series does not reveal a significant relationship with price income.
A P value of 0.062 indicates ~ 94%the likelihood that a very weak negative correlation between the outflow from Slush BTC addresses and price revenue is not a product of chance. An even lower correlation coefficient for TOPBTC should not even be taken into account because of its incredible p-value.
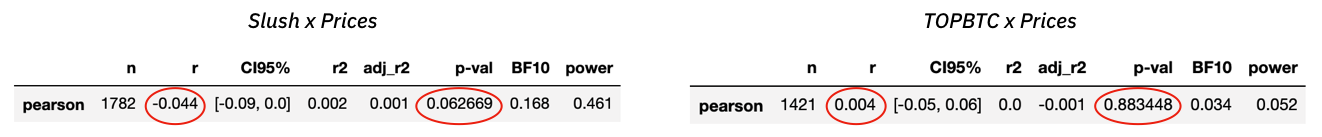
(compared with price income) Slush: r = -0.044; p-val = 0.0626 | TOPBTC: r = 0.004; p-val = 0.8834.
Strictly speaking, none of these relationships can be considered statistically significant.
Clear clusters in the data sample, as ifdo not add up to any clear picture, as shown in the graph below. We correlated changes in the amount of outflow to exchanges with price income on different timeframes - only in order to detect a clear decrease in correlation, in a slightly longer term.
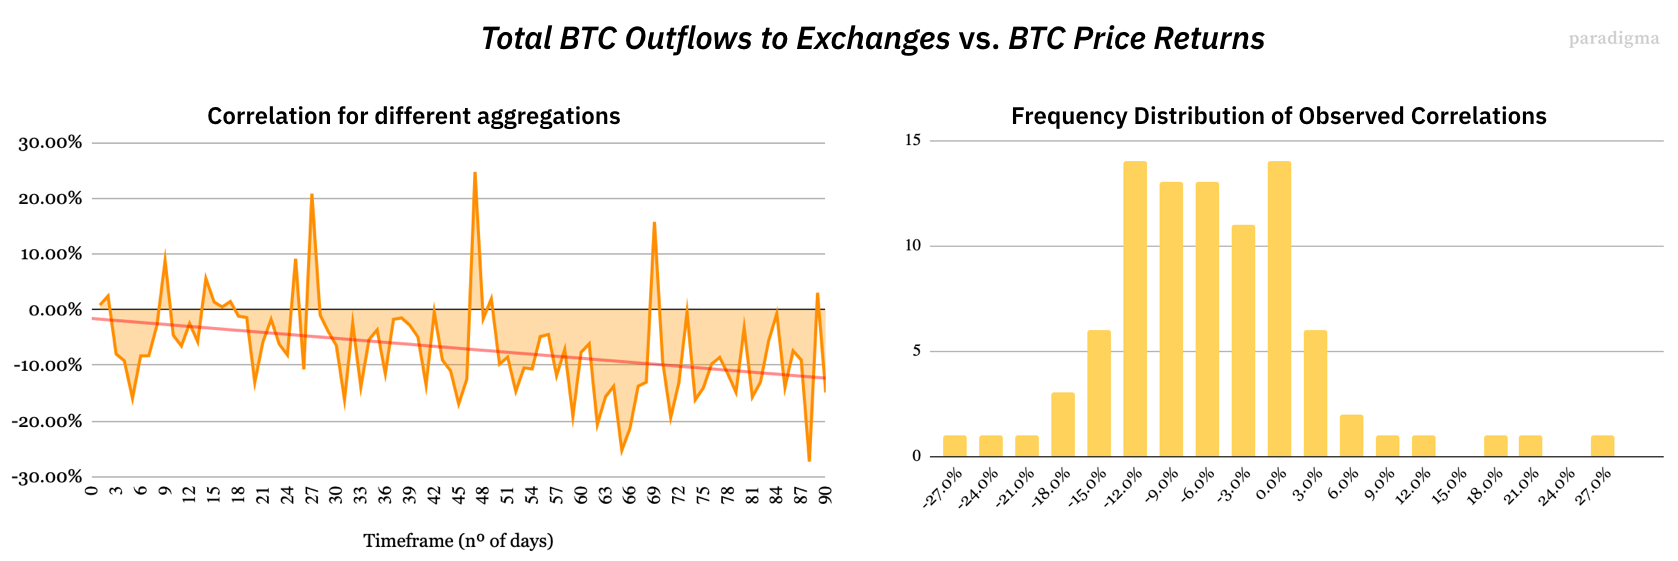
Peaks on the left chart may indicate some form of regulated behavior by miners. But the observed correlations, however, are too slight.
Finally, we checked the difference in the amounts of BTC outflow for cross-correlation with price income, however, we could not identify significant signals, regardless of the time lag selected.
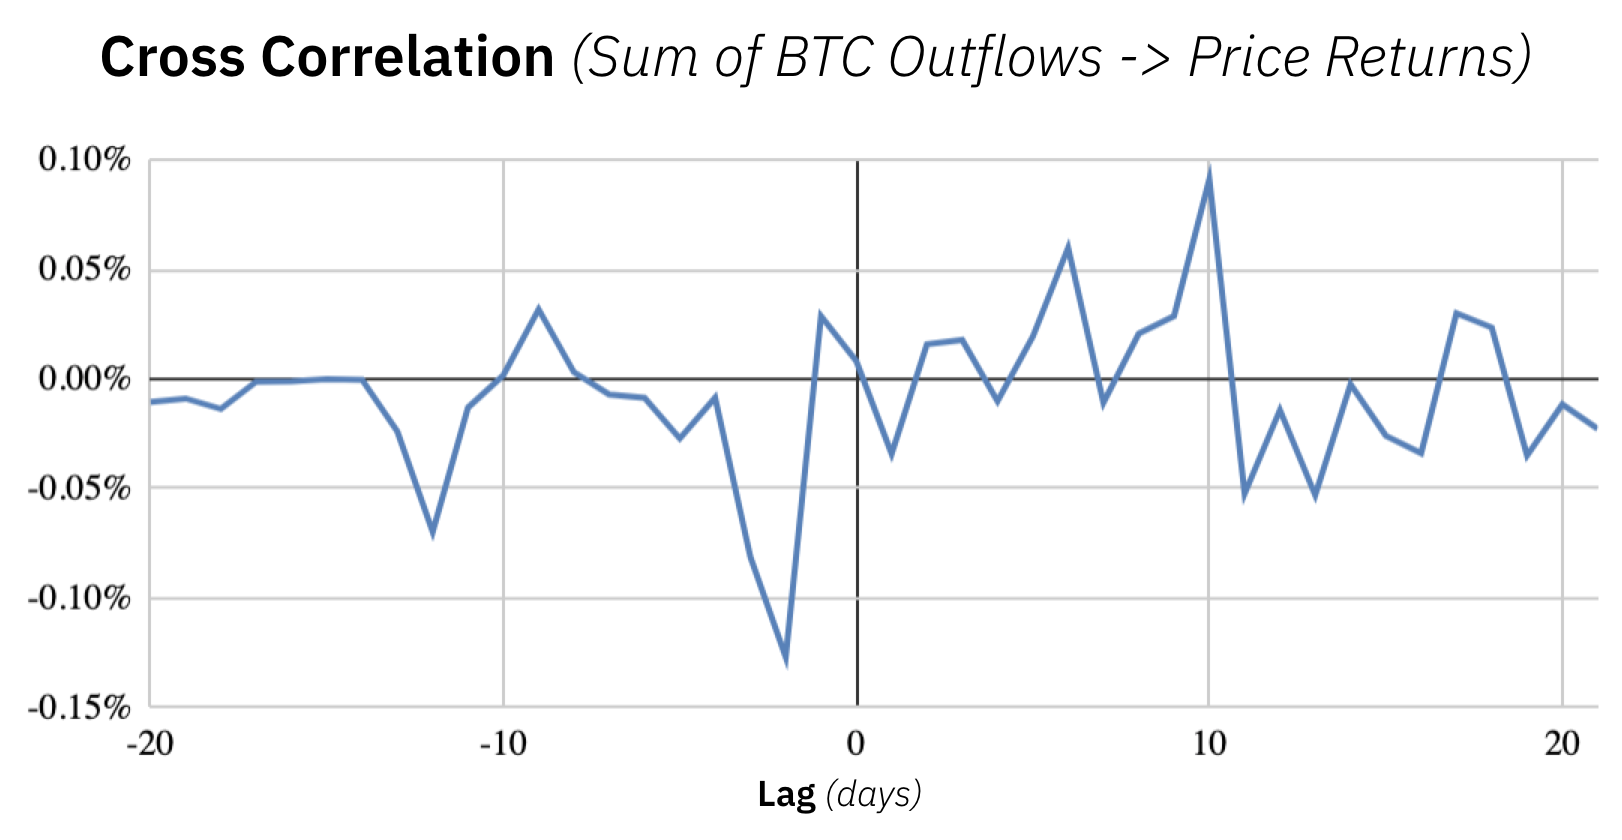
There are countless methodswhich could be applied to more fully characterize these relationships - tests of the coefficient of information content, conditional distribution, etc. But the almost complete absence of an explicit correlation makes the existence of any causal relationship much less likely, so for now we will dwell on this.
? 5. Next steps
So far, we have come to this conclusion:
- Miners actually manage only a very small share of the volume of sales on the BTC markets.
- The data sample we relied on is not infully reflects the observed phenomenon, including probably 1–5% of the actual outflow of BTC from miners' wallets (we do not know how many BTC as a result are sent by miners to the exchange, as well as how many never go there).
- We did not identify significant relationships between outflows.BTC miners on exchanges and BTC price fluctuations. This does not mean that we falsified the hypothesis that such a relationship exists (or that miners have some influence on the price).
We suggest that certain features of the behavior of the pool may distract from global patterns of behavior of miners.
Address tagging and tagging and matchingpools certainly gives some insight into the supply side of Bitcoin markets. However, since 2017, «unidentified» addresses are steadily eating away a large share of the market. Attempts to permanently identify addresses are ultimately a battle between shield and sword versus anonymization techniques.
? Notes on the heuristics used here:
Pools have different approaches to payouts. The easiest way imaginable is to send payments to all pool members in one transaction. However, only a few (if any) of the large pools actually do this. Some use an iterative approach: they pay one miner, transfer the remainder to a new address and repeat the operation. Others randomly select the number of miners to pay in one transaction, then also transfer the remainder to a new address and distribute the remainder in subsequent transactions.
Even coinbase transactions (which are theoreticallycan have more than one exit) can contain the usual pool payments (F2Pool and Eligius did this in the past). Attempting to associate a coinbase transaction with a single entity should be done with caution.
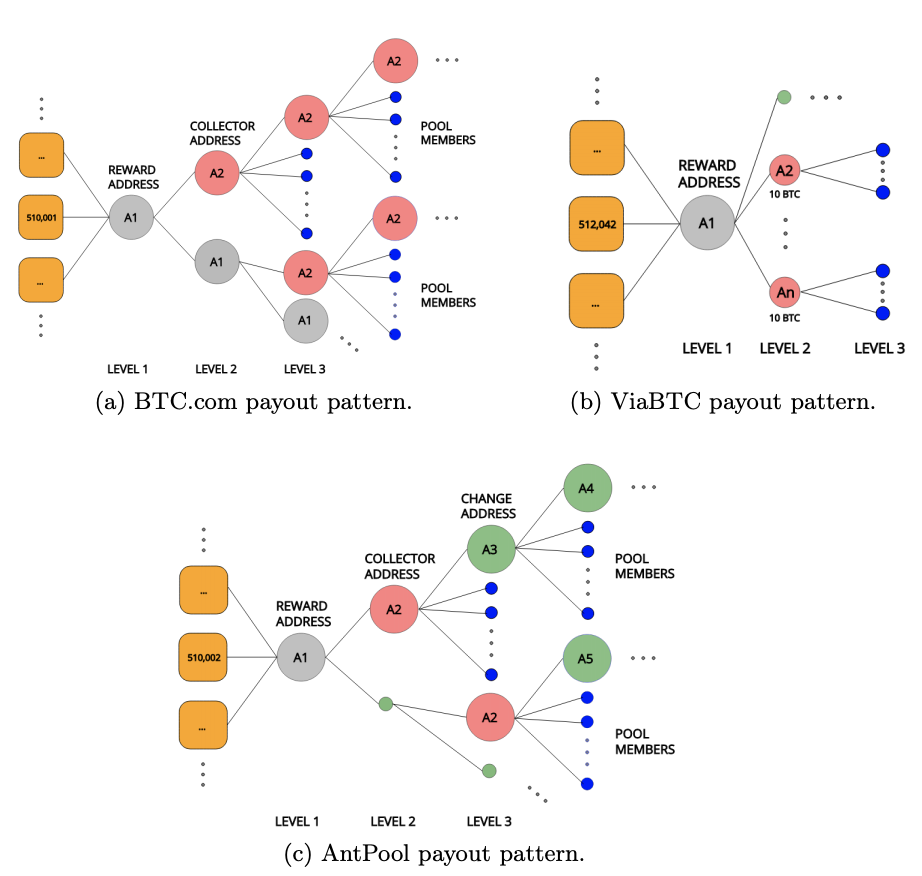
Some popular payout schemes used by pools (Romiti, Judmayer, Zamyatin, & Haslhofer, 2019)
To summarize, it can be much more difficult to trace the movement of funds owned by miners and their subsidiaries than it seems at first glance.
In this article, we described MSV (the share of miners intotal volume of on-chain transactions). This metric takes into account the first transaction originating from the address that received the coinbase transaction. However, taking into account the payment schemes used by the pools that we just described, it becomes clear that MSV does not distinguish between payment transactions for pool members, reorganization of funds and spending.
Much of the data used here is generously providedToken analyst?
</p>
Read this:
 The end of the rainy season in Sichuan forces Chinese miners to turn off equipment
Bitcoin hash growth ensured by the launch of 500,000 new ASIC miners
The end of the rainy season in Sichuan forces Chinese miners to turn off equipment
Bitcoin hash growth ensured by the launch of 500,000 new ASIC miners
 Everything You Need to Know About Genesis Mining: Prices, Profits, How-to>
 Bitmain CEO claims halving may not increase BTC price
 Miners' massive departure: Litecoin and Bitcoin Cash networks lose their hash power
 Everything You Need to Know About US GRAM