How the age of Bitcoin transactions can give us insight into four-year halving cycles and historyblockchain.
</p>HODL waves have been around for several years, but that's it.are still a relatively new concept. They were first introduced in an article by Dhruv Bansal, Co-Founder and Chief Security Officer at Unchained Capital: a financial services company on the crypto market. An interesting fact about blockchain transparency is that all sorts of ideas can be seen in the data. In particular, price is just one facet of bitcoin, i.e. that the free market will pay for the asset through buyers and sellers. By mixing data analysis with blockchain transparency, you can learn a lot more about the market and look under the hood. This is not possible with traditional markets that claim to be free and open. In particular, the Federal Reserve Board has never been truly transparently audited, which leaves a lot to be desired.
Bitcoin has become transparent thanks to its accounting structureunspent transaction outputs (UTXO), and every ten minutes each network member (node) is audited. This is what allows you to see on-chain data and ideas. This is what makes the Bitcoin blockchain such a powerful base layer.
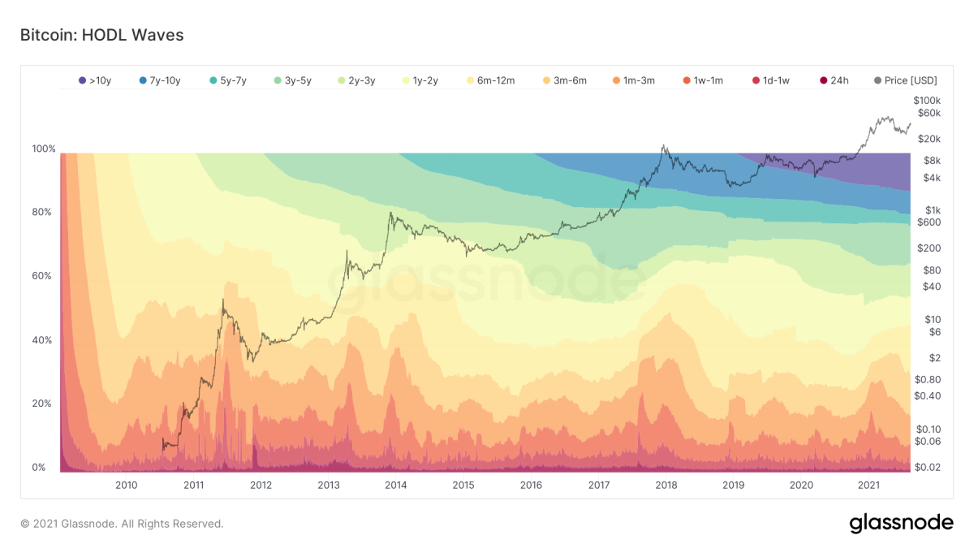
HODL waves are plotted based on UTXO data.In very simple terms, every transaction leaves a trace or "dust" (an involuntarily formed small residue, too insignificant for any operations with it). This UTXO dust has a date and time stamp that allows us to get a glimpse into the history of the Bitcoin blockchain. In this article, we will focus on three different groups that appear in HODL waves.
The graph above shows different colors.Each color indicates the age of the UTXO groups, from 10 years to 24 hours. You can see how the waves are forming by looking at the peak of each cycle. Follow them up and to the right and you will see the original HODL wave.
Lost coins
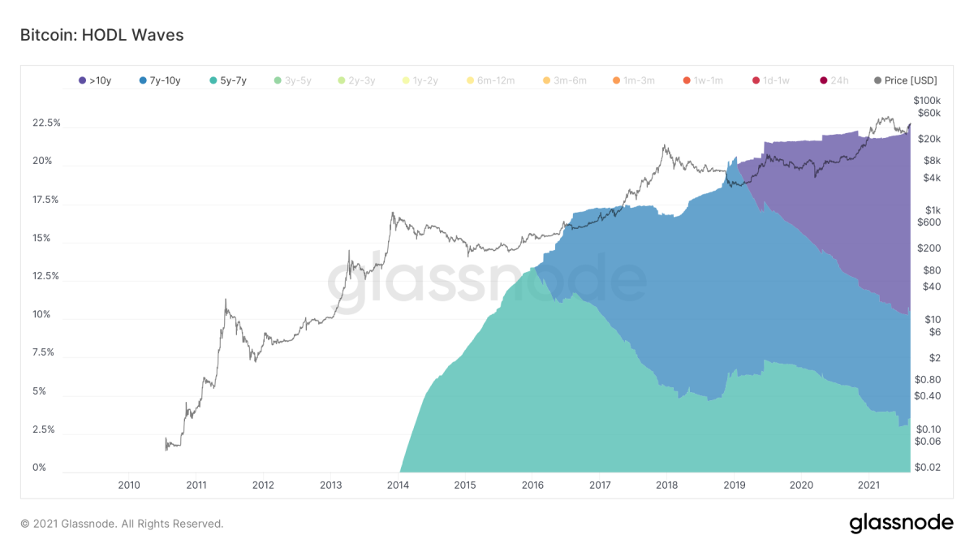
The first group of HODL waves that we will consider is -these are "lost coins". These are coins that have been clearly inactive for 5-10 years. A number of different analyzes were carried out, during which the volume of lost coins is estimated at 3-4 million. Satoshi spoke of 1 million bitcoins that have never moved and are considered “lost”.
Unchained Capital and Chainalysis spent overaccurate research of lost coins and received no more than 3.8 million lost coins. These estimates were made in 2018 and 2017, respectively, and turned out to be very good. We can assume that fewer and fewer coins will be lost over time. As wallets and security improve and technology advances, Bitcoin will become significantly more difficult to lose.
Looking at the above group of lostcoins, we see that of the approximately 18.5 million mined coins, 22% are between 5 and 10 years old. There are few changes in the group, but most of them remain intact. This means that at present, of all mined coins, about 22% is lost, possibly forever. This is very important to note as Bitcoin has a capitalization of only 21 million and this number remains unchanged. If someone loses their coins, they disappear forever. There are no rescue measures or reshuffles. The same is true for gold. If you lost all your gold in an accident, it would be gone forever. This makes Bitcoin even more scarce and in turn more valuable.
Fortunately, Bitcoin's ease of use is growingevery day, and we see more and more secure ways to store keys. With multisig, new wallets, capital storage solutions and encrypted backups, bitcoin has become harder to lose. Not to mention the importance and exponential rise in dollar value, which is why most people put more effort into preserving their bitcoins in the long term compared to what was before. It's not just magic internet money anymore.
Long-term holders
Realized Price Weighted HODL Waves
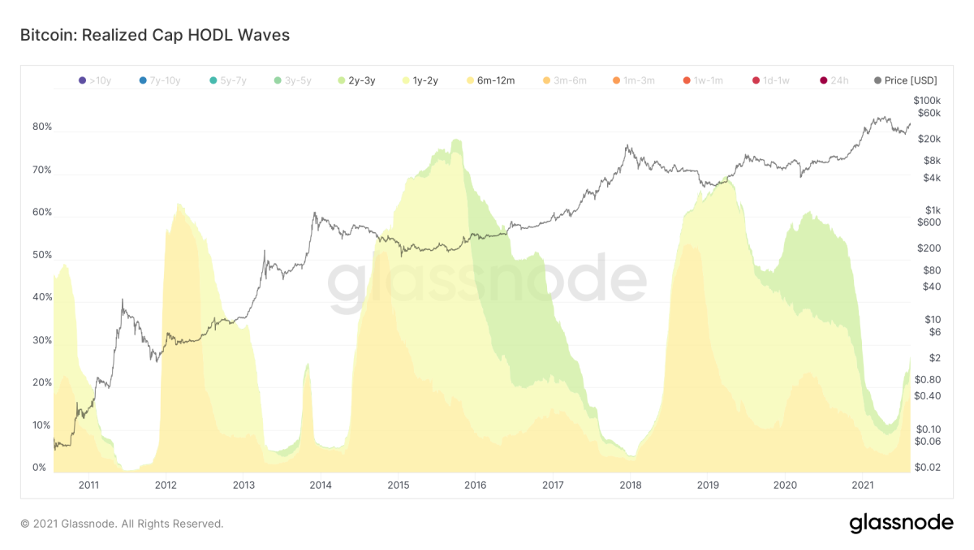
The second group is “long-term holders”.She is classified into UTXO groups from six months to three years. It usually manifests itself between bull markets or rapid price increases at lower time frames. This wave usually appears after the completion of a bull market. UTXOs get thinner as the bull market intensifies.
Although not ideal, one can use it likea tool to see where we are in the bullish rally. There was a clear increase in the number of long-term holders in 2015-2017, which peaked at the beginning of the bullish rally. As soon as the price started to rise, they started selling. The lowest point fell just at the peak of the pump in 2017.
The bullish rally of 2012-2014 sawshort-term phase of accumulation, which manifested itself in the growth of quotations at the end of 2013. These waves do not predict trends, but they are an excellent textbook on the history of what happened throughout the phase.
Short-term holders
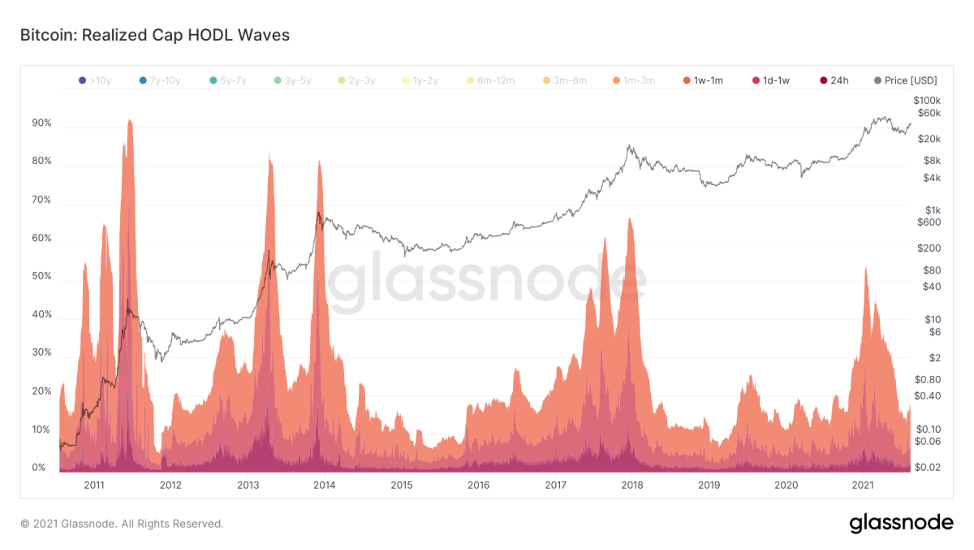
The third group is "short-term holders".They are grouped by age from one day to one month and peak at huge price spikes in bitcoin history. If you look closely, you can see three large price spikes for each bullish rally. We are currently only at the first price jump. It looks like it could be the arrival of retailers and short-term speculators.
In 2012, we saw the first big jump in prices,which turned into consolidation and then into growth. It was repeated in 2016, but it was a continuous jump in prices that became smoother as a result of a single blowout rather than a double pump. This short-term HODL wave will be interesting to watch over the coming months.
Bull and Bear Market Visualization
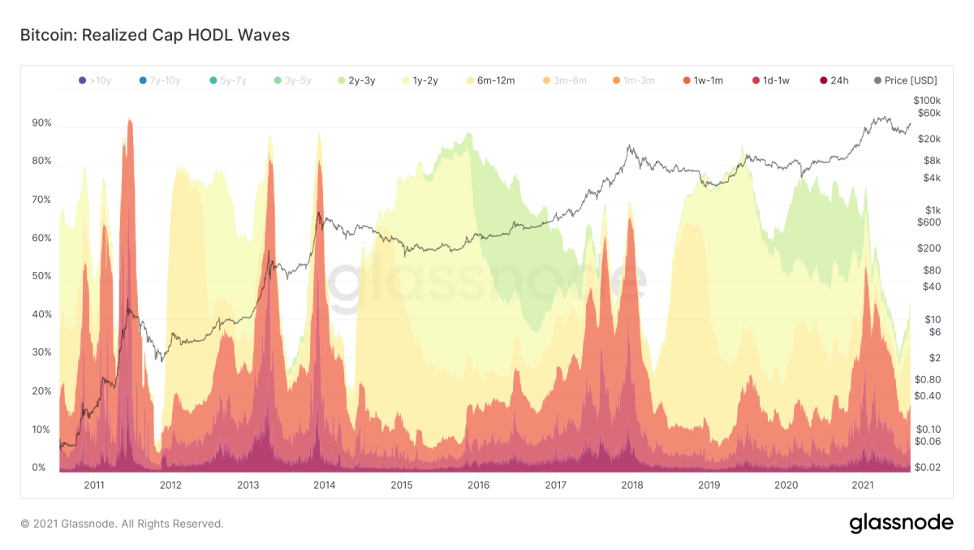
By placing them side by side, you can see a clearthe difference between when we were in a bull market and when we were in a bear market. Long-term holders give way to short-term holders as prices rise, eventually ending a bull market when there is nothing more to buy. Since an increase in price means an excess of buyers over sellers, this makes sense. I won't make any price predictions, but it looks like UTXO and HODL waves are evolving or maturing. As wallet / security technology improves and tier 2 solutions evolve, UTXOs will start to look different. Bitcoin is evolving at a fast pace, so this may be the last year that we see these types of signatures on the blockchain.
RHODL Ratio
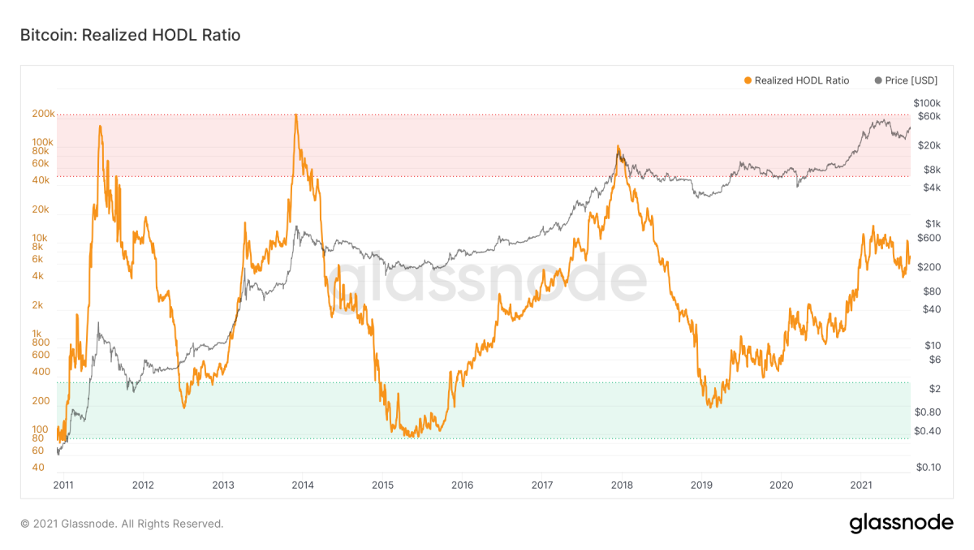
Finally, looking at the difference between long-termand short-term investors, you can make up the ratio. Glassnode has clearly implemented it, and the ratio seems to track the boom and bust cycles of the past pretty well.
RHODL Ratio is a market indicator,which uses the realized capitalization ratio of HODL waves. Specifically, the RHODL ratio takes the relationship between the 1 week and 1–2 year RCap HODL ranges. It also explains the increase in supply by weighing the ratio over the general age of the market. A high ratio indicates an overheated market and can be used to identify time cycle highs. This metric was created by Philip Swift.
By this indicator, the bull market is far from over and is similar to the bull market of 2014. While this is not a prediction of future success, we can draw some conclusions from this data.
On-chain data is still relatively new, but it isgave us a lot of information and will continue to show new and exciting things about the Bitcoin blockchain. All this is possible thanks to the structure of UTXO in the Bitcoin network and the transparent nature of its transactions. Ultimately, Bitcoin will continue to evolve and evolve, leaving behind various metrics as layers are built on top and transactions move from one layer to another. It’s impossible to say what the future holds, but the opportunity to watch the journey from data is more exciting than ever.
BitNews disclaim responsibility forany investment advice that this article may contain. All the opinions expressed express exclusively the personal opinions of the author and respondents. Any actions related to investments and trading on crypto markets involve the risk of losing the invested funds. Based on the data provided, you make investment decisions in a balanced, responsible manner and at your own risk.
</p>
Read this:
 Bitcoin Price Formulas Now Available On Hodl Hodl
Hodl Hodl is the first non-custodian trading platform available through a mobile application
P2P Bitcoin exchange Hodl Hodl launches its API
Hodl Hodl and BlueWallet Partnership
The competition from Bitnovosti and Hodl Hodl continues. Participate and win “Opendime” wallets and a stylish merchandise from P2P Bitcoin Exchange.
The contest ends with Bitnovosti and Hodl Hodl. Participate and win “Opendime” wallets and a stylish merchandise from P2P Bitcoin Exchange.
Bitcoin Price Formulas Now Available On Hodl Hodl
Hodl Hodl is the first non-custodian trading platform available through a mobile application
P2P Bitcoin exchange Hodl Hodl launches its API
Hodl Hodl and BlueWallet Partnership
The competition from Bitnovosti and Hodl Hodl continues. Participate and win “Opendime” wallets and a stylish merchandise from P2P Bitcoin Exchange.
The contest ends with Bitnovosti and Hodl Hodl. Participate and win “Opendime” wallets and a stylish merchandise from P2P Bitcoin Exchange.