He talks about further possible scenarios for the price movement of Bitcoin and several popular altcoins.RoboForex lead analyst Dmitry Gurkovsky.
</p>- The cryptocurrency market remains under controlsellers — all assets went to update the nearest minimums. However, a reversal “Wedge” pattern is already forming on the daily Bitcoin chart, which may well become the basis for a reversal and an attempt to grow in the near future. The bulls need to consolidate above the level of $7,670, which will act as a confirmatory signal in favor of continuing the upward trend.
- Similar patterns are forming in digital assets such as Ethereum, Litecoin and Bitcoin Cash. An important factor here will be the growth of Bitcoin, which will already «pull» followed by the rest of the market.
- From the point of view of technical analysis, the XRP chart does not contain the prerequisites for the start of a reversal.
Bitcoin
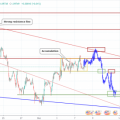
Quotes continue to decline.Buyers never worked out the reversal pattern «Failed swing» on the RSI indicator. However, we are already seeing an attempt to form a “Wedge” pattern, which could ultimately trigger growth towards the target at $9,800. An additional signal in favor of this scenario will be a test of the support line on the RSI.

BTC / USD, 1D, TradingView data
Previously, a similar test caused a slight increase, inIn the current situation, with the formation of a reversal pattern, a reversal of the downward trend may begin. Confirmation will be a breakdown of the upper boundary of the «Wedge» pattern. and consolidation above the level of $7670. Cancellation of the scenario will be a fall below the $4,375 area, which will indicate the cancellation of the formation of the model and a continuation of the decline.
There is potential forformation of the bullish pattern "Wolfe Wave". The lower boundary of the model is located near $5890. You should expect a test of this level before the start of growth. RSI values are located above the support level, so it is important to see a test of this line before the rise begins. If it consolidates below the level of $5890, further decline is expected.

BTC / USD, H4
Ethereum
On the daily chart, the asset continues to fall,sellers at the moment managed to gain a foothold under the support level. The nearest area to bounce up is at $ 100. Moving averages still indicate a bearish trend.
Talk about the reversal of the current movement is withbreakdown of the upper boundary of the downward channel and fixing quotes above the level of $ 200. In favor of a probable bounce from the $ 100 level, a test of the trend line at RSI also appears. In case of breakdown of the support area and consolidation below $ 100, we should expect a continuation of the downward trend.

ETH / USD, 1D, TradingView data
Continues at smaller time intervalsa bullish “Wolfe Wave” pattern is forming, which implies a price increase above the $157 level. Although the pattern against the current trend looks aggressive, it is quite capable of helping the bulls stop the fall.

ETH / USD, H4
An additional signal in favor of a price increaseis a test of the support line on the RSI. This scenario will be confirmed by a breakdown of the upper boundary of the «Wolfe Wave» model. with the price fixing above the level of $140. Cancellation of this option will be a breakdown of the $100 level.
Xrp
XRP / USD quotes broke through the support area. At the time of the last test of the upper border of the Bollinger Bands indicator, the price pushed off and broke through the lower border, which indicates the presence of a strong downward impulse. However, RSI values immediately met support in the form of a trend line. Expect a slight drop with the test area of $ 0.1485 and the beginning of growth.

XRP / USD, 1D, TradingView data
About a full U-turn, it’s worth talking only withbreakdown of the upper boundary of the downward channel and price fixing above the level of $ 0.2740. Cancellation of the option with growth may be a breakdown of the lower boundary of the downward channel and consolidation below the level of $ 0.1000, which will provoke an acceleration of the fall.

XRP / USD, H1
On the hourly chart, quotes are falling withindownstream channel. Here there is every chance to see a test of the lower border of the channel near the level of $ 0.1600, after which we can expect the development of an upward correction. In favor of a short-term fall, a test of a downward trend line at RSI will come out. As soon as the bulls manage to gain a foothold above the level of $ 0.2290, it is worth waiting for the development of an upward impulse.
Litecoin
Litecoin quotes continue to develop a strong downward movement on the daily chart. However, now, despite the pressure from the bears, there is potential for a rebound and the beginning of growth.
RSI values are testing the support line again. Do not rule out a fall with the test area of $ 42 and attempts to move up. Confirmation of growth will be a breakdown of the level of $ 50, which will indicate the exit of quotes beyond the downward channel. In the case of a further fall and breakdown of the region of $ 30, we expect the formation of a downward impulse.

LTC / USD, 1D, TradingView data
A bullish pattern is forming on the 4-hour chart«Wolfe Wave», which indicates the potential for growth towards the target at $50. A strong signal in favor of this scenario is a rebound from the support line on the RSI. Confirmation of growth will be a breakdown of the upper boundary of the model and consolidation above the $42 level. Cancellation of this option will be a breakdown of the $30 area, which will indicate the cancellation of the model and the continuation of the downward movement.

LTC / USD, H4
Bitcoin cash
On the daily chart, the price is squeezed within the boundaries of the pattern«Wedge». The support line on the RSI is located quite close, which portends a fall in the price to the level of $160, followed by the beginning of growth. The rise will be confirmed by a breakdown of the upper boundary of the Cloud of the Ichimoku Kinko Hyo indicator. Cancellation of the described option will be a breakdown of the area around $160, which will indicate the cancellation of the «Wedge» and continued decline.

BCH / USD, 1D, TradingView data
At smaller time intervals, the price was able to break through the support area. At the moment, there are prerequisites to see the test area of $ 160 before the start of growth.

BCH / USD, H4
An additional signal in favor of the probablethe rebound will perform a support line test on the RSI. Confirmation of the reversal will be a strong price increase with a breakdown level of $ 195, which will indicate the exit of quotations beyond the downward channel.
Attention!
Financial market forecasts are privateopinion of their authors. Current analysis is not a guide to trade. RoboForex is not responsible for the results of work that may arise when using trading recommendations from the submitted reviews.
Read this:
 Technical analysis: cryptocurrency market is ready for a new wave of growth
 Analysis of Bitcoin Cash ABC, Litecoin, EOS and Stellar Lumen on 10/30/2019
 Technical analysis on EURUSD, XAUUSD and BTCUSD
 Analysis of cryptocurrency pairs BTC / USD, ETH / USD and XRP / USD on 11/06/2019
 Analysis of Bitcoin Cash ABC, Litecoin, EOS and Stellar Lumen on 10/31/2019
 Buyers of luxury Karma electric cars will be able to pay with their bitcoins