Analyst Will Clemente analyzes the current situation using on-chain metrics, separating signal from noise.
Alreadymonth as Bitcoin trades in a range thatI, like most other on-chain analysts, characterize it as a phase of repeated accumulation. Early last week we tested the highs of the range just above $41k before falling back to the lower end of the range at $35k at time of writing. First, let's try to zoom out on those on-chain metrics that can help us assess where we are in the market cycle in a broader sense, and then zoom in and take a closer look at a few metrics that, in my humble opinion, will be most important watch in the coming weeks.
Key takeaways from today's review:
- according to on-chain metrics, bitcoin appears to be heavily oversold;
- now BTC is at important breaking levels in several major on-chain indicators at once;
- long-term owners seem to continue to accumulate relatively cheap BTC;
- sales of short-term owners continue to lose momentum;
- accumulation continues to gain strength;
- there are still no signs of new institutional and / or wealthy buyers (whales).
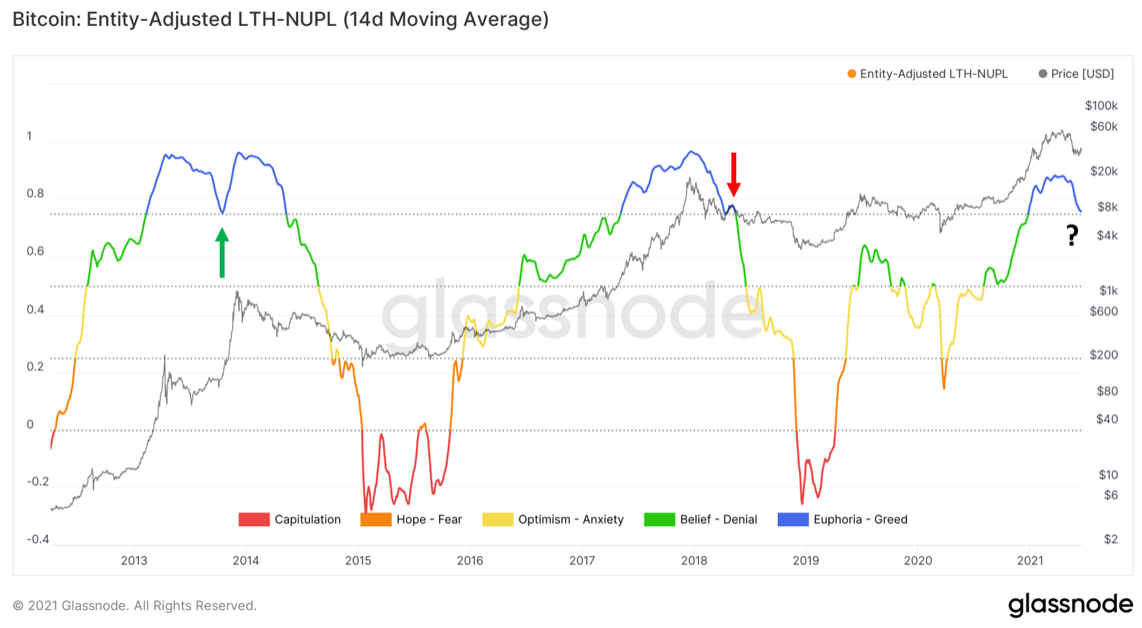
NUPL (Net Unrealized Profit / Loss) is one of myfavorite metrics for determining the structure of the market in a broad sense. To calculate it, the difference between the realized and market cap of Bitcoin is calculated and divided by the market cap. (Realized capitalization is calculated based on the price at which each of the existing coins moved last time.) This allows you to get some idea of the prevailing sentiment of market participants, since in the later stages of euphoria, investors take profits at a slower pace, and in bearish stages they begin to take profits significantly faster. Glassnode divides these stages into several zones: Greed, Optimism / Denial, Hope / Fear, and Capitulation.
Glassnode even allows this metric to be appliedseparately to long-term (LTH) or short-term (STH) owners. Looking at the 14-day moving average LTH-NUPL, we are now right at the threshold that has historically separated bull and bear markets. Between the two pumps of 2013, we bounced off the lower band of the euphoric zone, whereas at the end of 2017 we fell through this zone like a stone after a very small rebound. A more accurate assessment of market sentiment in terms of this metric, apparently, can be given only in the next few weeks. This is definitely one of those indicators that it makes sense to watch in the near future.
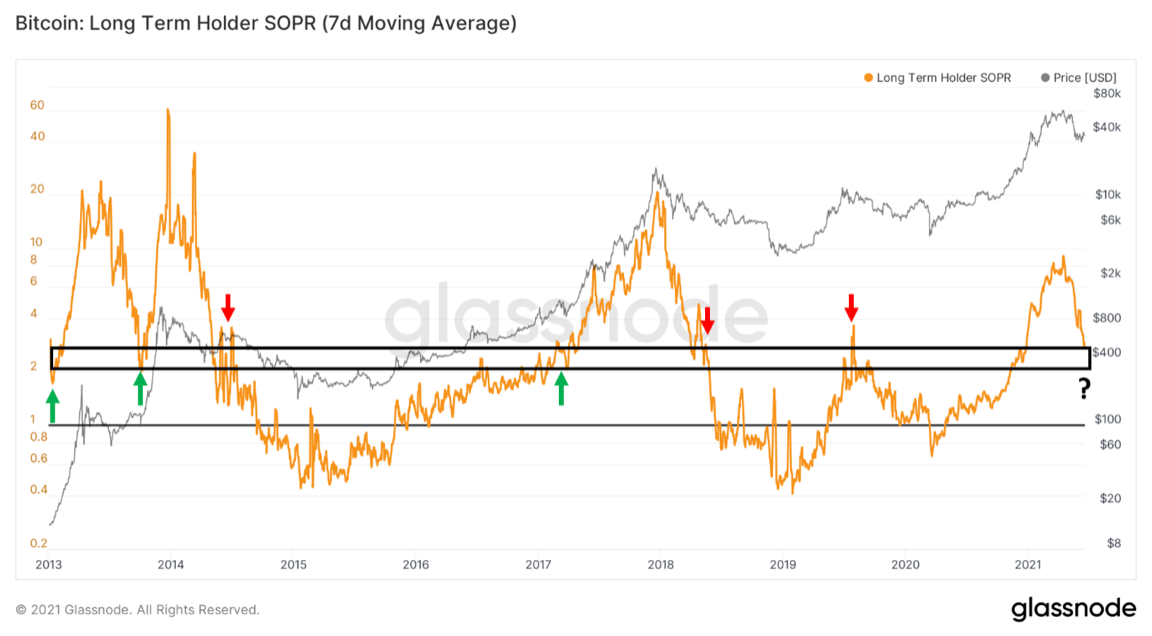
The next metric, also at a turning pointlevel, is the SOPR (cost of profitability ratio) for long-term owners. We have discussed SOPR more than once, and you can learn more about it in this article. The current level that this metric is now approaching has served as support in 2013 and late 2017, but also as resistance following the 2013, 2017 and 2019 bull rallies.
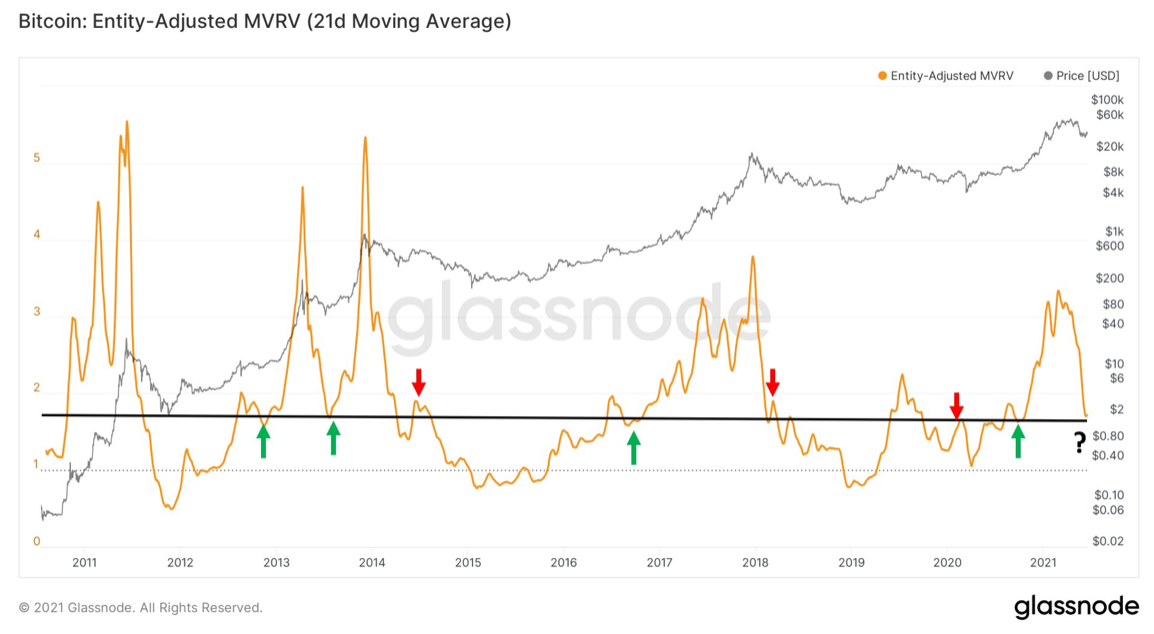
Third, there is the MVRV ratio representingis simply the ratio of market cap to realized cap. It is also located at an important level that has historically served as resistance or support for bitcoin.
All of these important metrics are at the thresholdthe level that separates the continuation of the bull market from the onset of the bear market. It is also worth noting that according to these indicators, BTC has not yet reached any historically significant zones of overheating or extreme “greed” of the market. At the same time, Bitcoin needs to make an upward movement in the coming weeks in order to get out of this zone of uncertainty and get a new momentum. However, taking into account some medium-term trends, the fundamental activity of investors, in my opinion, looks rather bullish, therefore I tend to characterize the current range as a phase of re-accumulation. And the readings of the on-chain indicators at the end of the last week confirm my assumption that we are in the second half of this phase. Let's take a look at these indicators.
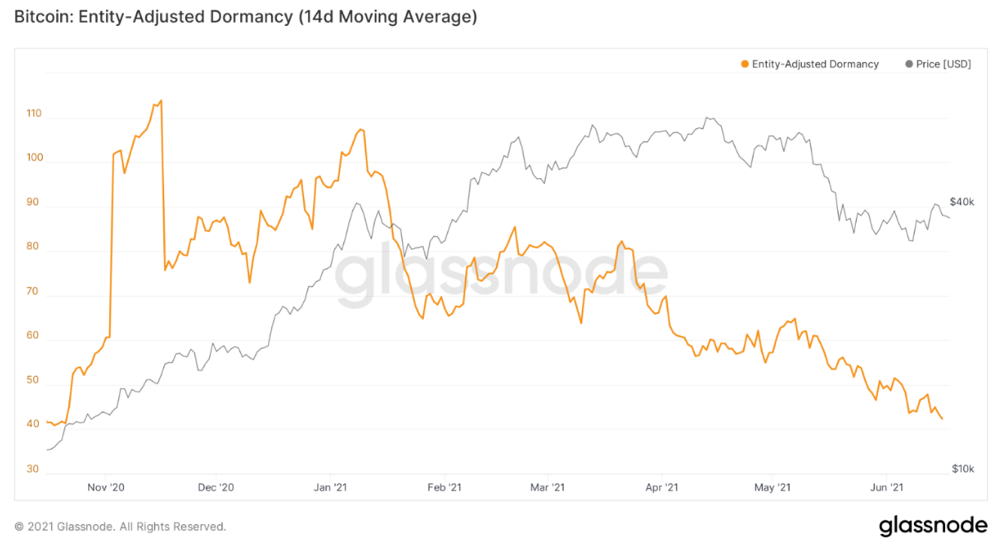
An important point to start with, thoughthis already sounds like a worn-out record: short-term owners are still the main source of sales. Entity-adjusted Dormancy is still in a downtrend (younger coins are on sale). This is also seen in the share of supply held by short-term owners, although some of this growth is made up of short-term owners moving into the long-term cohort.
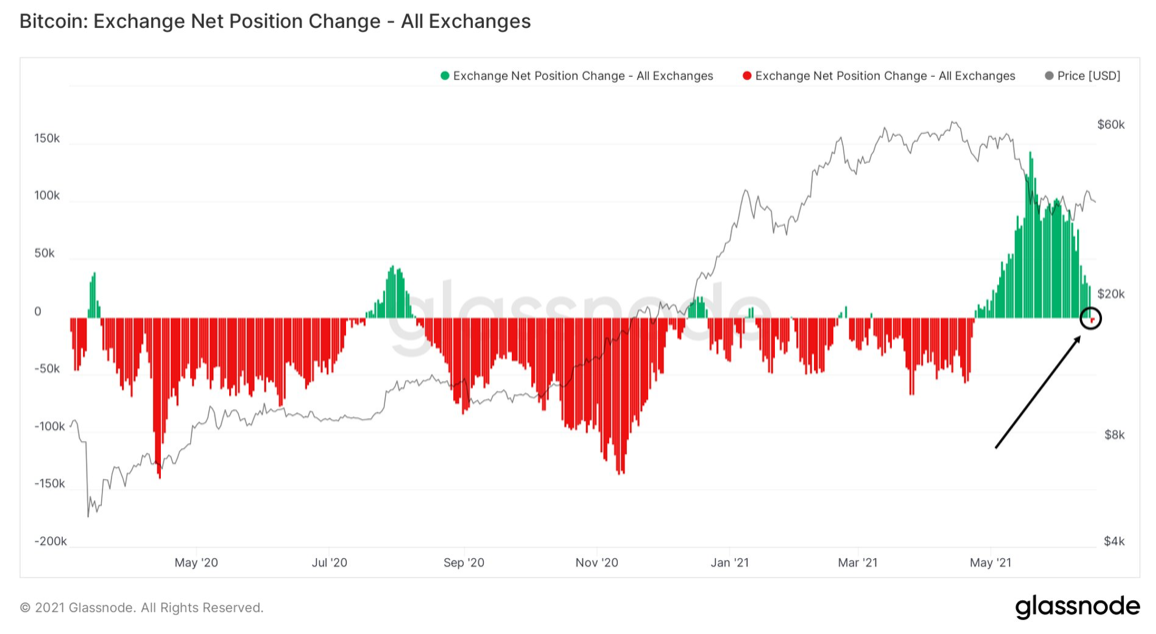
The next indicator is the change in the net positionexchanges (Exchange Net Position Change). It shows that the dynamics of cash flows on exchange-traded bitcoin addresses has ceased to be bearish and again indicates the predominance of accumulation.
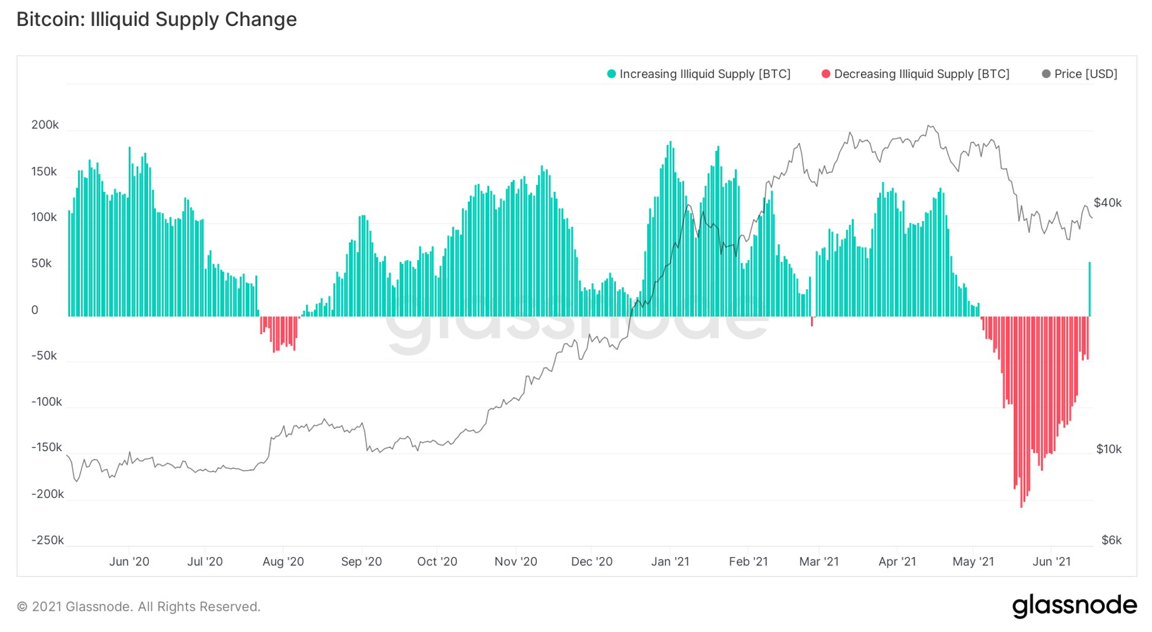
Go ahead.Illiquid Supply Change. This indicator tracks a 30-day supply change to determine if it is becoming more liquid or illiquid overall. And as you can clearly see in the chart below, it has returned to the green zone for the first time since the sale began.
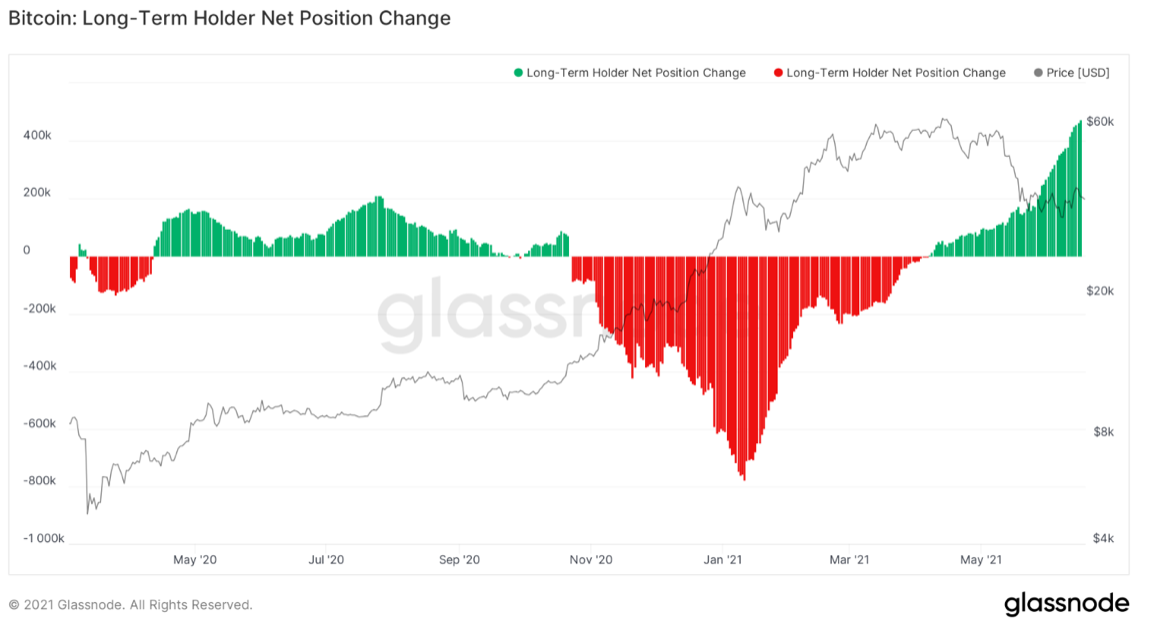
Next comes the change in the net position of long-termowners (Long-Term Holder net position change). The value of this metric continues to grow. Long-term holders have added 127,760 BTC to their total position in the last 7 days. This offsets the sales of short-term holders who reduced their positions by a total of 122,423 BTC, resulting in a net difference of 5,337 BTC to the accumulation of long-term holders.
* Note: Part of the increase in long-term holder position is due to the aging of younger coins crossing the 155-day threshold.
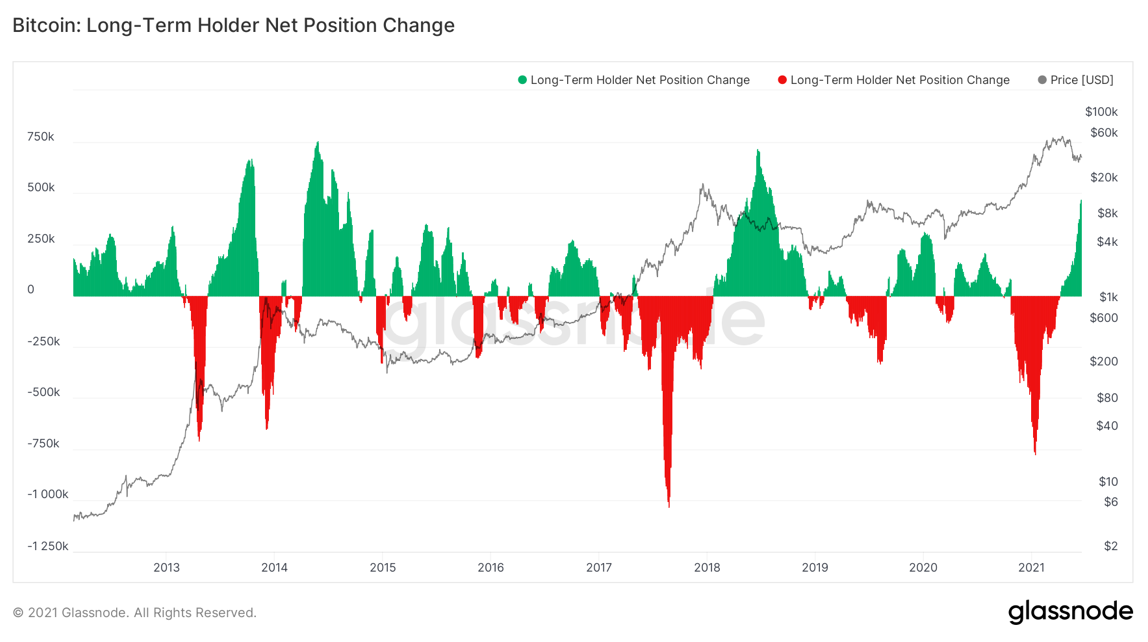
It is also worth noting that if you look atthe big picture, then this metric looked in a similar way during the bull rally in 2013, but also after the peaks of 2013 and 2017. The main takeaway here is this: when bitcoin is highly undervalued, experienced market participants begin to actively build up their positions.
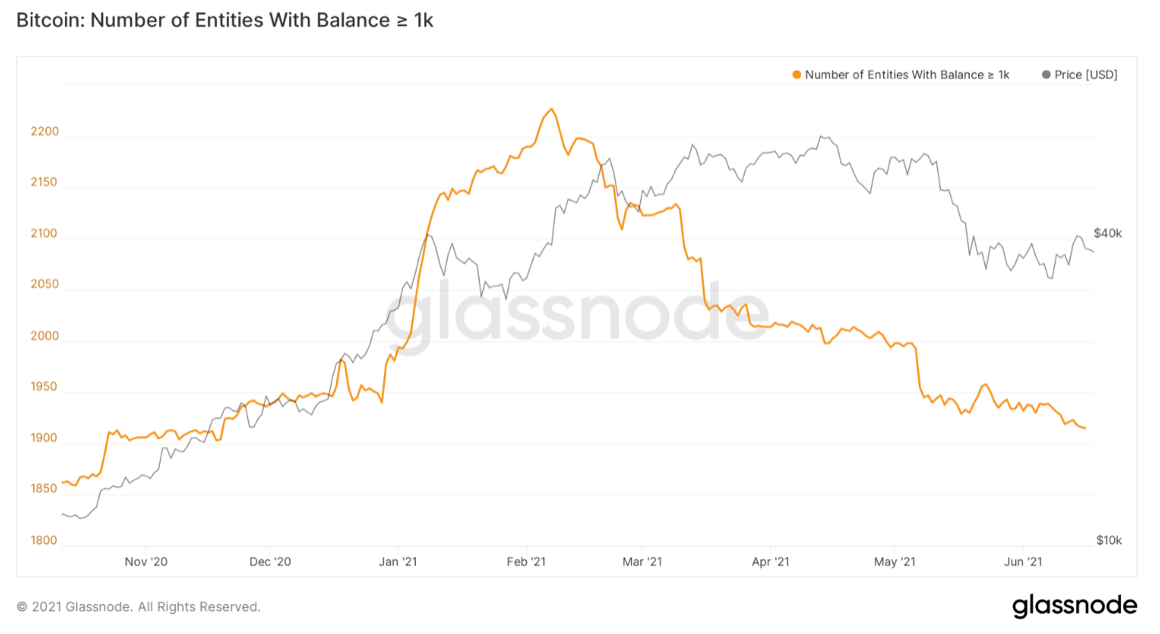
However, not all on-chain indicators look bullish.Another thing to look out for is the number of new whales coming to the bitcoin market. It continues to decline. Of course, I would like to see some kind of surge in this indicator, but this is also not the end of the world: for example, in the previous bullish macrocycle, whales began to sell out from the middle of the 2017 rally.
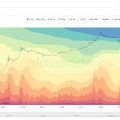
Finally, I would like to share this graph recently posted by Willy Woo. This is a variant of his "NVT signal" and shows that BTC is extremely oversold right now.
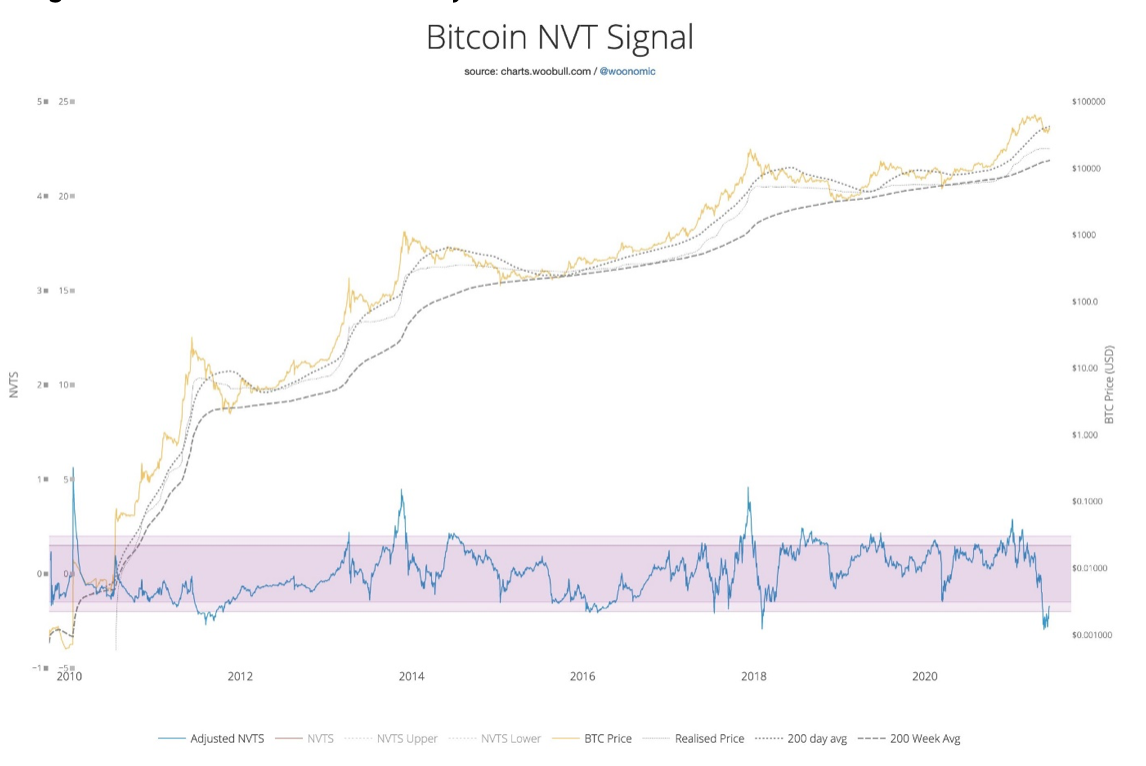
So, to summarize:according to on-chain metrics, bitcoin is heavily oversold, long-term holders continue to buy out BTC at a discount, accumulation continues to gain strength, but new institutional and / or wealthy buyers (whales) are still practically not entering the market. The next few weeks will be defining for Bitcoin in terms of a macro trend, but the current re-accumulation process still looks bullish in the medium term.
Based on this analysis, it was probably possiblewould expect continued sideways movement in the $35-$39K area over the next week, but the medium to long term setup is looking increasingly bullish. In the very short term, the $41-42k level serves as critical resistance. Have a nice week everyone!
The article does not contain investment recommendations,all the opinions expressed express exclusively the personal opinions of the author and the respondents. Any activity related to investing and trading in the markets carries risks. Make your own decisions responsibly and independently.
</p>
Read this:
 Buying on a decline: investors accumulate bitcoin ahead of halving
 Bitcoin: when is it best not to buy
 Tony Weiss: “I will buy bitcoin at around $ 6,400”
Peter Schiff: “After halving, no one will buy bitcoin”
Tony Weiss: “I will buy bitcoin at around $ 6,400”
Peter Schiff: “After halving, no one will buy bitcoin”
 On-chain data suggests selling pressure for BTC at $60k is easing.