
For almost three months now, the Bitcoin (BTC) chart has been drawing a characteristic technical analysis figure - a triangle. Nowthis figure is close to completion, and a major new movement is likely in the coming days. But where?
At the peak reached on June 26, the Bitcoin rateapproached $14,000—it hasn’t been this high since January 2018. But just 3 weeks later, on July 17, BTC was already “resting from the jump” just above $9,000. Since then, the first cryptocurrency has not gone beyond the boundaries of this range.
Long correction always gives rise to the marketuncertainty and anxiety, especially when it comes to volatile assets such as cryptocurrencies. Traders and analysts know that after a long consolidation of the price at about one level (and now Bitcoin has been dancing around $ 10,000 for a long time), the price makes a big breakthrough, covering a distance comparable to the width of the consolidation.
Triangle is one of the most classic"Corrective" figures. Thus, after exiting the existing triangle, bitcoin can either return to historical highs or collapse to the levels of the beginning of “cryptocurrency”.
</p>But any market consists of real traders withreal money, and behind each figure on the chart there is a change of mood of large groups of people with large capitals. And all price movements are generated by events in the real world, even if they become known later than the movement itself.
News background
What economic, social and political factors today may be decisive for the movement of bitcoin up or down?
Many people associate the “Crypto Spring” of 2019 withdevelopment of corporate social network cryptocurrencies - TON (which recently launched a test network) and Libra. But in reality, the development of these projects is unlikely to have a positive impact on Bitcoin and other independent cryptocurrencies: social network tokens are centralized, dependent on parent corporations and regulators. And at the same time, they are very loosely connected to public blockchains. Rather, their successful launch will take away some of the audience and money from Bitcoin: many investors may prefer regulated tokens. But these projects are already facing active opposition.
On the other hand, institutional investors are allstill interested in the cryptocurrency market. This is evidenced by the ongoing efforts to bring to market cryptocurrency ETFs (regulated single-asset mutual funds traded on stock exchanges), the growing volumes of Bitcoin futures trading on the CME, and the creation of new platforms for trading already-deliverable futures.
Perhaps it is the last factor that promises the mostpositive dynamics: after all, settlements under delivery contracts require the purchase of real bitcoins, and they will have to be taken either from the market or from large holders. One way or another, the demand for Bitcoin will increase. Yesterday, the first of these platforms, Bakkt, was launched. This is a significant information source for exiting the protracted consolidation.
Do not discount trade wars andgrowing political tensions, and signs of an impending recession in Europe, and perhaps a new wave of devaluation of fiat currencies. For Bitcoin, this will be another test for the status of a “protective asset”: has the cryptocurrency matured in order to compete with gold and other “shelters”?
The growth of mining capacity and demand forequipment, and the process of accumulating and concentrating bitcoins. A little over six months remains until the next halving of the reward for BTC miners. All these indirect factors also contribute to the future growth of Bitcoin.
What does the BTC chart mean?
Below are two Bitcoin charts for the pasta few months. The first one shows a daily chart with a triangle against the background of growth since December last year, called the “crypto spring”, on a logarithmic scale:

As can be seen in the graph, the main scenariosuggests continued growth, since against the backdrop of long-term movement the current correction looks quite modest. But markets are unpredictable, and alternative scenarios always exist, especially since bearish sentiment intensifies during a correction.
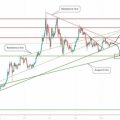
This same triangle is depicted in a larger close-up on a 12-hour chart:

For a “waver” this triangle can be consideredexemplary: the classic lines 0-B-D and A-C-(E) are followed and throughout the entire pattern there is a constant drop in trading volumes. Now the lines are getting closer to convergence, which means that the spring has tightened and the breakthrough is getting closer.
But also the “red” scenario, suggesting developmentcorrection, in the current structure looks no less convincing, especially since the top line has a steeper slope. This means that the forces of the “bulls” and “bears” are approximately equal, and the scenario of going up makes only a higher-level picture a priority.
Stock glasses are more full in the directionpurchases, but with a strong downward movement, many traders will cancel orders and may even open speculative sell positions. Consequently, the situation will remain tense at least until the “go-ahead” for bidding at Bakkt, which is expected tonight Moscow time.
Where will Bitcoin go tomorrow?
Nobody knows this, not even Satoshi Nakamoto. But the fact that another major movement is brewing, we can speak with confidence. The longer the lull, the stronger the storm. Today, her signs are visible more clearly.
</p>Read this:
 Copy-paste | The share of SegWit transactions in the Bitcoin network reached 50%
 Time to choose, Bitcoin.
 The S&P 500 index will become a catalyst for the growth of the Bitcoin rate
 Bitcoin is the most significant investment opportunity.
 Cryptocurrency Telegram Bot from the NiceChange.org bitcoin exchanger
 CME Group will launch options based on bitcoin futures