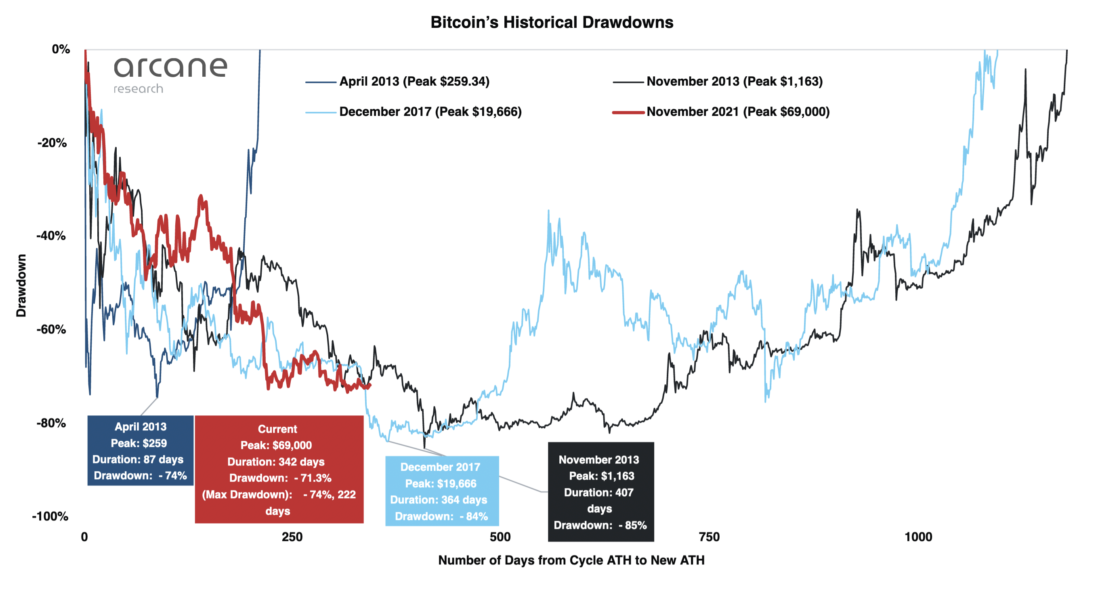
It's been 349 days since the all-time high in the price of BTC, which has fallen sinceby 70% of peak values, with a maximum oftoday the drawdown depth is 74%. And most on-chain indicators signal that the bottom has already been found.
While history is unlikely to repeat itself, twoPrevious major BTC bear markets may provide some insight into the relative duration of the current one. In the bear market of 2018, the maximum depth of the exchange rate drawdown from the peak was 84% in 364 days. In 2014, the bearish trend lasted longer, finding a bottom after 407 days. In both cases, bottom formation was accompanied by unusually low volatility.
Almost all on-chain indicators todayare at levels seen only at the bottom of previous bearish macrotrends, and it seems far from certain that the BTC rate will drop lower, despite the difficult macroeconomic background. In both previous protracted bear markets, after bottoming out, we saw a horizontal movement with abnormally low volatility for several months, similar to how BTC has been behaving since June. Bitcoin has been trading in a tight range for 127 days from its June low. The low volatility bottom range of 2018 lasted 130 days, in 2014 it was 280.
Most on-chain indicators signal that a bottom has been found
Although we are somewhat skeptical about the adoptioninvestment decisions based only on on-chain data, it should be noted that more or less all on-chain indicators are at or near all-time lows, and we do not deliberately choose the most suitable charts.
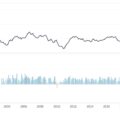
Puell coefficient
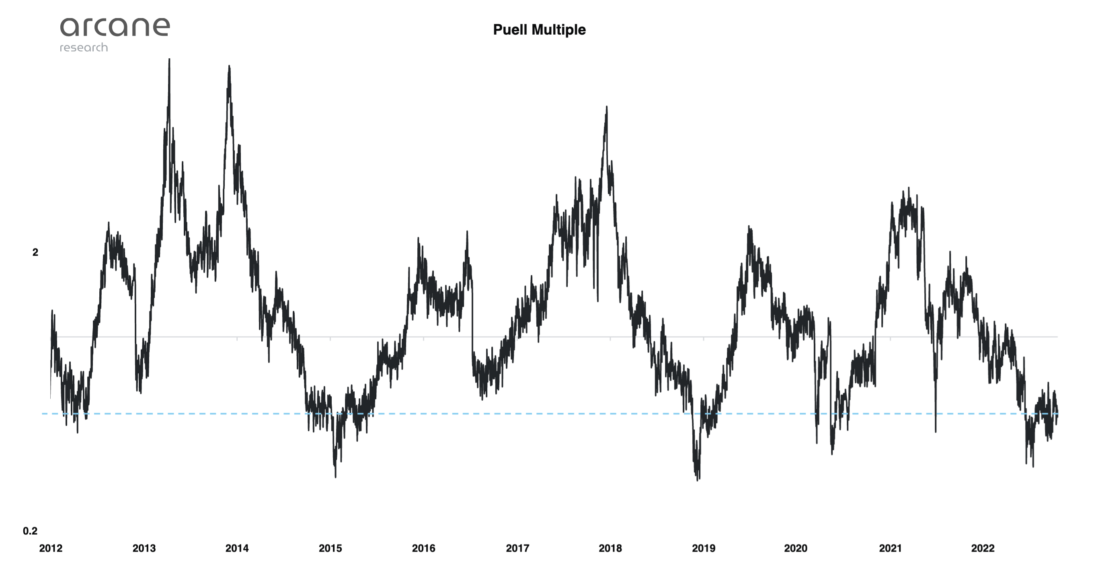
On the thirteenth of July, Puell's ratio reachedlows not seen since December 16, 2018. This metric is calculated by dividing the value of BTC issued daily by the 365-day moving average of that metric.
All previous instances of the Puell ratio reaching similar lows have been at the bottom of bear markets.
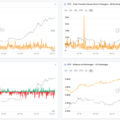
Realized HODL
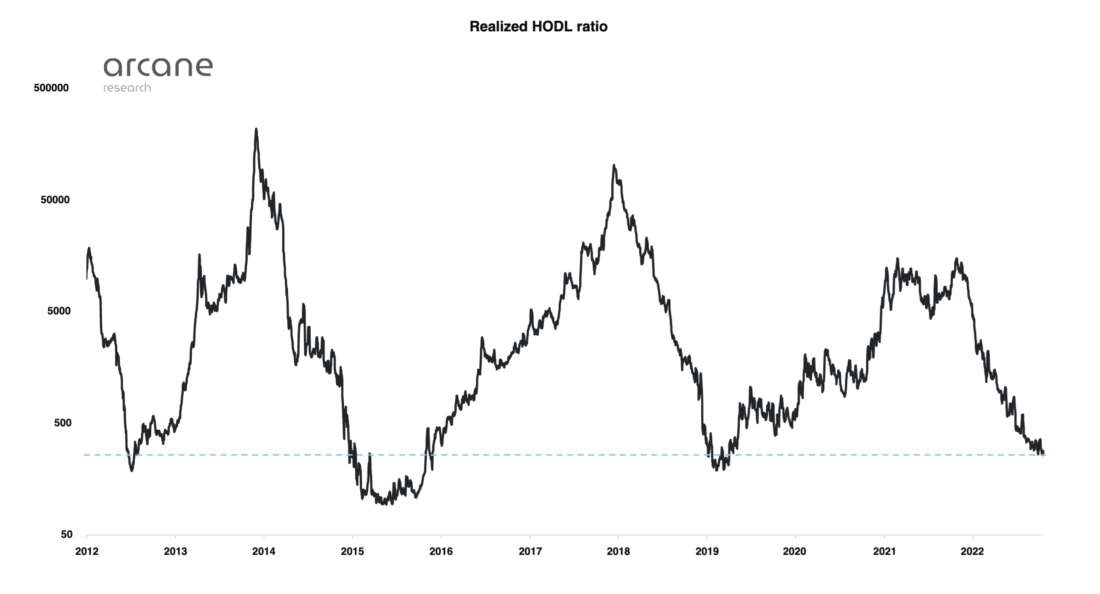
Realized HODL ratio tracks patternsBTC hodling in terms of coin age and economic weight. Low values occur when the value of coins moved on-chain in the last week is compared to the value of coins moved in the last 1-2 years.
The RHODL ratio is now at the same levels as when the market hit the bottom in 2019.
Reserve risk
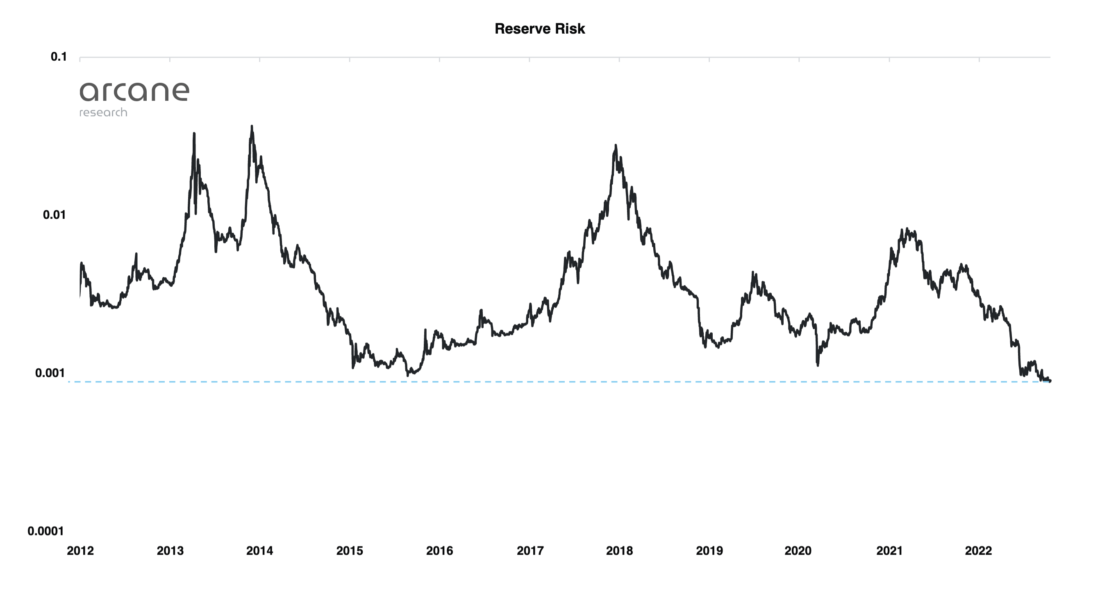
This indicator tracks behavior patternslong term holders. Low values indicate that the number of coins in the wallets of long-term holders is increasing despite the decrease in price. As the price decreases, the incentive to sell for long-term owners normally decreases.
At the moment, Reserve Risk is atan all-time low, indicating a low level of sales from long-term coin holders. But, one way or another, the key weakness of this indicator is related to the obvious financialization of BTC. Supply flows and dynamics in BTC-based structured products, cash, stablecoin-collateralized derivatives and ETFs negatively impact the interpretation of on-chain metrics based on coin age.
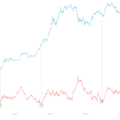
MVRV
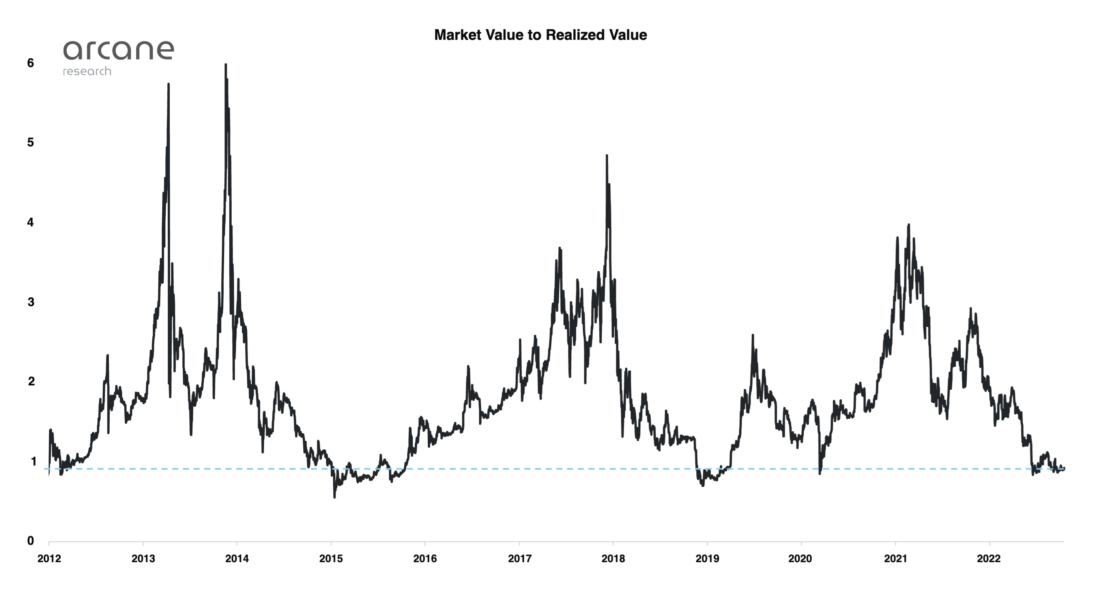
MVRV coefficient (stands for«Market Value to Realized Value») tracks the ratio of the market value of the circulating supply of coins to the realized one. Realized capitalization (the total realized value of all coins) is calculated by multiplying the denomination of each UTXO by the price at which it last moved on-chain.
Now the MVRV value is below 1, which means thatthe realized capitalization of bitcoin is higher than the market capitalization. Previous periods in which the MVRV value fell below 1 coincided with the lows of the last two bearish trends.
MVRV-z
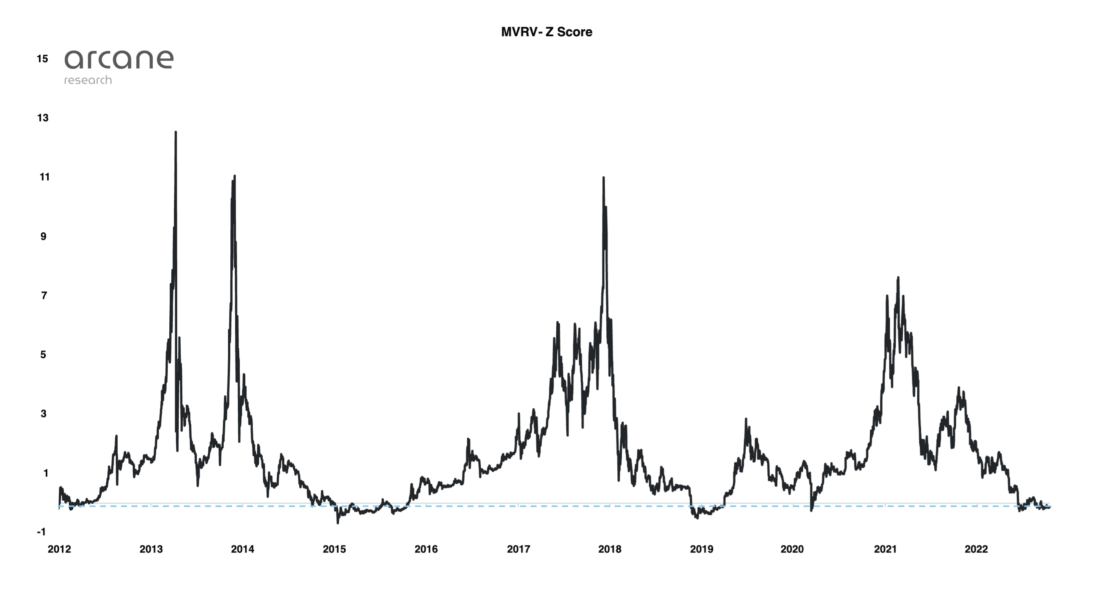
The MVRV Z-score is used to evaluate whetherwhen Bitcoin is «undervalued» regarding his «fair» cost. When market value is significantly lower than realized value, historically this has indicated that market lows have been reached. The MVRV-z coefficient is in the range coinciding with the minimums of 2015 and 2019.
Most other on-chain metrics are alsoat or near all-time lows – at levels coinciding with the price lows of previous bearish macrotrends – despite the fact that the drawdown in BTC price was less intense (-74%) compared to the previous two relevant examples (-84% and -85 %).
Summarizing
On-chain metrics have obvious disadvantages, notconsidering the changing structure of the bitcoin market and completely ignoring external factors that affect investor confidence, such as dire macroeconomic conditions.
However, the fact that all keyOn-chain metrics are at their lows, suggesting that from the point of view of the BTC market evaluation system by its internal indicators, the current price levels represent a very attractive entry point for long-term investors.
BitNews disclaim responsibility for anyinvestment recommendations that may be contained in this article. All the opinions expressed express exclusively the personal opinions of the author and the respondents. Any actions related to investments and trading on crypto markets involve the risk of losing the invested funds. Based on the data provided, you make investment decisions in a balanced, responsible manner and at your own risk.
</p>
Read this:
 On-chain market cycle indicators
 Analysis of onchaine metrics tells about the increase in the price of BTC by 10 times
 Can on-chain indicators predict highs and lows?
 Volatility Returns: Where Will Bitcoin's Bottom Be Found?
 Exchange on-chain metrics: good, bad, evil
 Demand Survey | on-chain forecast