In previous reviews, we have highlighted the importance and trends of major cyclical on-chain indicators, such asas RHODL coefficient, MVRV-z, reserve risk,Dormancy Flow ratio, 90-day CDD and the ratio between short-term and long-term holders. Today's analysis covers these metrics together, including the Mayer Multiple.
These figures are by no meansideal for predicting the market in the short term, but they provide valuable insight into when the market may be in a long-term or cyclical turning point. We prefer to use these metrics in combination to gain insight into long-term signals and changing market behavior.
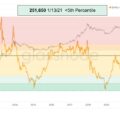
One way to do this is to look at thesetop on-chain metrics through their historical percentile distributions over different time periods. For example, when a metric is at or above its 95th percentile, it can signal a unique overheating period in the market. This is true when the metrics are at or above the lower percentile thresholds, which could signal a period of market overcooling.
To understand the percentile data forFor each metric, we separate the percentiles into five different groups and colors ranging from dark green to green, yellow, orange, and red. Lower percentiles correspond to green, while higher percentiles correspond to orange and red.
Common criteria for percentiles and colors afterconsiderations of approximately 20 on-chain macro indicators are displayed below. However, we subjectively adjust each percentage threshold based on historical performance, so not everyone will follow this pattern exactly.

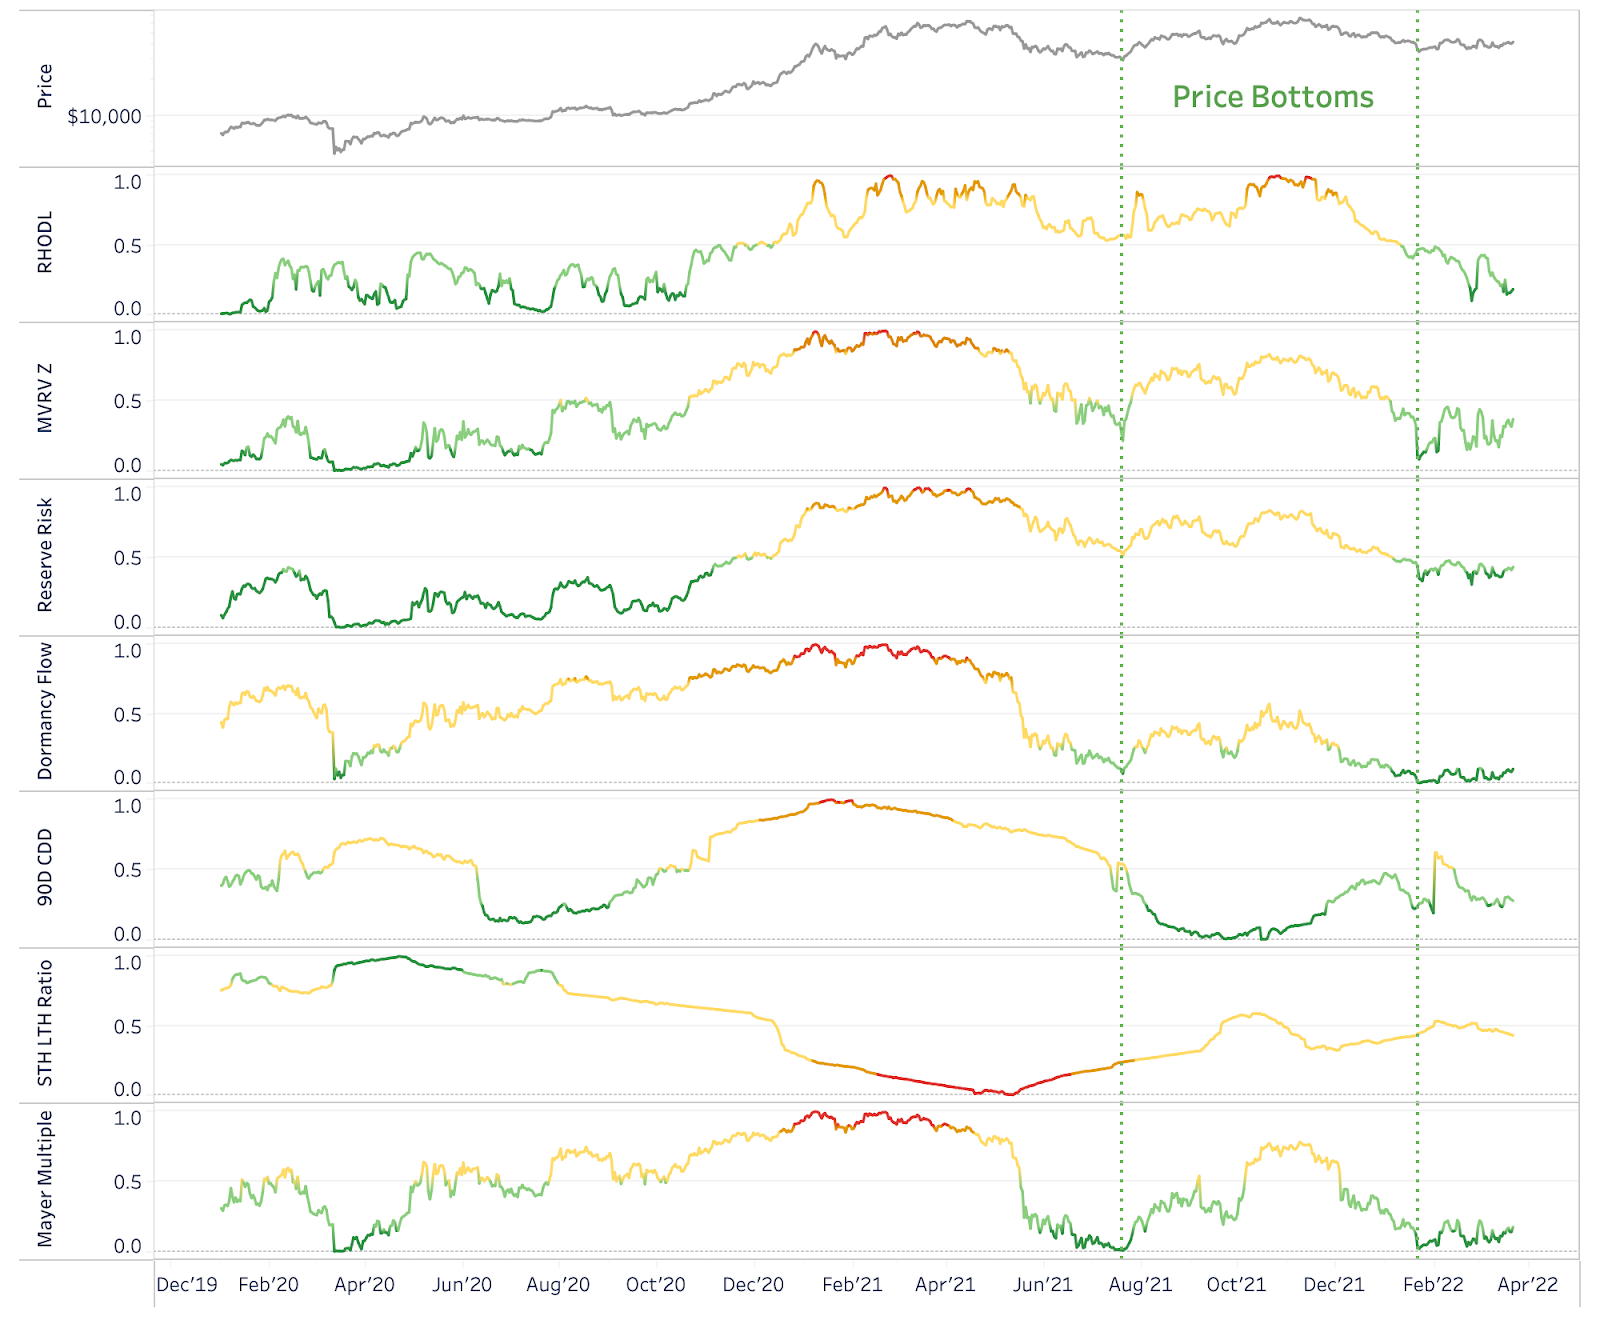
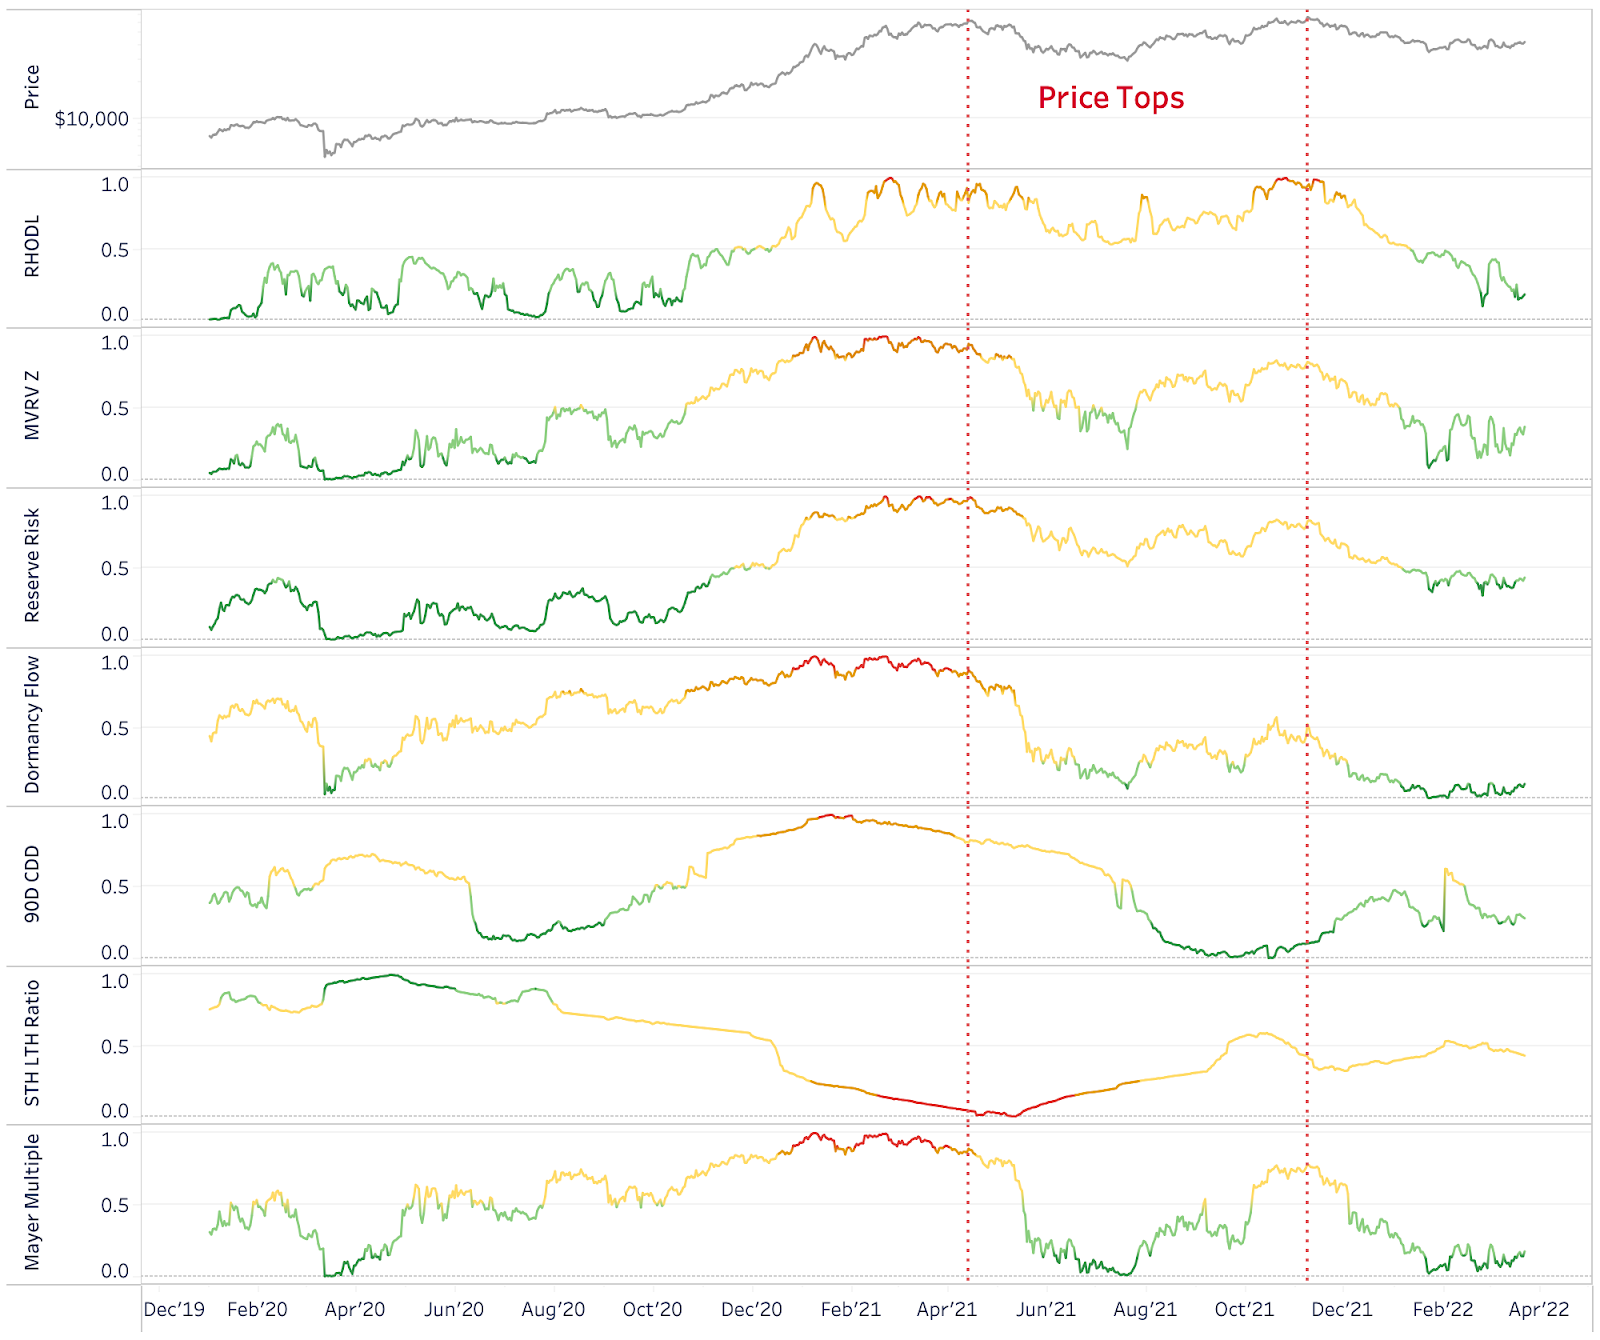
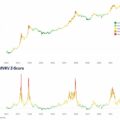
Doing it this way gives a summary overviewindicators during previous price lows and highs. Below you can see how some of the best on-chain indicators made the bottom of March 2020 and the top of April 2021.
In March 2020, all indicators exceptThe 90-day CDDs were at incredibly low percentiles. January 2022 is showing a similar trend, signaling that we may have hit the recent low around $35K already.
Retrospective testing of on-chain indicators
As for the April 2021 top, every indicator in this analysis showed signs of overheating just before or during the price peak.
Retrospective testing of on-chain indicators
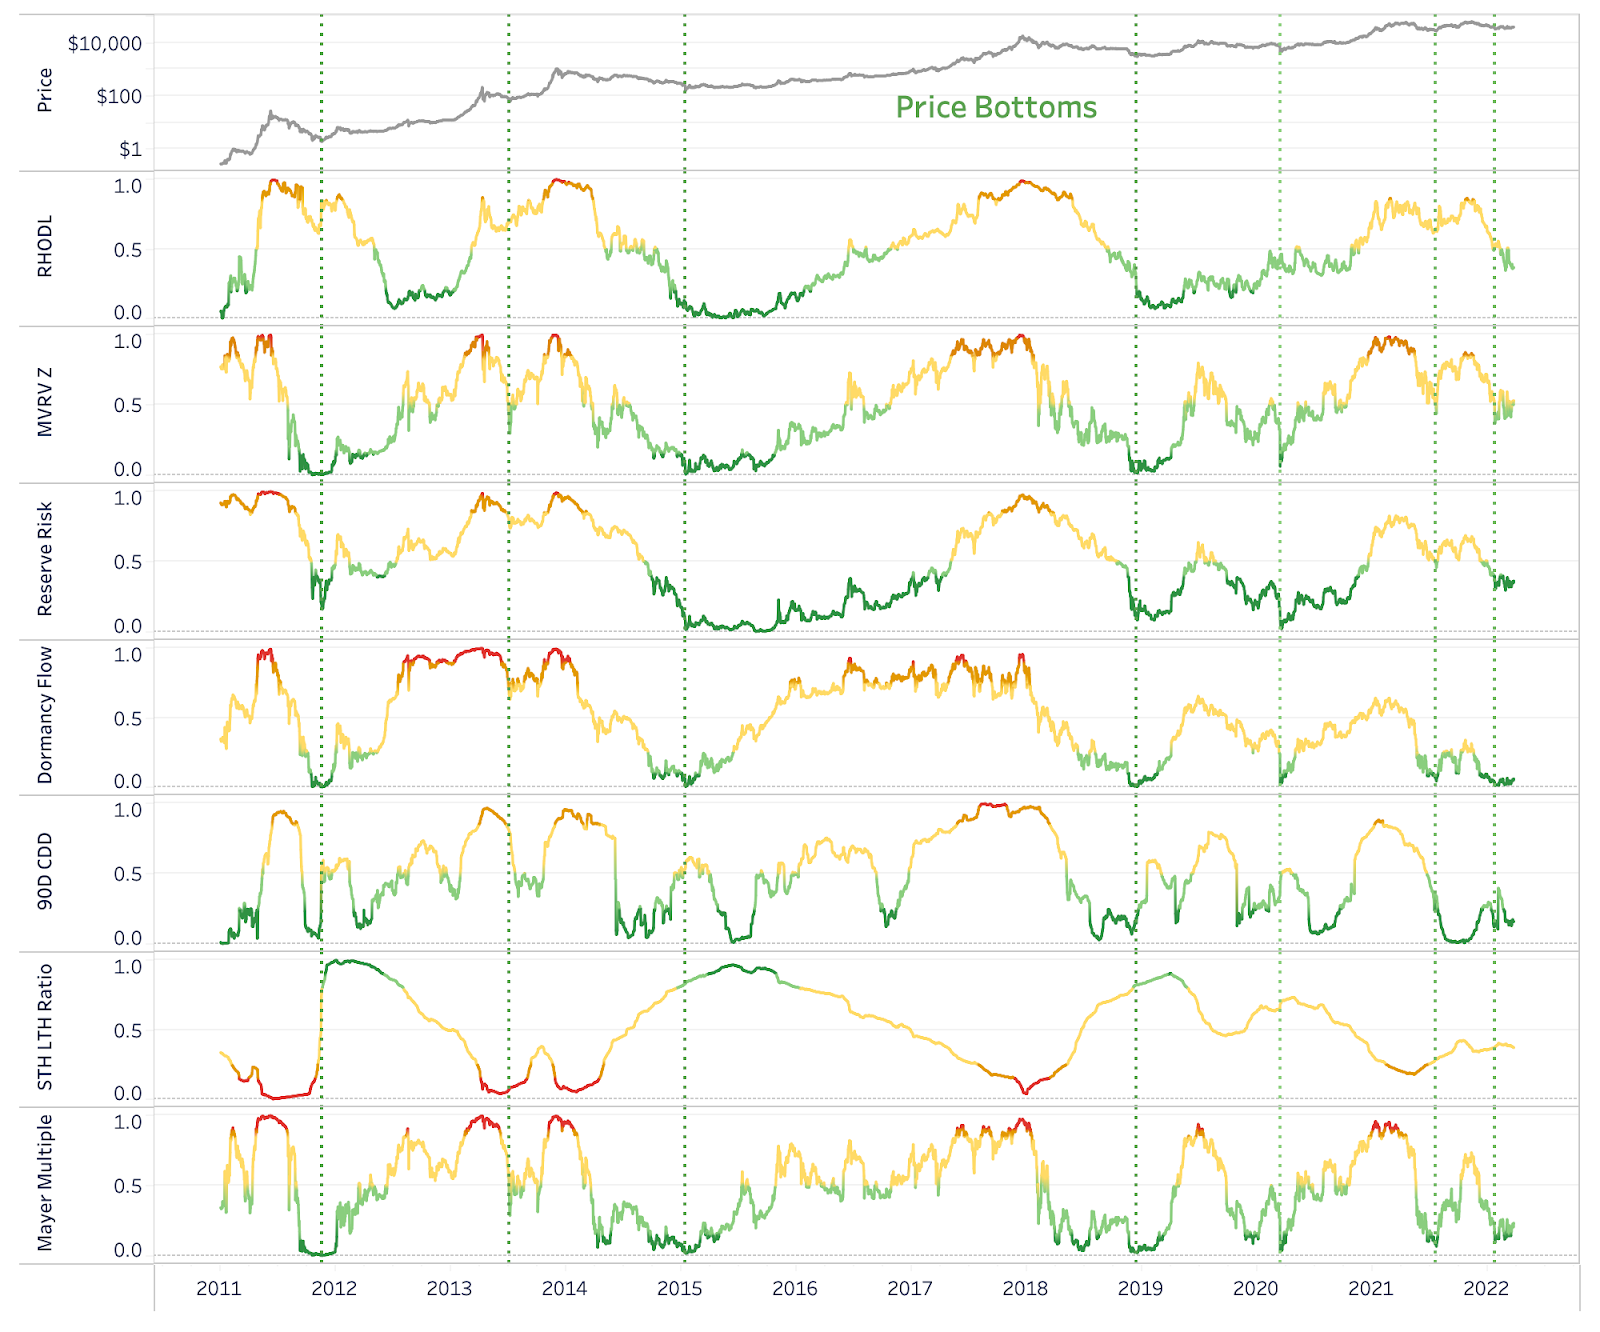
The caveat here is thatAs bitcoin matures and volatility declines, comparing full-history on-chain indicators may not provide the best results in terms of their future predictive power. If we continue to see fewer sharp jumps in prices, this will also be reflected in many indicators. The two charts above use data and percentiles starting in 2020 to show a more recent vision. So what does the full historical look of 2011 look like?
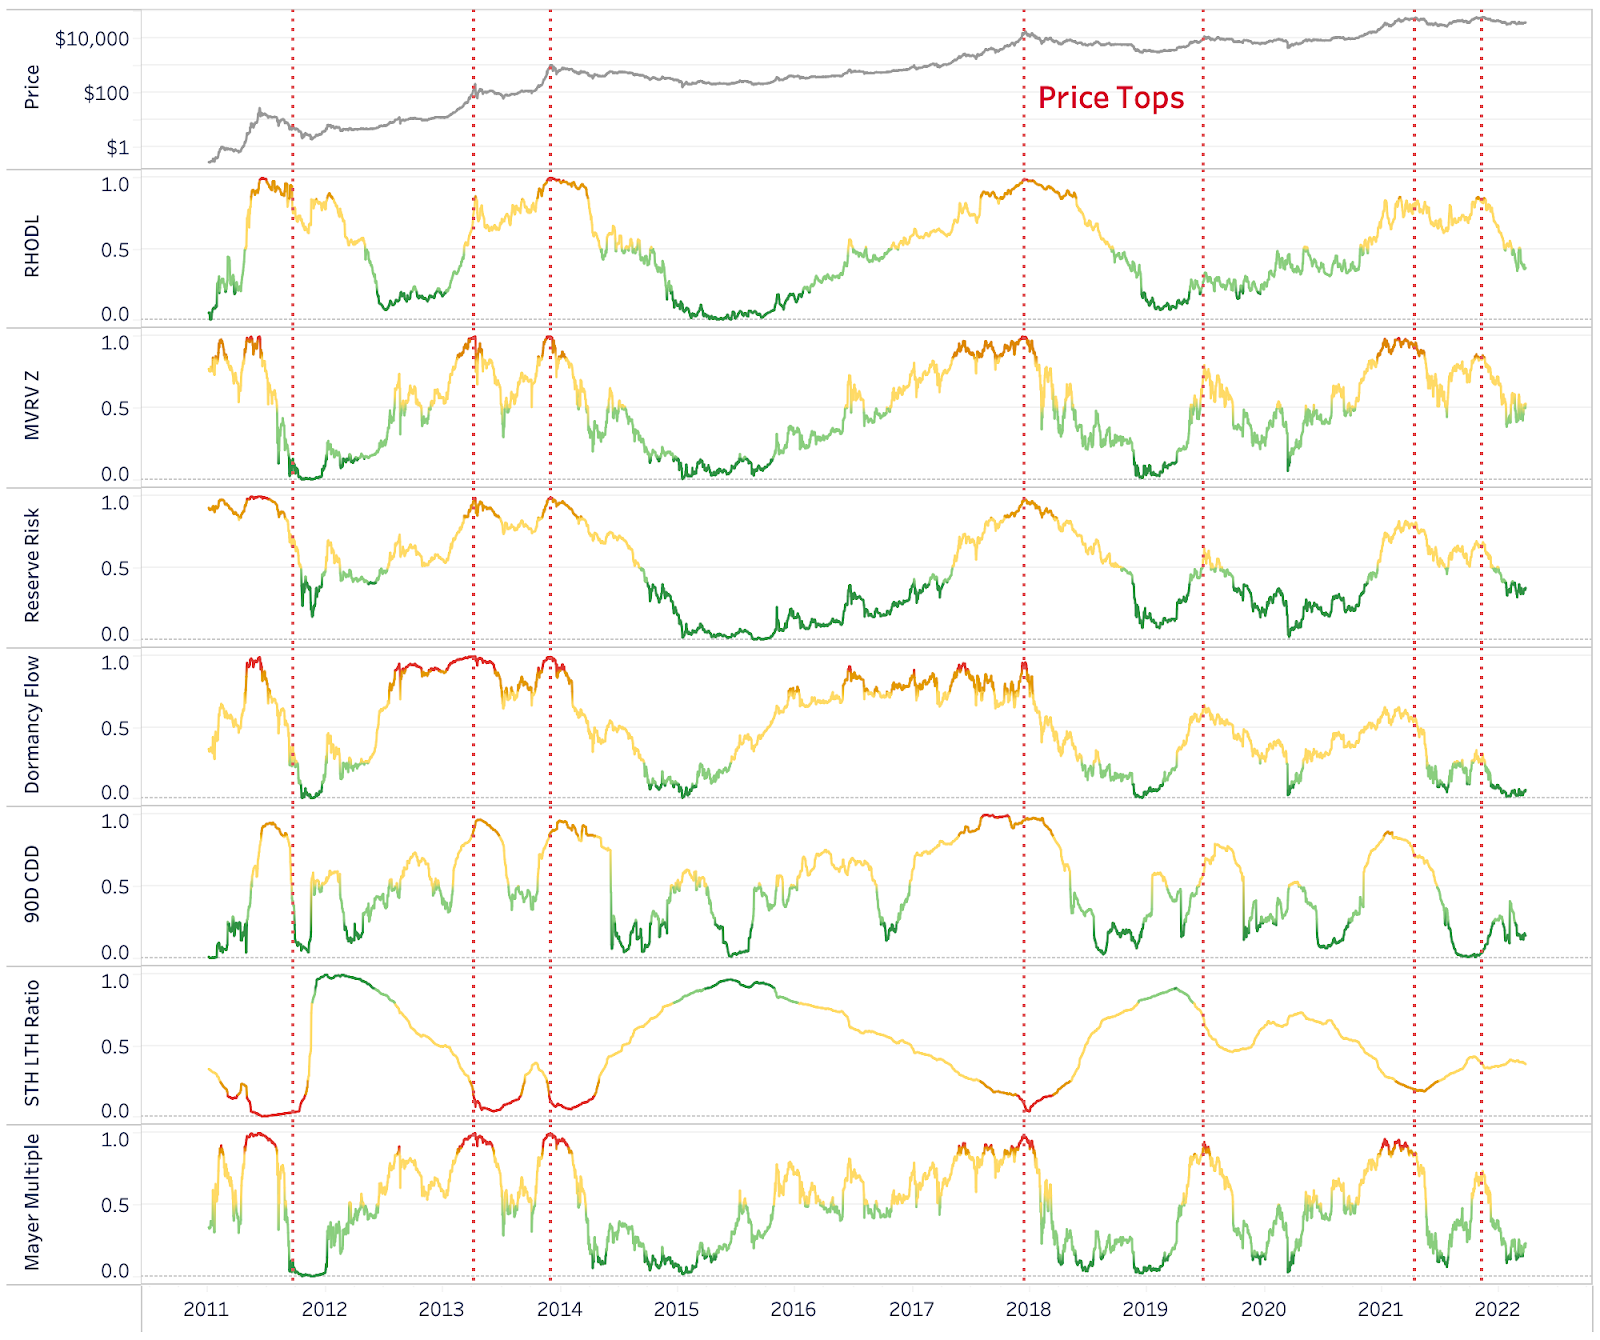
The key takeaway from the vision below2011 is that more percentiles are displayed with a lower threshold because there is a much wider range of data that falls into this category (0%-20%). On the other hand, using historical data from 2011 did not signal the top of April 2021 very well, as half of these metrics never reached their 98th percentile, while the price never had a “bulk” like previous cycles. .
Retrospective testing of on-chain indicators
Retrospective testing of on-chain indicators
Concluding observations
There are key on-chain indicators that arevaluable for determining long-term cycle highs and lows. However, as bitcoin matures and changes, so does the analytical predictive power of these metrics.
More than ever, it is important to understand these metrics inin the context of current market conditions in a growing derivatives market, the implications of growing institutional adoption and an unprecedented period of macroeconomic uncertainty.
BitNews disclaim responsibility for anyinvestment recommendations that may be contained in this article. All the opinions expressed express exclusively the personal opinions of the author and the respondents. Any actions related to investments and trading on crypto markets involve the risk of losing the invested funds. Based on the data provided, you make investment decisions in a balanced, responsible manner and at your own risk.
</p>
Read this:
 On-chain market cycle indicators
 Important on-chain indicators in the buy signal zone
 New highs thanks to the launch of ETF BITO - On-chain pulse from October 26, 2021
 Forex Academy. Lesson 15 Determine local price lows and highs on the chart
 Report: on-chain activity of bitcoin increased by 21% in May
 Analysis of onchaine metrics tells about the increase in the price of BTC by 10 times