06/23/2020
Guest Materials


Disclaimer
Predictionsfinancial markets are private opinion theirauthors. Current analysis is not a guide to trade. ForkLog is not responsible for the results of work that may arise when using trading recommendations from the submitted reviews.
Practicing trader and founder of the Crypto Mentors project Nikita Semov talks about the current market situation.
Previous analytics worked almost perfectly: last week's bar closed in sales, the price was sideways for almost the entire week, however, in the middle of the week there were additional factors that changed the priority way out of balance from short to long.
Binary analysis (weekly timeframe)

A declining spread indicates nosellers willing to put pressure on the price. Combined with a decreasing volume, this indicates bearish weakness in the previous week. At the same time, there is a solid tail of purchases, which indicates the willingness of buyers to resume long-term movement.
Japanese candles speak, rather, of market uncertainty, as the “black top candle” pattern was formed. This setup indicates price uncertainty and respite.
Expectation: closing of the bar of the current week up (bar / candle of purchases). The bar of June 23 is likely to be closed in sales.
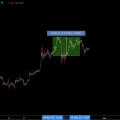
Price Action and VSA

On the daily chart in the range of $ 8900- $ 9400formed the level of purchases. The range, albeit wide, is concentrated with serious purchases. The price will not go below this volume level. There is also the classic “preload” pattern, which indicates the dominance of bulls in the medium term and the intention to push the price higher.
According to VSA, information is similarly confirmed by a number of formations: JOC + BTC level of $ 9561, as well as the formation of the so-called cascade of control levels.
Expectation: we are waiting for a pullback to about $ 9562, and from there we start higher: the potential of the move is at least up to $ 10,000.
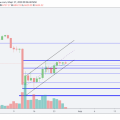
Horizontal Volume Profile

Yesterday we overcame POC of the current month ($ 9500) andwe can say that they have successfully consolidated above. We are in the Value Area June ($ 9270- $ 9740), which may cause a small rollback before leaving VA and the beginning of a new phase of the pulse.
An important factor in favor of shopping isvolume distribution last week. The maximum level is located below the range, which indicates pressure from buyers, given that the price at $ 9300 was not such a long time
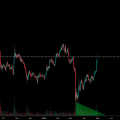
Delta

The breakout bar delta has a solid but notan abnormal advantage on purchases, which indicates the truth of the breakdown. It is also worth noting that the most volatile bars after exiting the accumulation are also supported by the rising delta, which is a positive sign for going to $ 10,000
Cluster analysis
The density of anomalous clusters formed inbetween $9520 and $9545, this is where the retest came, followed by good volume protection. At this stage, the only thing that separates us from $10,000 — This volume value is $9750. After passing it, there are no special barriers to growth.
Summing up, it is worth emphasizing that the “goldentime for shorts is over. Now is the time to look at long positions, but expecting an ace from the current levels would be careless and unprofessional.
Read this:
 Trader spoke about the alarm for the price of bitcoin in the futures market
 Trader named the reason for the growth of bitcoin and told what to expect
 Trader told what to expect from the price of bitcoin
 The trader spoke about the medium-term prospects for the price of bitcoin
 A trader spoke about scenarios for the price of bitcoin after an attempt to storm $ 10,000
 The trader spoke about the factors in favor of a further drop in the price of bitcoin