After failing to break through the $11,000 resistance, the price of Bitcoin seems ready to go into a correction and,it may still be possible to fill the gap in CME futures just below $ 10,000 if the $ 10,200 support does not work out properly.
Last week, the BTC price showedsome strength, rising from $ 10,000 to $ 11,200. However, the overall consensus of the crypto market is clear evidence of weakness, with double-digit selloffs for many smaller cryptocurrencies.
This sell-off only intensified after the $ 11,200 level was confirmed as resistance last weekend.
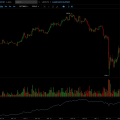
Unsuccessful breakout of $ 11,200 leads to a sharp drop


1-day BTC/USD chart. :TradingView.
In the previous analysis, I marked the $ 11 range.000– $ 11,200 as a significant resistance level, which may not be easy to overcome. The significance of this resistance is further enhanced by the fact that before that it acted as a support during price consolidation.
In order for the market to develop the received upward momentum, this zone must be turned back into support, thereby opening the way for a $ 12,000 retest.
However, the rollback that has occurred means that the BTC price has established a lower local maximum, which signals a high probability of a correction period.
All markets in the red zone except DXY
While commodity, equity and cryptocurrency markets were falling, the US dollar currency index (DXY), by contrast, showed strength.


DXY Index, 1-day chart. :TradingView.
Around the world, there are growing concerns aboutresumption of restrictive measures due to the increase in the incidence of COVID-19. In times of uncertainty, investors seek safe havens, making the US dollar the preferred fiat currency for preserving the value of capital.
During the crises of 2000 and 2008, and even the recent market crash in March this year, the dollar was perceived by most investors as the strongest asset.
The chart above clearly shows the change in support toresistance at 92.75 points, after which the bullish divergence was confirmed. Here it looks quite likely that the given impulse will continue to 95 points, unless it encounters significant resistance in the range of 93.50–94 points. If this range is not taken and then the DXY does not hold the support area around 92.75 points, then the downtrend may continue.
If DXY continues to show strength, this will spell trouble for the commodity and crypto asset markets. The reverse is also true if the DXY shows signs of weakness.
The total capitalization of the crypto market on the way to support in the zone of $ 250-275 billion


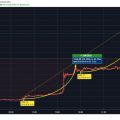
Total capitalization of the crypto market, 1-week chart. :TradingView.
The total capitalization of the crypto market is stillis in a consolidation phase and undergoing a correction after the previous impulse wave. This means that the most important area of support will be the 100-week and 200-week moving average (MA) levels, signaling the continuation of the bullish and bearish cycles.
It is worth noting, however, that after the breakout the previous level of resistance and consolidation in the area of $250–275 billion has not yet been tested.
In this regard, the area indicated on the graphBetween $250 billion and $275 billion, there is a high probability of higher (relative to the MA) support, which is likely to be tested.
What is the prediction for Bitcoin price?


BTC/USDT, 2-hour chart. :TradingView.
The two-hour chart clearly shows a pullback from the $ 11.100– $ 11.300 area - fears about the low probability of a breakout of this resistance were confirmed.
But what developments can be expected aftersuch a strong fall? The $10,200-$10,325 area represents a support zone on lower timeframes, and technical indicators indicate that a rebound could be expected here.
The key resistance level that shouldto be tested and taken for the continuation of the bullish trend is the area of $10,700–$10,750. However, a successful breakthrough on the first try seems unlikely.
If an attempt to break through this level fails orif the support at $10,200 does not work out, investors’ attention will switch to the so far untested zone around $9,500–$9,700 – an important level corresponding to the price gap in CME futures trading.
The article does not contain investment recommendations,all opinions expressed are solely the personal opinion of the author. Any activity related to investing and trading in the markets carries risks. Make your own decisions responsibly and independently.
�
</p>Read this:
 Breakthrough attempt
 Activity on crypto exchanges increased by 70% after Bitcoin broke above $ 10K.
 Bitcoin rate jumped 29% per night
 After pullback and consolidation, BTC will resume its bullish rally
 The instability of the global economy increases the value of bitcoin
 Auto-tuning ASIC miners increases productivity by 30%