Correction inside the bearish trend or a reversal to the bullish? The moment of truth.
Slowly breaking through the resistancelocal minima of the previous swing,buyers continue to gradually eat through this level. Now that the bear stop loss is so close, the situation could potentially lead to a chain reaction / cascade of eliminations and the final washing out of the bears. Due to the height and significance of the current market structure, this territory should be considered a zone of increased risk - a surge of volatility can be expected here, and, possibly, in both directions at once.
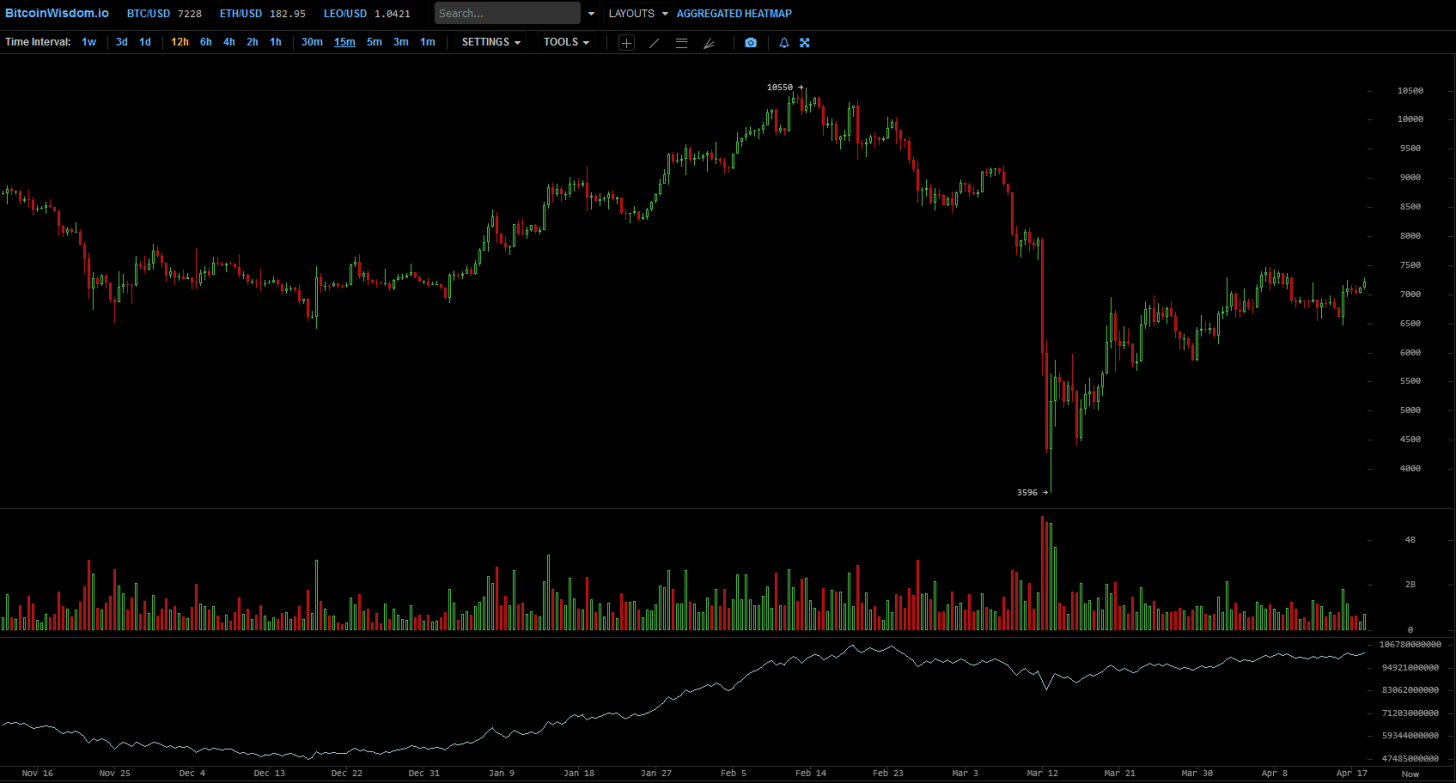
Outwardly, it still looks like an upward correctioninside a larger downtrend - a retest of the lows of the previous swing on the left side of the chart. This supposedly corrective movement is not accompanied by significant trading volumes, although one cannot fail to note the persistence with which the purchase side pushes the price up. If we proceed from the fact that the downtrend is still in force, then, obviously, we should expect a breakdown in the structure of this corrective movement and the continuation of the downtrend. However, this has not yet happened, and at this point it is already worth doubting whether such a scrapping will occur at all. It is interesting to note that the carrying amount is almost equal to what was observed at the February peak at $ 10,500. This means that bitcoin has accumulated at lower levels, i.e. implies a bullish signal.
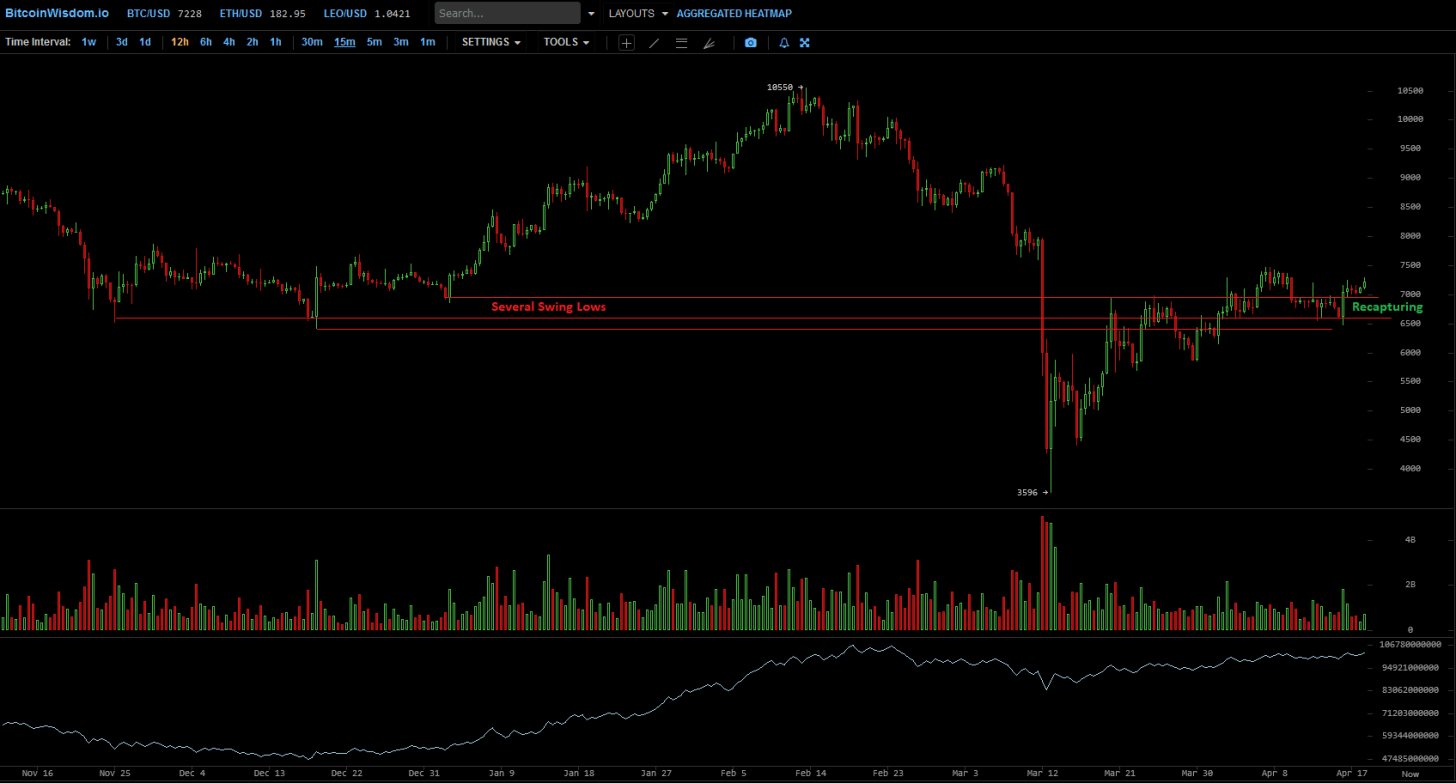
The graph shows that we not only testedthe resistance of the lows of the previous swing, but also actually perceptibly eaten them, and now the market is trying to turn this resistance in support. This is what is happening now, and only time will tell whether this process will be successful and whether a strong upward break will follow, fueled by newfound confidence, or whether we will not hold these levels again and the price will continue to fall after a failed breakthrough.
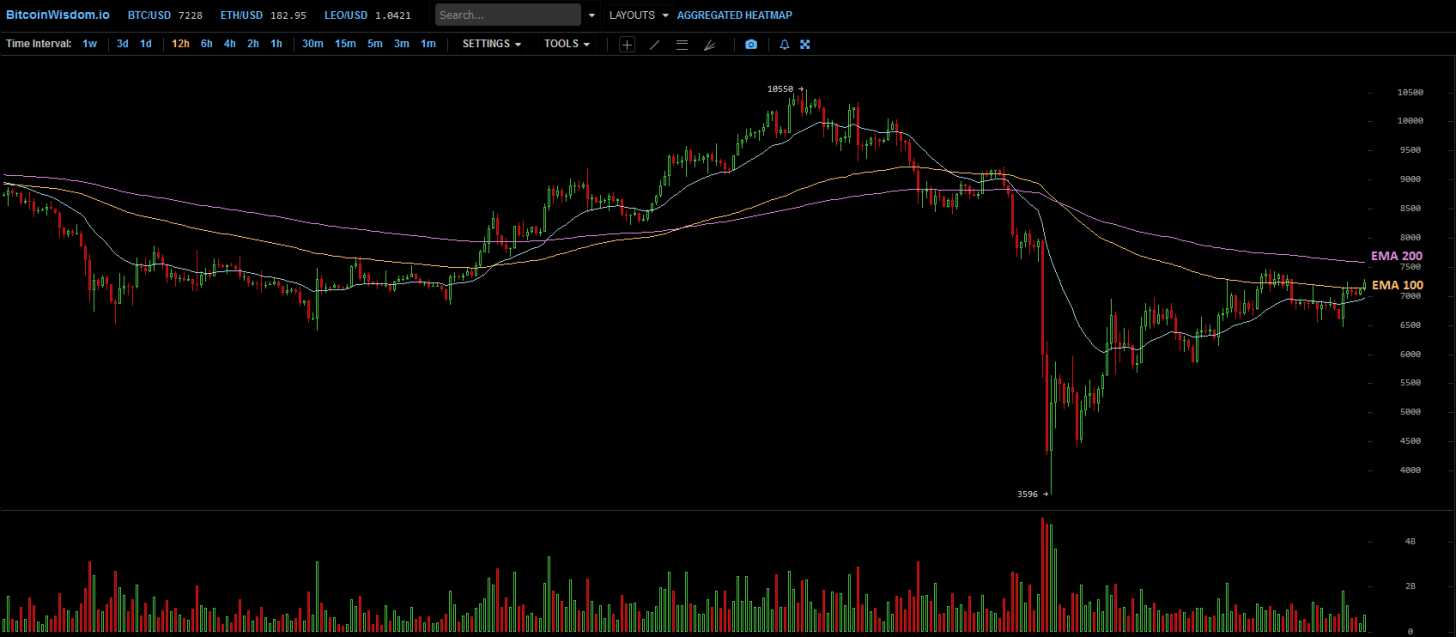
You must understand that this is not the last importantresistance level - right above us there is still a zone between EMA 100 and 200 on the 12-hour chart, which at the moment continues to indicate a bearish trend, crossing down due to a strong drop a few weeks ago. In a healthy downtrend, this zone at the supposed top of the correctional movement is used to open new or increase the size of existing short positions in anticipation of an imminent fall in price IF the trend remains in force.
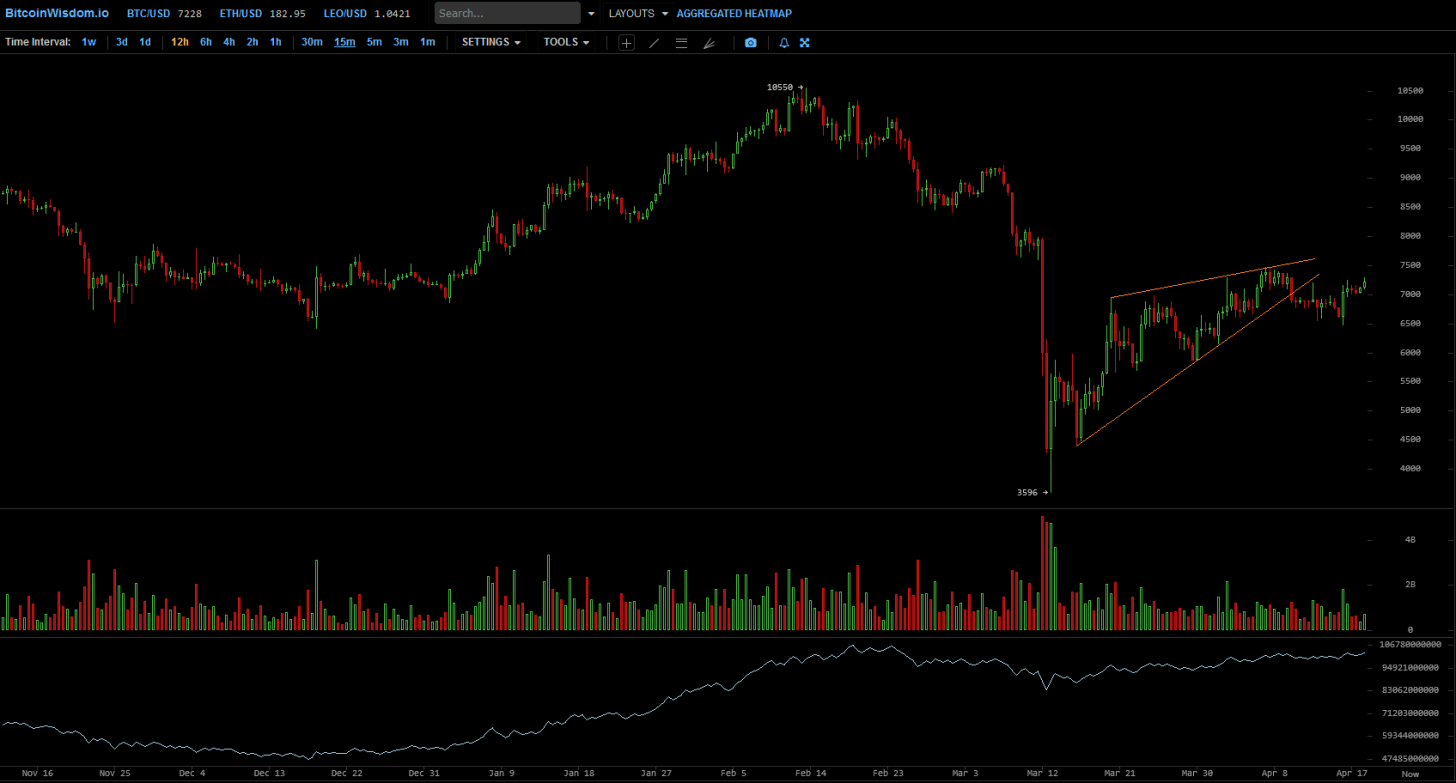
The growing wedge formed by this correction is alreadymade its way down, however this movement was quickly bought out. This means that the shorts have already entered the market, expecting a fall, and their stops are slightly above the recent high at $ 7475.
Taking this maximum can lead to massivethe closure of shorts, which automatically implies the volume on the buy side, resulting in a strong rally, especially since buyers have already eaten up the resistance of the lows of the previous swing. Simply put, taking a maximum of $ 7475 would mean invalidating the pattern of the rising wedge, knocking the bears out of their positions, and giving the market a very bullish signal. Bears can also be very tempted to change direction, according to the experience of recent days and weeks, not being so confident in the prospect of another downward movement.
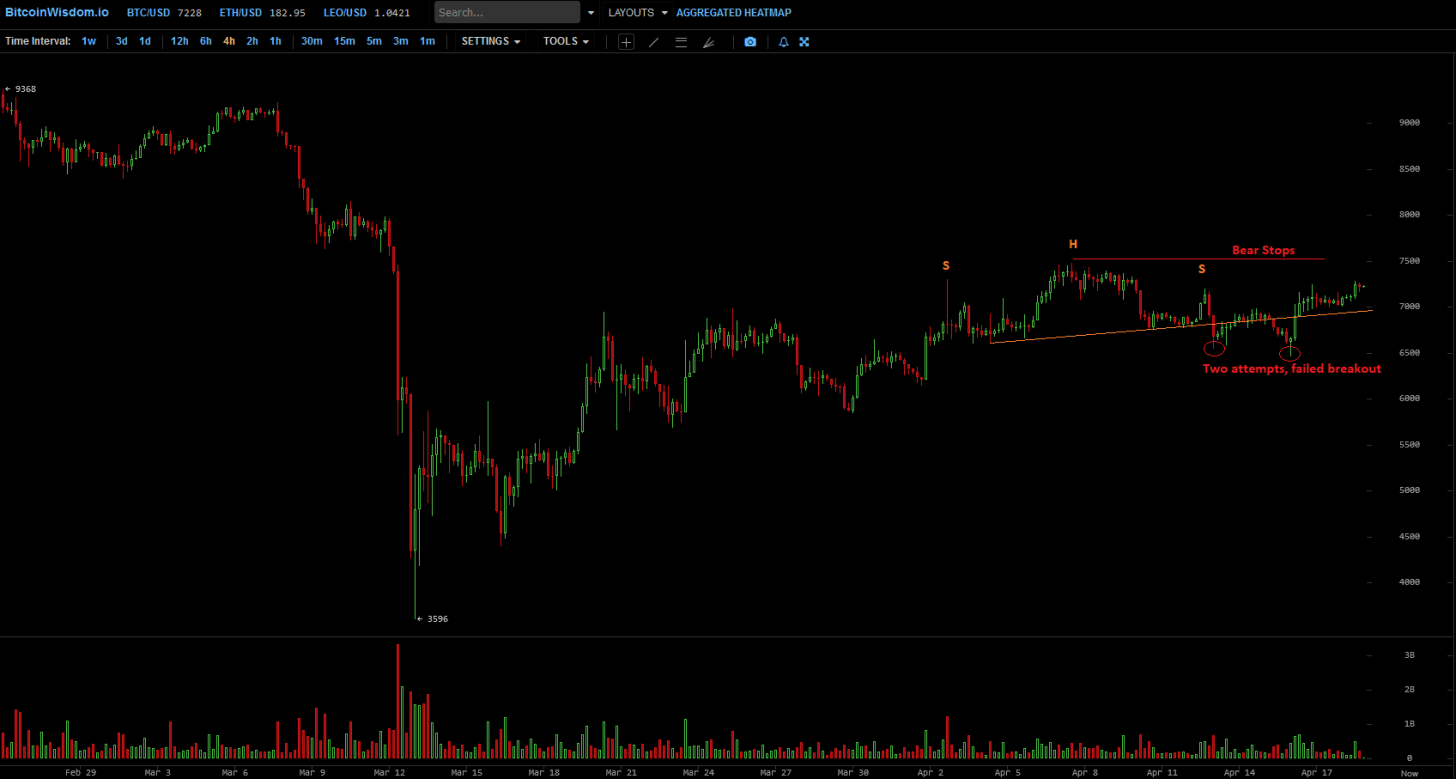
This correction gives many reasons for doubtsregarding its nature. The head and shoulders pattern, which everyone was pointing at recently, seemed to receive confirmation in the form of a downward breakout, but twice already this downward movement has been reliably bought out, which indicates a violation of the pattern. We know that invalidation of patterns can be a signal of movement in the opposite direction. So here, by taking the $7,475 level, one could knock out the stops of the remaining bears and officially confirm the invalidation of this reversal pattern, significantly increasing the chances of a strong bullish rally.
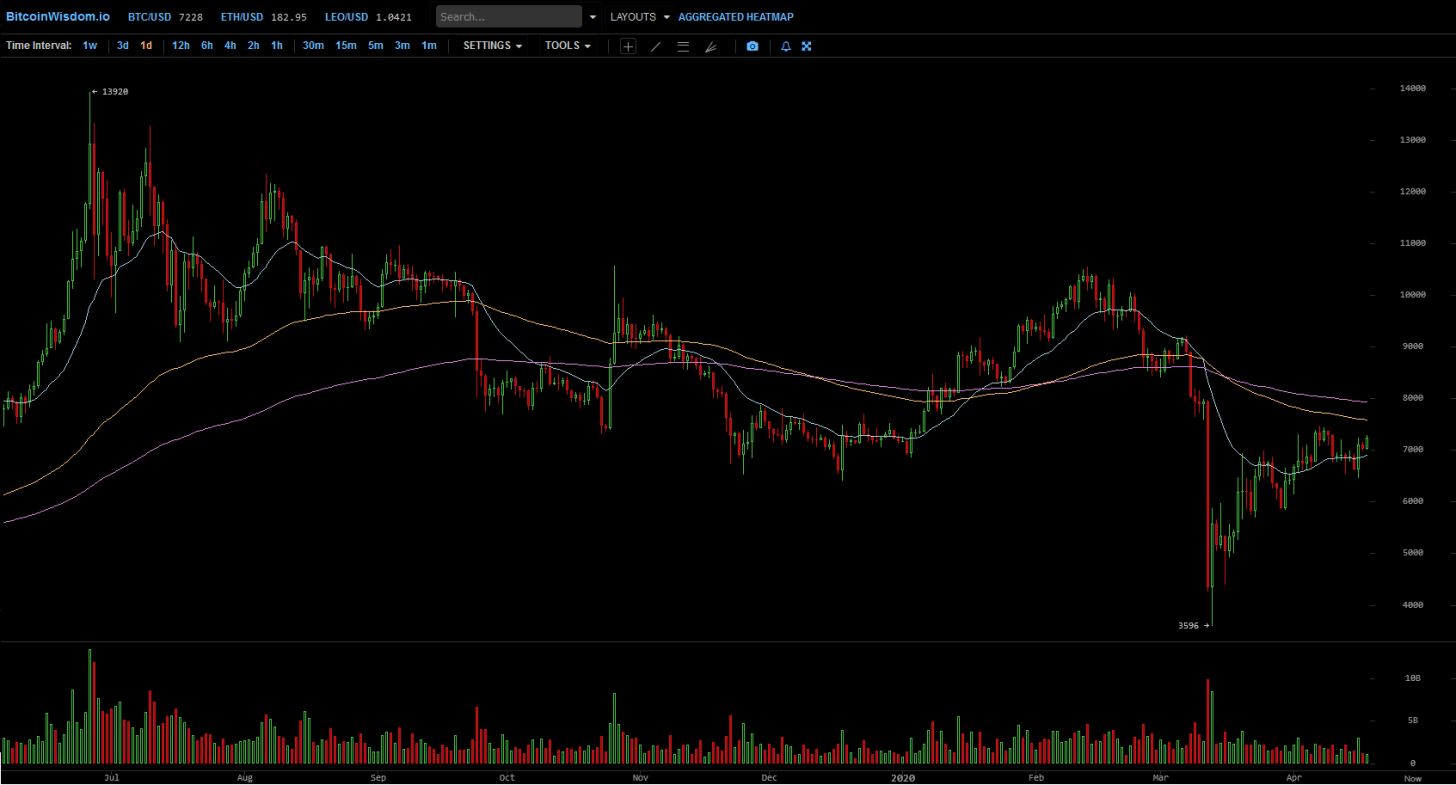
On the daily chart, the picture is similar: the price is still trading in the resistance zone of previous lows in the supposedly corrective movement inside a larger downtrend. Above, there remains an important resistance zone with EMA of 100 and 200 at the levels of $ 7600 and $ 7900, respectively. Now the price is trying to go to the test of these levels, and if it succeeds, this moment will be decisive for whether the bear trend will remain strong in the bitcoin market or if it will finally turn into a bullish one. The market structure itself seems more likely to be correctional / bearish, but does not exclude the possibility of a hard pump starting from current levels, breaking through the mentioned EMAs and confidently changing the macrostructure of the market. Needless to say, for the markets as a whole, such a strong upward break would be a big surprise, despite the fact that the bears still expect another downward movement.
Some thoughts
At this stage, continuing to slowly break throughresistance, bulls cannot afford to show weakness and must continue to redeem any dump attempts, as they did in previous days and weeks. In order to successfully break through the main resistance remaining above, the bulls now need a parabolic movement - preferably accompanied by a high trading volume - to confidently reverse the macro trend formed against the backdrop of a global fall in markets and create an impetus for a rapid upward movement in anticipation of a halving and further after it. On the other hand, an unsuccessful breakout attempt and the manifestation of bull weakness will make the market very unstable and significantly increase the likelihood of a rapid fall.
Finally
Bulls continue to show strength by moving slowlyprice up in the framework of what was supposed to be a correction, but it seems that it may turn out to be a preparation for the pump. Traders and investors are starting to wonder if the bearish trend is still in force or maybe it has quietly changed to a bullish one. Bears still expect a downward movement, but every day they experience more and more nervousness because it does not occur. Customers now need to form an explosive impulse - a strong parabolic movement, accompanied by an increase in volumes - in order to break through the main resistance level and break the macro trend into a bullish one.
Time will show.The upcoming halving adds to the likelihood that the bullish momentum will continue to gain strength. Regardless of whether the halving is already included in the price or not, the supply growth will be halvedwill beput upward pressure on the price, as it always does.
In a nutshell
Any breakthrough of the level of $ 7475 can servestart for strong parabolic movement. Breakdown and holding the level of $ 8000 will be a very bullish signal and will increase the chances of an explosive pump that destroys the bears and gives rise to a new large-scale rally. But be that as it may, at first the bulls still need to break through the zone between the 100- and 200-day EMAs ($ 7,600–7,900). At the same time, any unsuccessful attempt at a pump can lead to a sharp drop, so great care must be taken here. From the point of view of technical analysis, with the current market structure, a sharp surge in prices in any direction can make a lot of sense, and I won’t be surprised if we soon see a strong pump, dump, or even both at the same time.
When the market determines its direction, it will rightly expect great volatility and rapid price movement.
And may the market be with you.
�
</p>Read this:
 Looking forward to move down USDJPY and ETHUSD!
 Bitcoin Market Structure Analysis
 Analysis of cryptocurrency pairs BTC / USD, ETH / USD and XRP / USD on 02/12/2020
 Analysis of cryptocurrency pairs BTC / USD, ETH / USD and XRP / USD on 11/14/2019
 Analysis of cryptocurrency pairs BTC / USD, ETH / USD and XRP / USD on 01.25.2020
 Analysis of cryptocurrency pairs BTC / USD, ETH / USD and XRP / USD on 04/02/2020