Analysis of the fundamental indicators of the BTC market from leading Glassnode analysts: the mechanics of the current correction inmoment and in the context of a long-term trend.
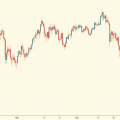
Bitcoin price over the past weekcorrected from ~$66.2 thousand to a minimum of ~$55.7 thousand, interrupting the previously calm and confident growth. Market participants are actively adapting to the new market situation, which has manifested itself in a change in the distribution of coins among various groups of BTC holders and is likely to influence the market reaction in the near future. In this review, we will try to evaluate changes in market sentiment and coin distribution as a result of last week's volatility using on-chain metrics. We will cover the following topics:
- a sharp decline in prices and related changes in the volume of supply at a loss and the dynamics of spending coins;
- The "big picture" of current market trends: the necessary context for the current situation and several considerations for the future course of events;
- short-term holders, their role in the market last week and in general.
Assessment of market dynamics, supply and spending of coins
In the previous review, we established the following:
- Realized profits are growing and the growth rate has accelerated since reaching $60+ thousand.
- The realized losses have remained at the same level for several weeks, which is a natural by-product of an uptrend in the price trend.
- As a consequence of the two previous points, the realized capitalization of Bitcoin reached new record highs, forming a higher plateau for the total net cost of coins.
Generally speaking, surges in profit-taking are quiteexpected in bullish impulses when the price makes new highs; this is a common occurrence in any bull market. As the profit-taking grows, the likelihood of a macro top formation also increases.
The growth in realized profits and realized capitalization itself usually indicates the following:
- The increase in profit taking implies an increase in selling pressure, which, in order to maintain a sideways or uptrend, must be offset by an increasing influx of demand.
- The buyers of these coins (i.e. short-term owners) have a higher basis value, which makes them more sensitive to short-term price movements.
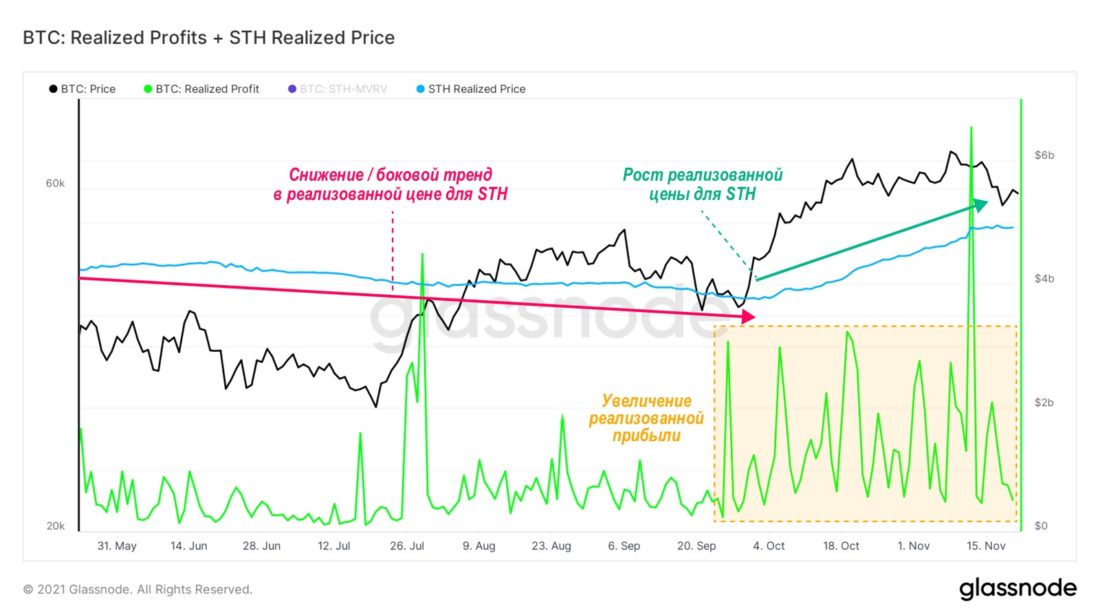
Realized profit + realized price for short-term owners (updated source)
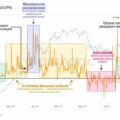
The combination of these factors can offset the marketmomentum and lead to the formation of a local top. One of the tools for determining such a shift in market dynamics is the Market-Realized Gradient oscillator. This relatively new metric in Glassnode's arsenal measures the relative change between speculative (market) price and real organic capital inflows (realized value). The diagram is interpreted as follows:
- positive delta gradient values:an upward trend during the period under review;
- negative delta gradient values:downward trend during the period under review;
- Delta Gradient Growth:the impulse is upward, since the capital inflow is sufficient to support the price (trend continuation);
- lowering the delta gradient:the momentum is downward because capital inflows are insufficient to support the price (bearish divergence).
Before the price drop last week, the valueThe 28-day version of the Market-Realized Gradient was declining amid sideways price movement. A similar picture was observed before the sharp price drop in May, and during the local correction from ~$50 thousand in September. While price was making large highs, the strength of the momentum underlying each one was weakening, creating bearish divergence.
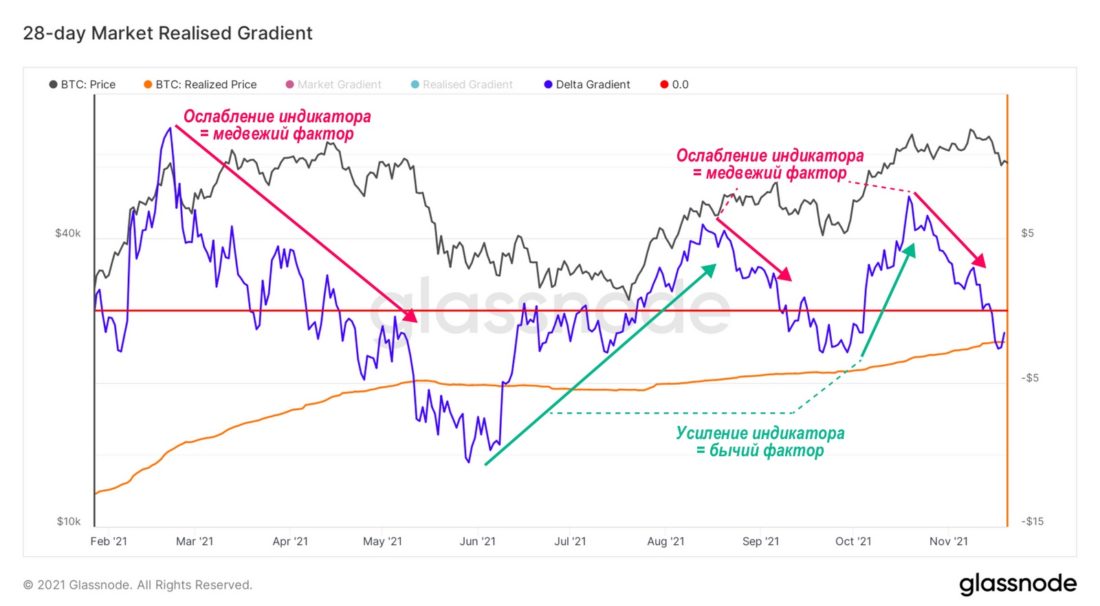
28-Day Market-Realized Gradient (updated source)
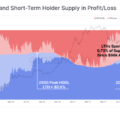
Against the background of a certain sell-off in the market, the indicatorThe percentage of supply in profit helps to get some idea of the profitability and average cost of BTC for market participants. The main findings are as follows:
- 15% of BTC supply has an on-chain cost above $57k.
- This time around, there is a relatively high level of distribution of coins in the market among bitcoin holders compared to other periods when the share of supply in profits was 85-90%.
- The price is in the transition zone (85-90%) betweenbullish and bearish trends. Historically, 15% of the supply at a loss has been enough for a reflexive decline if price fails to recover to higher levels in a reasonable amount of time.
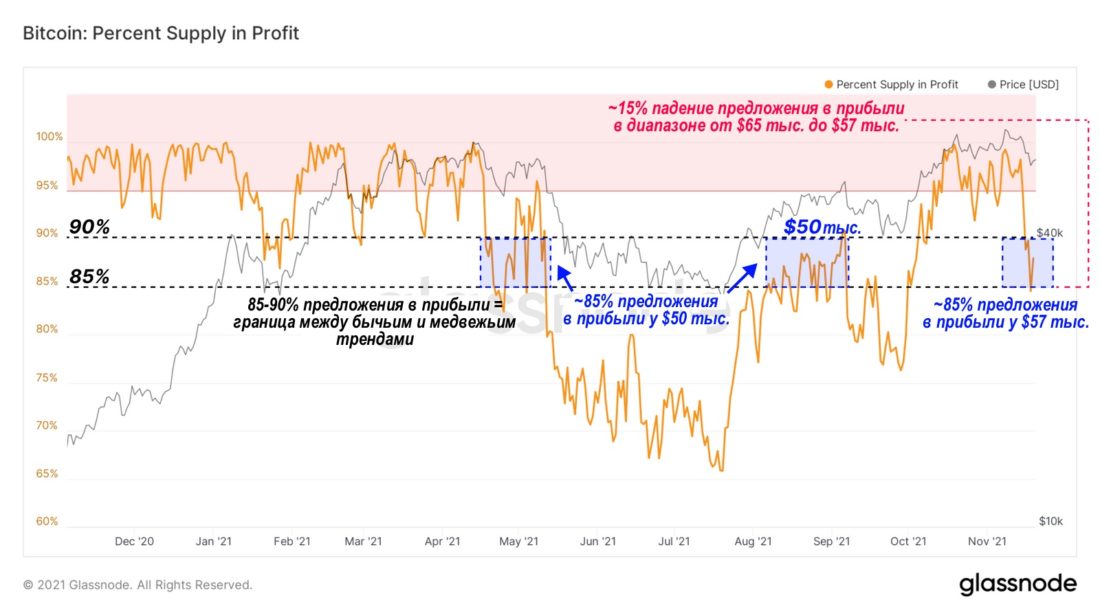
Percentage of BTC offer in profit (updated source)
URPD metric (UTXO distribution by priceimplementation) shows at what prices the current Bitcoin UTXO set was created, i.e. each column reflects the number of existing BTC that last moved within a certain price range. There are several clusters of coins and key levels that can be identified for 2021, the largest of which is 1.9 million BTC moving in the $60-68k range. This supply zone could serve as resistance for the price in the coming weeks if holders decide to take advantage of the recovery to sales of recently purchased coins are close to cost.
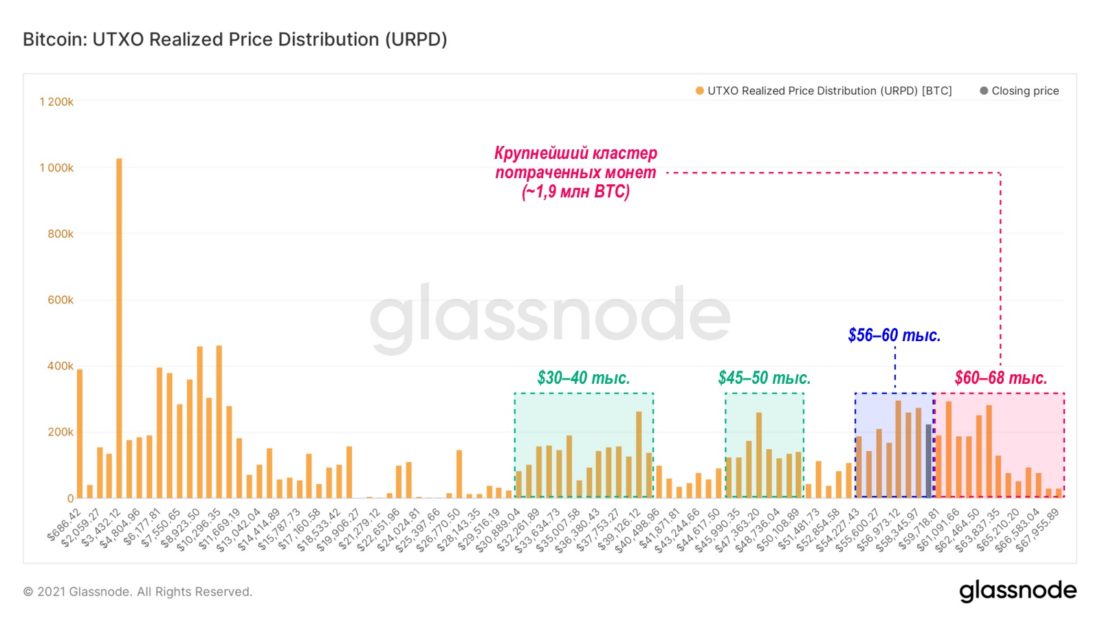
Distribution of UTXOs by Realization Price (URPD) (updated source)
Short-term holders (STH, from short-termholders) are most sensitive to price movements due to a combination of relatively high basis values, high time preference, and potentially less confidence in the asset. The past week was no exception to this rule, since STHs played a significant role in setting both highs and lows by the market.
- STH-SOPR jumped to 1.1 near weekly highs, which is historically a high level associated with active profit-taking.
- Around weekly lows, STH-SOPR dropped below 1, while historically during bullish trends, this level serves as support during retests amid local price pullbacks.
- Holding STH-SOPR below 1 for a long time will signal the need for caution and increase the likelihood of further price decline.
- At the macro level, the STH-SOPR values remainrelatively stable compared to the price rally in early 2021, which may indicate that the market has not yet become oversaturated with profit taking. This is a more constructive mid-term observation.
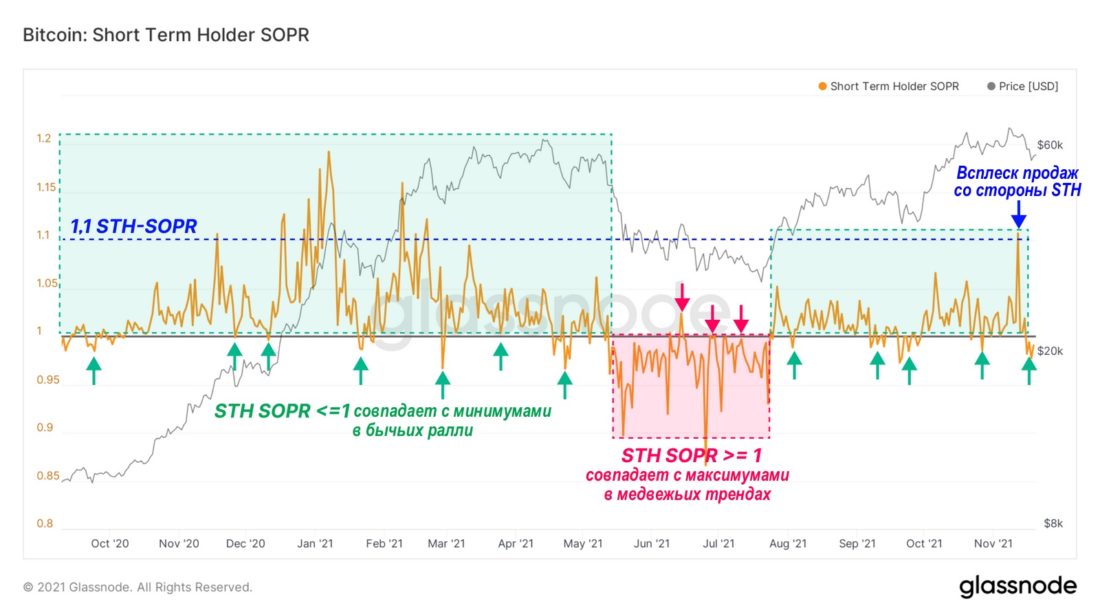
Return on Exits Spent Ratio (SOPR) for short-term holders (updated source)
The Big Picture: Considerations for Potential Recovery
So, we stated the price decrease and thatshort-term holders (STH) became active participants in the market action, aggressively taking profits at price highs and dumping coins to breakeven near weekly lows.
Now let's take a look at the behaviorshort-term investors through the prism of the MVRV ratio (the ratio of the market price to the realized price) and the realized price. Like STH-SOPR. these metrics have historically provided important signals of changing market conditions and investor sentiment by tracking the ratio of market price to average coin cost in the hands of short-term holders. These metrics provide us with the following information:
- STH MVRV = 1 has historically served as the boundaryseparating bullish and bearish trends. This indicates a price return to the underlying value level for short-term holders, and in bull markets they tend to seek to protect this level. Conversely, in bear markets, STH tends to dump coins as they approach breakeven, forming resistance for the price.
- Realized price for short-term holderstoday is ~$53K, signaling that if the price approaches it, this level will become a battlefield for the bulls to regain control of the market. If the $53K level does not hold, this will be an alarming signal for the market, indicating a likely break in the bullish market structure, which is also confirmed by technical analysis.
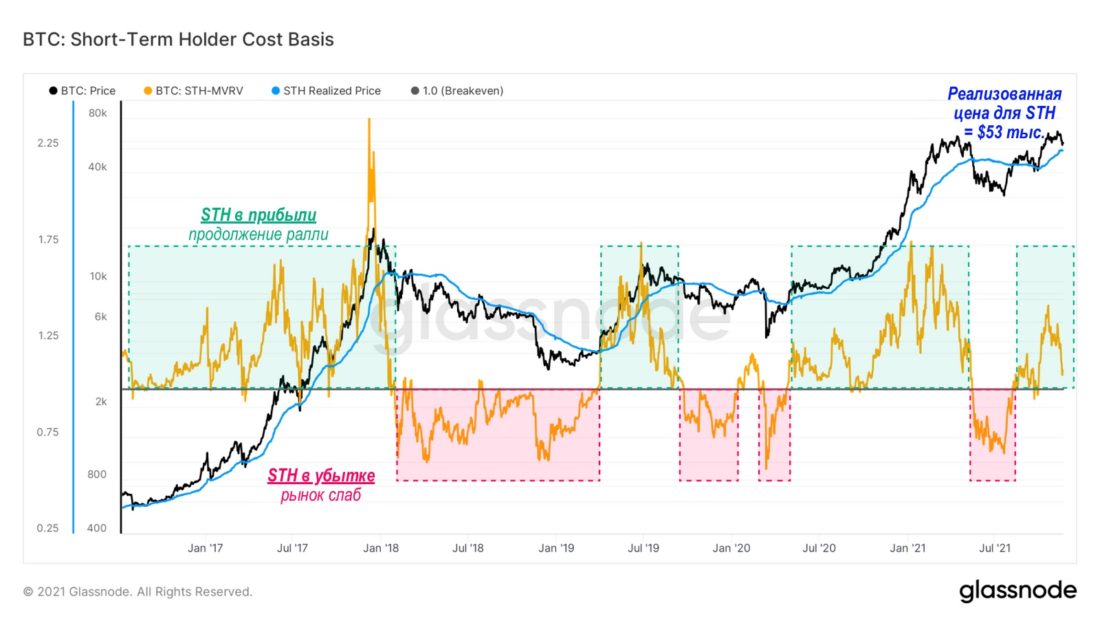
BTC base cost for short-term owners (updated source)
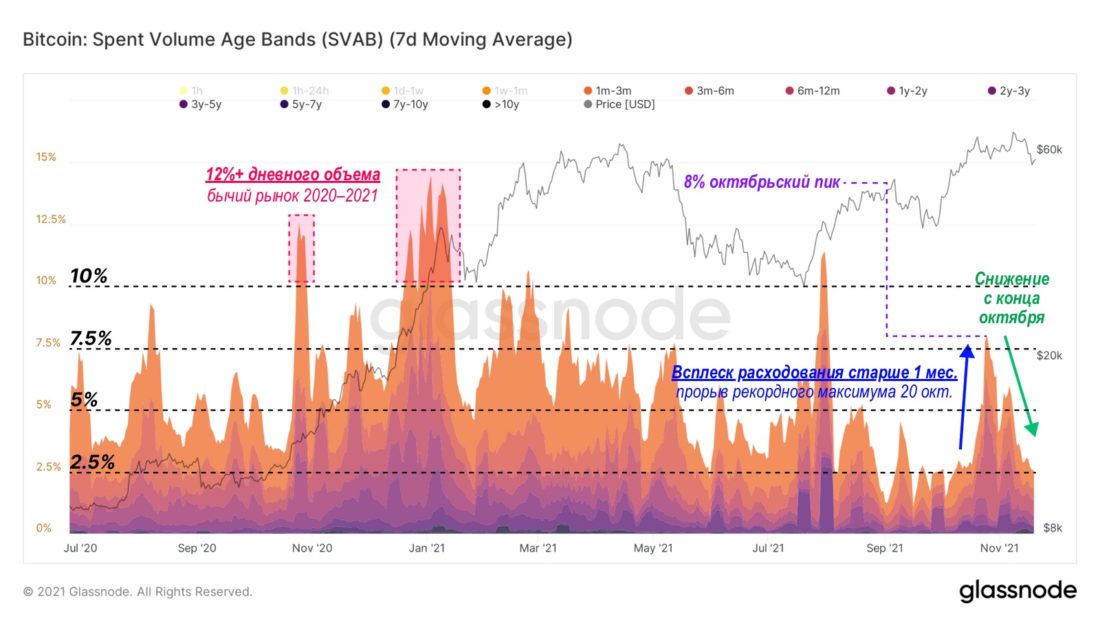
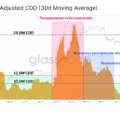
Spent Volume Age Bands indicator (coefficientthe age of volume spent), or SVAB, tracks the age of the coins that dominate on-chain capital flows on a given day. It helps analysts determine when and under what market circumstances long-term (i.e. most convinced) owners are explicitly spending their BTC. While this instrument does not necessarily accurately indicate the formation of market tops and lows, it reflects the beginning of the process of taking profit or accumulating coins. It can also be used to track sentiment across different cohorts of investors.
Taking as an example the period from the end of 2020 to the beginning2021, consistent and pronounced (>5% of daily on-chain volume) consumption of coins older than 1 month began in November 2020 and ended in April-May 2021. Since bottoming around $30k, SVAB has only produced strong outliers at $40k in August and at $60k in October.
Since then, the indicator values have returned back to~ 2.5% of daily volume, which indicates a comparative inaction of older coins, especially against the backdrop of a decline in prices. This can be interpreted as a sign of reduced coin spending on the part of long-term holders, which means that they are more likely to build up their positions rather than exit them.
Age coefficient of volume spent (SVAB, 70d MA) (updated source)
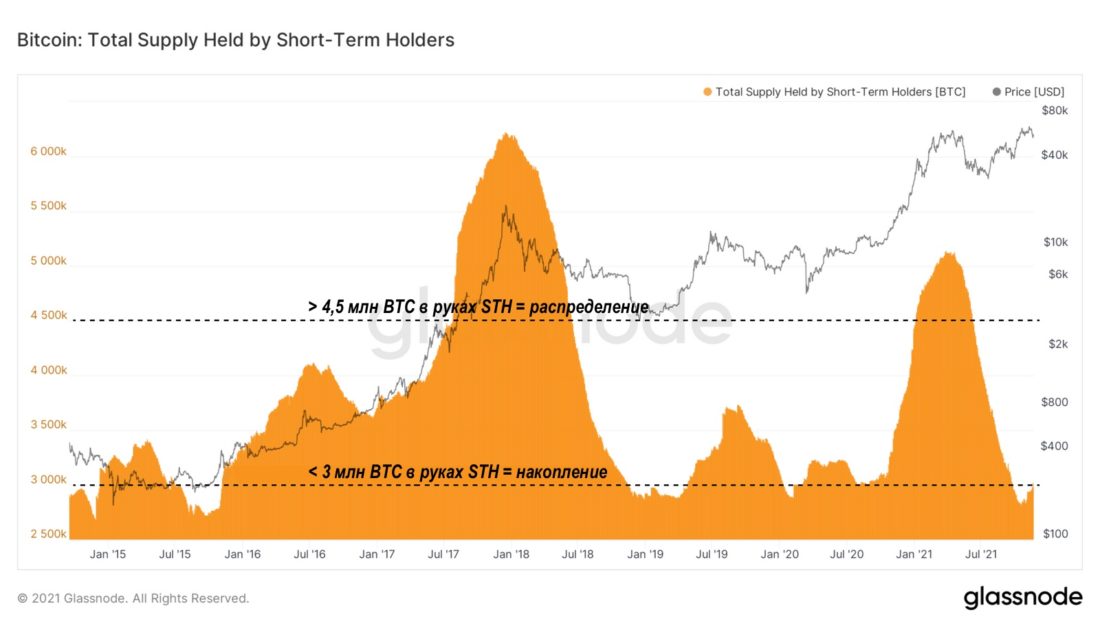
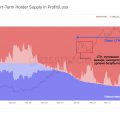
This tendency towards increased hodling from the sideLong-term owners (LTH) can also be traced in the supply dynamics. The total supply in the hands of short-term holders can only increase in three cases:
- when "mining" new coins (the age of which, respectively, is 0 coin-days),
- when withdrawing coins from exchanges or
- when coins are spent by long-term owners.
The chart below shows that the total volumeSTH coin supply is at multi-year lows (<3 million BTC). Consequently, supply in the hands of long-term owners is at multi-year highs. Low STH supply is typical at the end of bear markets and the beginning of bull markets, usually after long periods of accumulation. Such low levels of STH supply so close to price highs is quite a unique phenomenon.
The total supply of BTC in the hands of short-term holders (updated source)
BitNews disclaim responsibility for anyinvestment recommendations that may be contained in this article. All the opinions expressed express exclusively the personal opinions of the author and the respondents. Any actions related to investments and trading on crypto markets involve the risk of losing the invested funds. Based on the data provided, you make investment decisions in a balanced, responsible manner and at your own risk.
</p>
Read this:
 Continued Growth - Most Likely Scenario - Onchain Pulse of November 2, 2021
 Price Continues to Rise - Onchain Pulse from November 9, 2021
 Identifying Market Tops - Onchain Pulse from November 16, 2021
 Approaching Pain Threshold: On-Chain Pulse | June 1, 2021
 Onchain Pulse | 04 May 2021
 Let's measure the correction parameters: on-chain pulse | May 18, 2021