Hello again everyone!
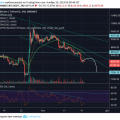
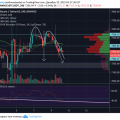
From the previous idea, expectations of a decline in the resistance range from $ 7600- $ 7638 were met.
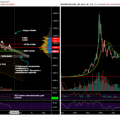
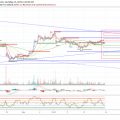
The other daywellbitcointhere was a downward exit from the triangle,accompanied by another spike, which was a signal for continued sales. This move provoked tests of the key level of $7150-$7090. I note that the decline occurred with a breach of the important 61% Fibo correction level. Now the Bitcoin price rate has found support on the 1h timeframe at $7146-$7168. Resistance has formed at $7315-$7382. Only if this range is confirmed (around $7330) should we expect a bullish trend with prospects for renewed growth above $7500. Also, the price rate again went under the moving MA100 and MA50, which indicates the nearest sentiment.
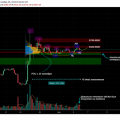
The key support level is still at $7,100-$7,060; repeated sales attempts at this level in the near future will most likely provoke an even greater price decline down to $6,700.
In the near future, I still expectshort-term recovery to the formed nearest resistance levels at $7280-$7300, these are the main goals of possible long positions. This range coincides with the 61% Fib retracement level, from the last low of $7,100 to the high of $7,665. The moving MA100 and MA50 act as a reference point for the main resistance in the medium term.
P.s.: I do not position myself as Vanga, it is impossible to predict a clear goal of market direction, but an approximate understanding of price behavior in the near future is possible, therefore, please treat my ideas as purely general information about what is happening on the cryptocurrency market. My vision of the situation clearly may not coincide with yours.
</em>On the chart.