
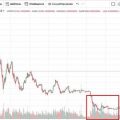
Hello everyone, friends! Let's take a quick look at the Bitcoin chart that forced us to go todayaltos for correction.
Today, towards the end of the Asian session,Bitcoin ratefell from 10125 to 9655 according to the Bitfinex exchange. The collapse occurred in literally 6 minutes and the volume was ~2500 BTC. At the moment, the price has recovered slightly and is trading at 9900.
What can we say? Quite a strange strait, considering the assumptions that I recently expressed in one of my ideas about a possible long position of a major player.
In short, I mean that at an average price in10100-10200 in the interval of August 14-28, a large player could have gained a long position, but a support zone formed in the area of 9800-10100. On September 11, this zone was expectedly protected and, it would seem, everything is going to the point that the price will knock out sellers at 10,700-11,000. But this did not happen and is not happening to this day. We have:
1) The triangle and the upper border of the descending channel still cannot be broken through.
Just look how clearly the price moved in this dynamic resistance zone, but in the end today it went down quite aggressively.
2) At the level around 10400 there is also quite a lot ofa large volume, which is now frightening, because why, being so close to the goal (taking out the sellers), did the interested buyer not do this? Waiting? Maybe. Very strong seller? It's possible. It is the breakdown and consolidation above 10400 that would open the way to 10700-11000.
Accordingly, now a large buyer can wait for the seller to exit and will continue to redeem all sales (as we saw on September 11 and 16). But, this is in an ideal situation.
3) On the chart we can mark MA25 and MA20 (yes,It was MA20 that I was recently advised to use, because it interacts more clearly with the price). And what’s interesting is that we’ve already touched on MA20, but it’s not advisable to consolidate below it.
On the graph, I depicted MA20 as green, and MA25 as a yellow line.
4) Look at the RSI.On the daily chart, we approached levels 37-40, from which the RSI value bounced in the current triangle. On the weekly chart, the RSI value has approached an even more important level - this is what the oscillator has been reacting to since 2016(!!!).
What am I doing?
As for my current position on Bitcoin, its average price is 10050.
In the last update I wrote that whenconsolidation below 9800 I will be forced to exit the position. Actually, that’s what I’ll do, setting a stop at 9750. Yes, it would be more correct to wait until today’s day closes and if it is below 9800 (below the support zone), then I would need to exit, because something is going wrong and the buyer is not protecting himself .
Yes, there is a certain risk that due to the currentlow liquidity and an empty order book, the stop will be hit and the price will go up, but I don’t want to get stuck in the position, because I understand that there may be an opportunity to buy back Bitcoin lower (the same 9100-9400).
Fortunately, trading in alts in recent days has been very intense and a stop on Bitcoin won’t hurt your psychology or your pocket too much.
That's all for me. The main intrigue: whether the buyer will defend the current support.
On the chart.
Read this:
 Analysis of TRX / USD and BNB / USD on 09/19/2019
 Bitcoin will resume growth after the US Federal Reserve cuts its base rate
 Meeting at the Ministry of Finance on the regulation of cryptocurrencies in the Russian Federation postponed
 Is everything sad with BTC now? To dump?
 Bitcoin: when is it best not to buy
 Ethereum – growth to 230?