Results after the US interest rate
Market overview onSeptember 19, 2019
# SP500
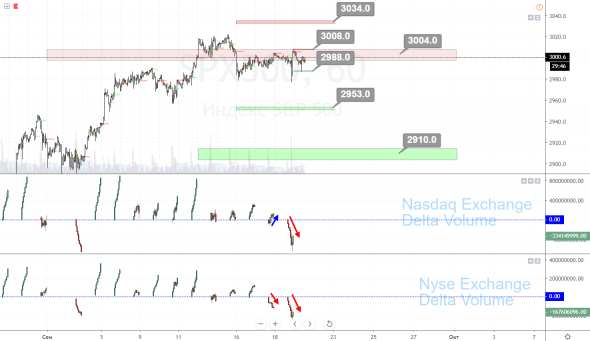
On September 18, 2019, it wasUS Interest Rate Reduction Announced and forin essence, it was supposed to support the American stock market and provoke movement on stock indices, but nothing happened except a small surge. The interest rate was reduced by 0.25 basis points from 2.25% to 2%, which was also mentioned in previous articles. However, it is important to remember that easing the monetary policy of the Fed is not short-term speculation and the task of the central bank in the face of lower interest rates is to increase the issuance of loans for business development. And how much this will happen quickly there is no need to talk. It is also worth noting that negative PMI and NMI reports set the tone for estimates of US GDP and large capitals still refrain from investing until the publication of the report, which will occur on September 26, 2019.
From the point of view of technical analysis, the SP500 index is located on the monthly volatility resistance zone in the region (3004)

Support and Resistance Levels
Monthly volatility resistance - 3004
Weekly volatility resistance — 3034
Daily volatility resistance — 3008
Daily volatility support - 2988
Weekly volatility support — 2953
Daily volatility support — 2910
On Wednesday, after the stock market opened,the NYSE and NASDAQ exchanges were in a downward trend, however, index futures received a strong infusion in the form of market purchases, which is shown on the cumulative delta chart.

The trading recommendation for Sept. 19 will be a search for sells after the U.S. stock market opens and a confirmation on the NYSE & NASDAQ EXCHANGE DELTA VOLUME with targets
Daily volatility support — 2988
Weekly volatility support — 2953
Daily volatility support — 2910


