Not everyone is a long-term Bitcoin hodler, buying cryptocurrency every day by averaging the dollarcost, waiting for bitcoin to finallywill overthrow gold. Some investors are looking for good entry points to buy. Others take profit from time to time. And someone just wants to trade small volumes in order to increase their stack. Regardless of which of these options is yours, you should know: is the market overheated or not?
</p>So how can we find out if the market is overheating or not?
Surely there is no single metric that could tell you everything.
If you want to get a complete picture of the situation, you need to study the various qualitative aspects of the market and, if possible, carry out their quantitative analysis.
Examples of quality aspects that we can look at are:
- Market sentiment. Is the market dominated by greed or fear?
- Position in relation to major trends. How big is the impulse and is the price overpriced?
- The state of profit or loss in the market. Collectively, are investors in the black or are they losing money?
Measuring market sentiment is a complex topic.
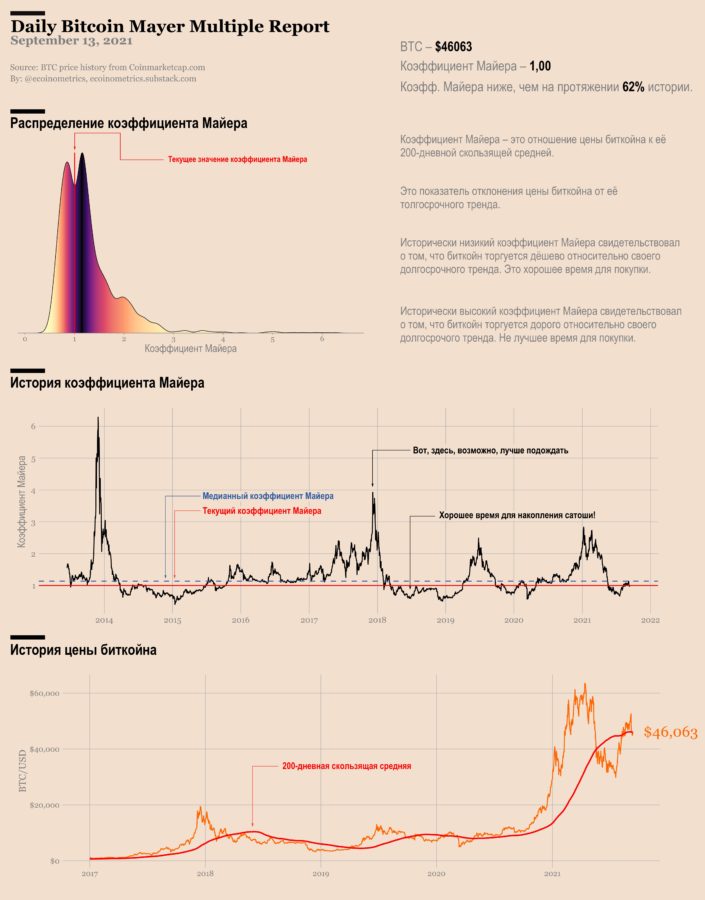
For major trends, the standard reference point is a 200-day moving average. Most traders believe that the upside crossing of the 200MA is a good entry point to the market.
In fact, trading based on this signal alone has an excellent track record in terms of risk-reward ratio.
Thus, being above the 200-day moving average is good, but when the price is too far ahead of it, the risks of correction increase.
However, there is no such risk now. Bitcoin is at the 200MA, and for the most part it has always been. This is not what is called an overheated market.
See for yourself.
The analysis of the 200-day moving average is pretty standard and can be applied to almost any asset.
But with bitcoin, we can dig a little further thanks to the availability of on-chain data.
Everyone is familiar with the concept of market capitalization. You take the entire supply of bitcoins, look at the current price, and multiply these two values. It turns out the market capitalization.
This gives the marginal value of bitcoin, i.e. the marginal buyer who set the last price, and determines the total market value of BTC.
This answers the question: If the last buyer were to purchase the entire offer at the current price, how much would it be in US dollars?
Now that you have on-chain data, you know exactly when the last time a transaction was made with each coin. This means that you also know what the price of bitcoin was at a particular time.
So if you looked at all the coins,checked when they were last moved, multiplied the number of coins by the price at that time and summed it all up, you would get another estimate of the bitcoin market.
This is what is called the realized value.of the bitcoin market, and it answers the question: what is the aggregate supply value of bitcoin based on the last price at which each coin was traded?
Thus, there are two different ideas aboutmarket value of bitcoin. There is how much the marginal buyer is willing to pay now, which is the market value versus what the hodlers bought their coins for, which is the realized value.
If I am a hodler who is about to sell my coin to a marginal buyer, my profit (or loss) is the difference between this realized value and the current value of bitcoin.
This means that the ratio of market value to realized value tells us whether the market is collectively in profit or loss (and by how much).
This ratio is called the Market Value to Realized Value (MVRV) ratio and can be interpreted as:
- a coefficient below 1 means that in the aggregate the market is trading at a loss;
- a coefficient greater than 1 means that the market is collectively in profit;
- the higher the ratio, the greater the potential profit for hodlers.
Now you can imagine that the higher the MVRV ratio, the more unrealized profit the hodlers get, the more likely they are to make a profit at some point.
In other words, as the MVRV ratio gets larger, it becomes more and more likely that the market is overheated.
This metric works quite well. Check out the chart below.
You can see the evolution of bitcoin prices (log scale) broken down by cycle, where each day is colored by the MVRV ratio. The darker the color, the higher the ratio.
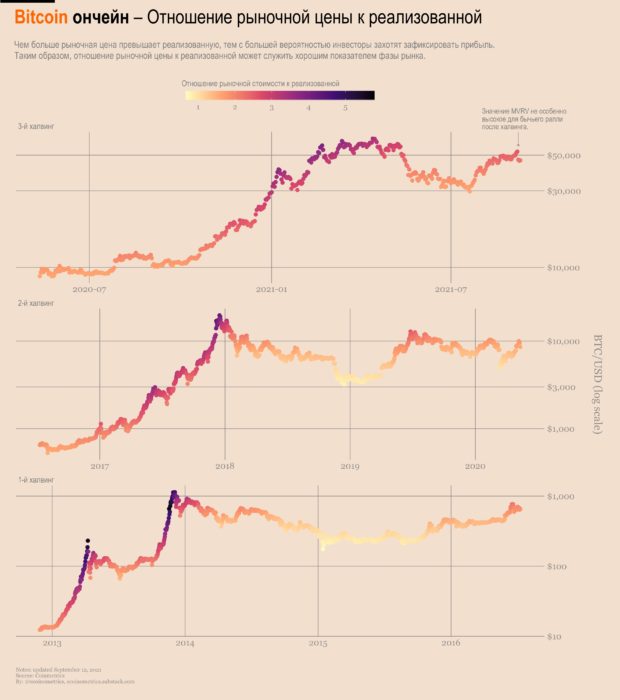
MVRV dynamics
Thus, we see big leaps in the marketvalue until investors, sitting on huge profits, start selling. This increases the supply and leads to a decrease in the marginal price until the market returns to some equilibrium.
The next question is, how big is too big? At what point does the MVRV ratio reach an unacceptable level and lead to a correction?
To answer it, let's look at the historical distribution of the MVRV coefficient broken down by halving cycles.
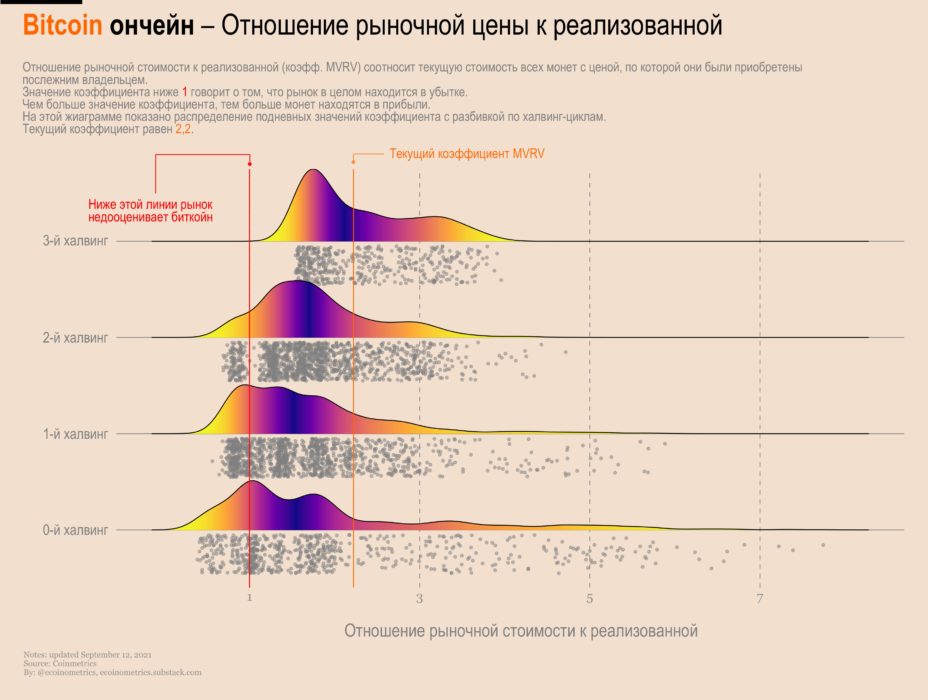
Some observations:
- for previous cycles MVRV averaged about 1.5;
- there were bursts up to 7, but with each cycle, such exceptions seem to decrease;
- so far in this cycle, the average MVRV is close to 2 and we really haven't seen any exceptions like in previous cycles.
Specifically, the current MVRV is 2.2, which means the market is operating profitably without being particularly overheated.
In fact, the MVRV 2.2 is pretty good historically.
Break the MVRV factor into categories:
- less than 1,
- from 1 to 2,
- ...
- more than 5.
Pick one day from the past.Its MVRV falls into one of these categories. See price behavior after 1 day, 2 days, … 40 days ahead and record your total profit. Repeat this for all the values in each category and you should be able to build some statistics.
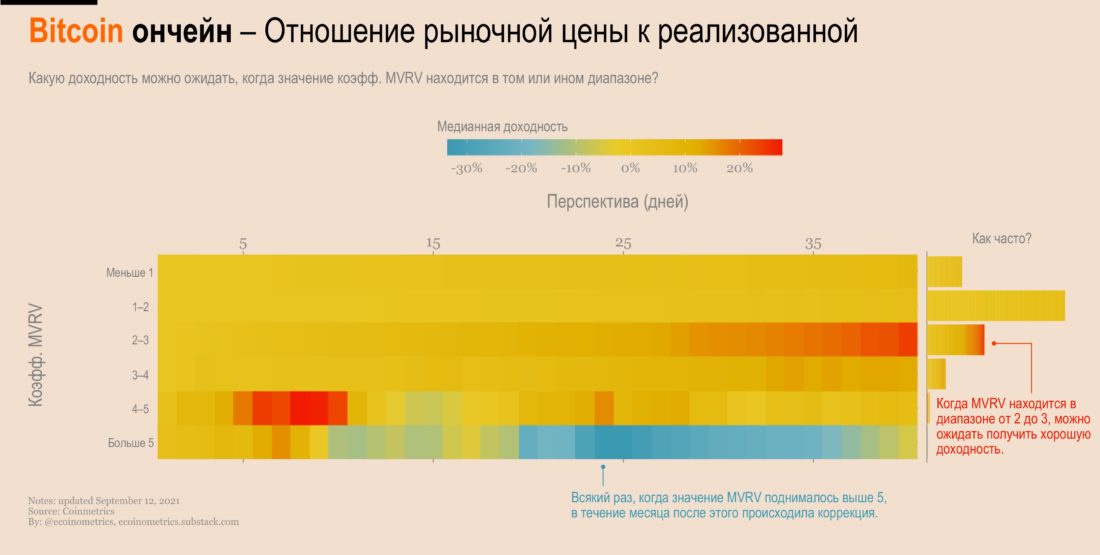
So what is the expected return in 30 days when the MVRV is around 2?
Just take a look at the heatmap below:
- The third line from the top is the category of points in time for which the MVRV ranged from 2 to 3.
- Go right until you get 35 days ahead. This is about a month after the point with an MVRV value between 2 and 3.
- The color of the cell then tells you what the average return is. In this particular example, we are in the red, which means that on average there was an increase of 40% in one month.
See for yourself.
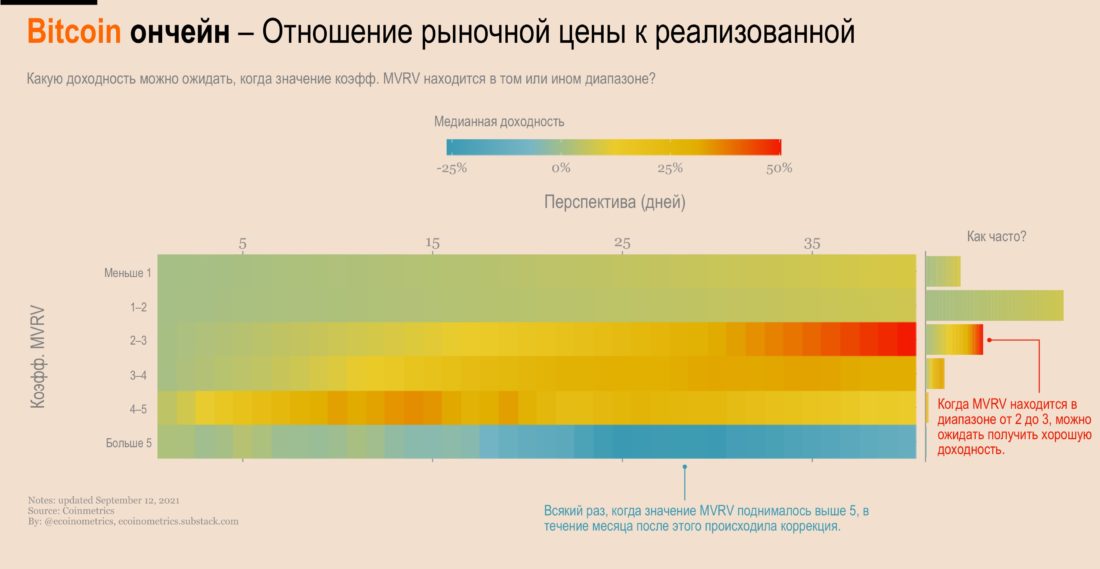
The range 2 to 3 approaches red whenyou are moving forward in time. This means that, historically, you can expect momentum to pick up momentum during the month when the MVRV ratio is in this range.
Typically, a value between 2 and 5 will give you a positive expected one month profit.
In fact, when you move above 5, everythingturns blue. Otherwise, historically MVRV over 5 means that price correction can be expected within a month. This is one of the criteria for an overheated market.
And just to make sure that the structure of the averages is not skewed by just one exception, we can do the same analysis using the average profit. It turns out that the patterns are correct.
What then is the conclusion?
Well, there are at least two indicators,showing that the bitcoin market is far from overheating: BTC is at the 200-day moving average, and its market value in relation to its realized value is actually at a quite healthy middle level.
So if you want to stick with tactics, now is not a bad time to open a long.
BitNews disclaims responsibility forany investment recommendations that may be contained in this article. All opinions expressed express exclusively the personal opinions of the author and respondents. Any actions related to investment and trading in crypto markets involve the risk of losing invested funds. Based on the data provided, you make investment decisions carefully, responsibly and at your own risk.
�
</p>Read this:
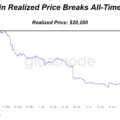 Bitcoin's realized value is breaking records
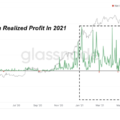 $ 220 billion in realized profit for Bitcoin in 2021
 Bitcoin Developer Estimated BTC Ownership Cost at 2.1% per annum
Jihan Wu: “After halving, the pressure of miners on the value of bitcoin will decrease”
Bitcoin Developer Estimated BTC Ownership Cost at 2.1% per annum
Jihan Wu: “After halving, the pressure of miners on the value of bitcoin will decrease”
 MVRV metric and institutional interest point to BTC growth
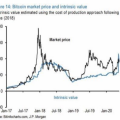 JPMorgan: Bitcoin's intrinsic value equals market price