The domino effect of the current bear market is entering a new phase. Along with the miners, the pressure beginstest and long-term holders of BTC, which encourages them to sell their "coins" at an accelerating pace.
Over the past week, the supply in the hands of long-term holders has decreased by 178 BTC, or 1.31%.
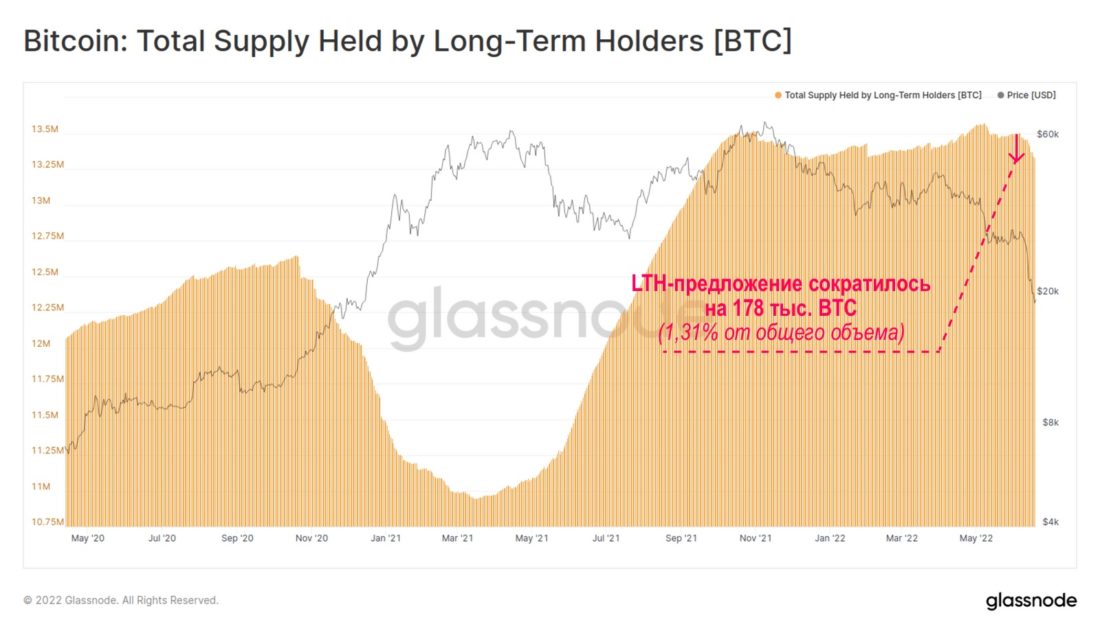
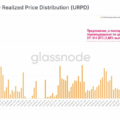
The total supply of BTC in the hands of long-term holders (updated source)
Moving on-chain coins with an “age” greater than 1year accelerated from 20 thousand to 36 thousand BTC per day. This indicates the spread of fear and panic to the cohort of “strong hands”, long-term investors.
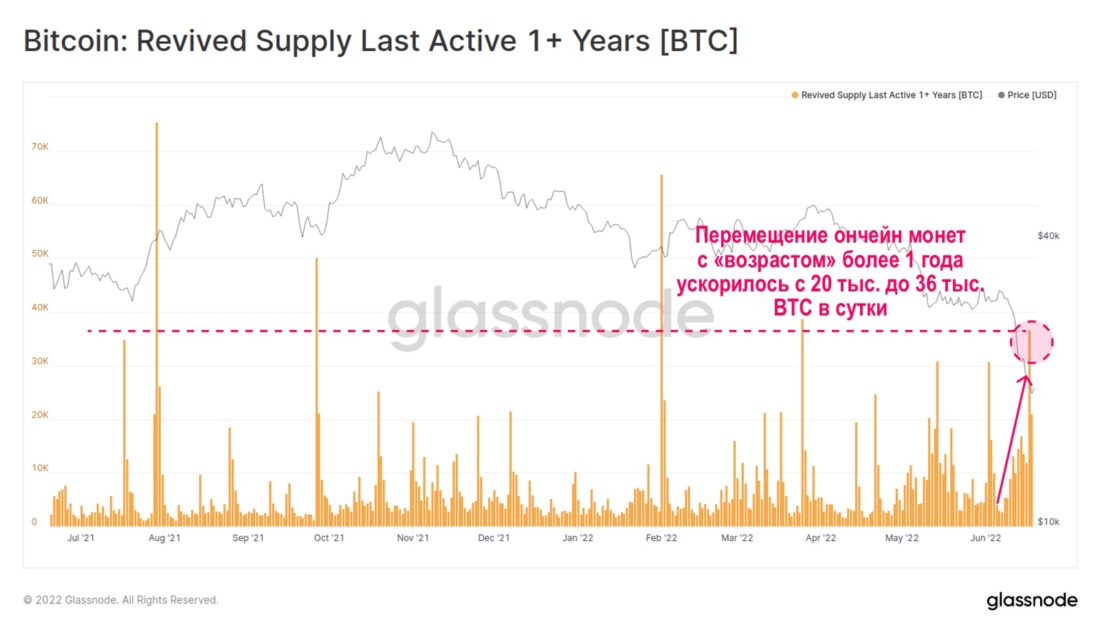
Moving on-chain coins with an “age” of 1 year or more (updated source)
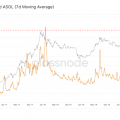
We can display the level of motivatingfinancial pressure on long-term holders (LTH) using LTH-MVRV, the MVRV ratio for long-term holders. The MVRV coefficient is the ratio of the market value of BTC to the realized value (the basis of the cost of coins for a particular category of holders). The market's decline to $17.6K lowered that figure to 0.85, meaning long-term holders are on average facing 15% unrealized losses. This is below the low set in March 2020 (Covid) and only slightly above the capitulation low of the 2018-2019 bear market.
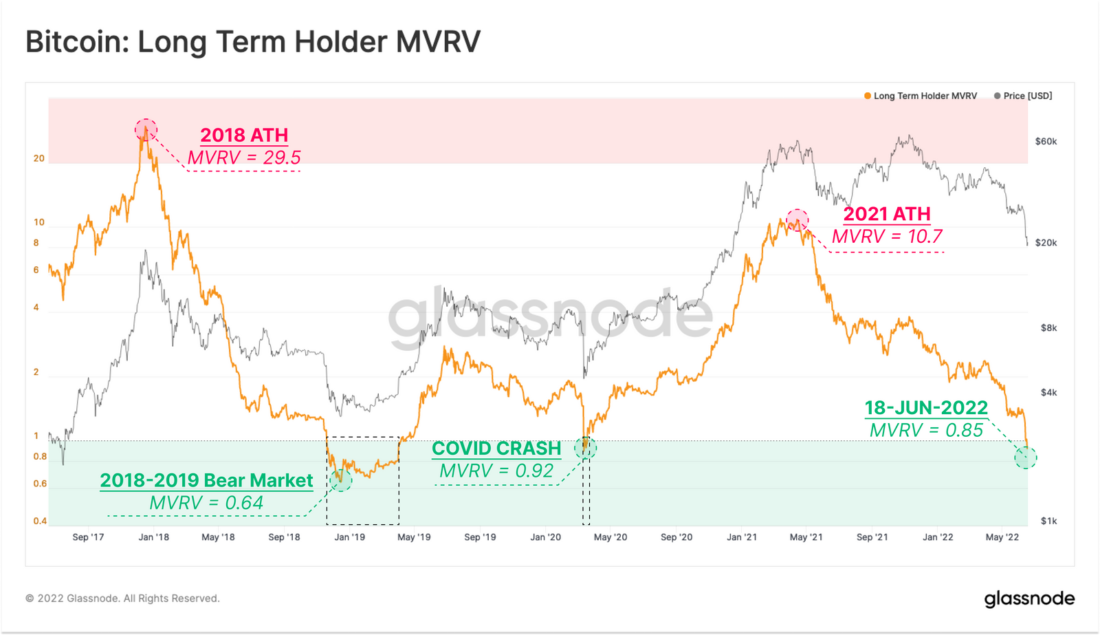
MVRV for long-term holders (chart updated)
Unrealized losses of long-term holdersincrease, and the intensity of sales at a loss for this category of investors can be tracked by LTH-SOPR. This metric compares the market price to the cost of coins spent by long-term holders on any given day.
In the past, the capitulation of long-term holdersoccurred when this metric traded below 1, implying that long-term holders were locking in losses after an extended period of holding BTC. At bear market lows, this ratio dropped to the 0.4 to 0.6 range, meaning the average recorded loss was between 40% and 60%.
So, the current level of selling BTC at a loss by long-term holders is the same as March 2020, but not as severe as at the bear market lows of 2015 or 2018.
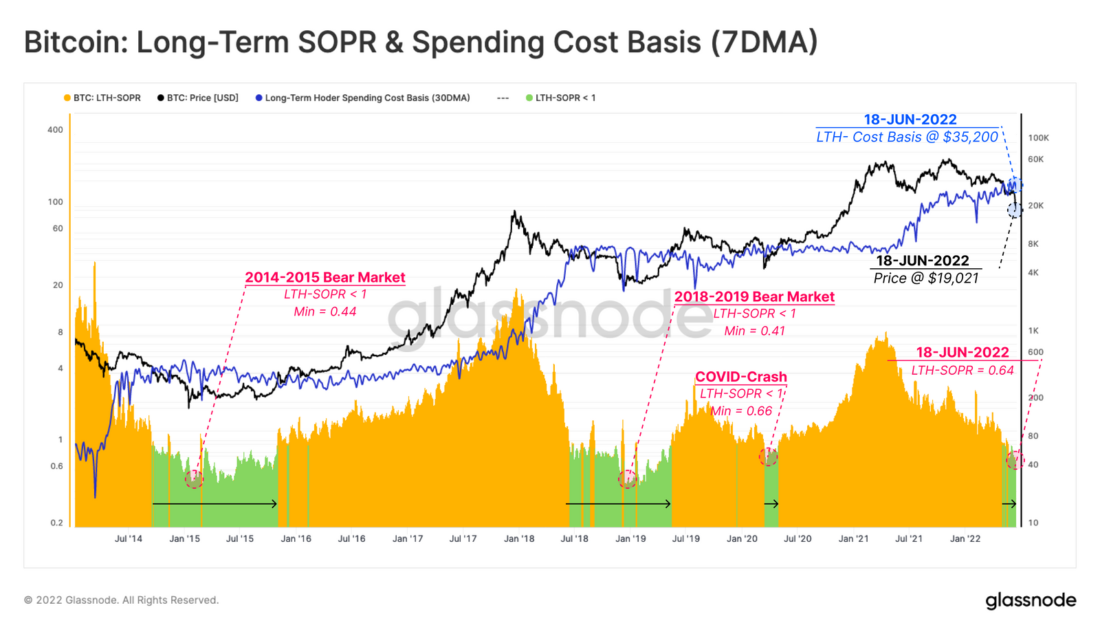
SOPR and cost basis of BTC spend (7-day MA) for long-term holders (updated schedule)
You can also track the net volume of distributioncoins by long-term holders over a 30-day period to assess relative selling activity. Here we have normalized the values by the volume of total LTH supply to get a comparative representation of the behavior of this category of investors in previous bear markets.
In the latest sharp decline, long-term holdersspent just over 1% of their total supply per month. The same rate of spending was observed during the collapse in March 2020 and in the correction from the record high in December 2021. This level is almost double the maximum outflow during the 2018-2019 bear market.
By the way, note that the largest outflowBTC from balances of long-term holders actually occurs in bull markets (profit taking), not bear markets (when savvy investors panic and take losses).
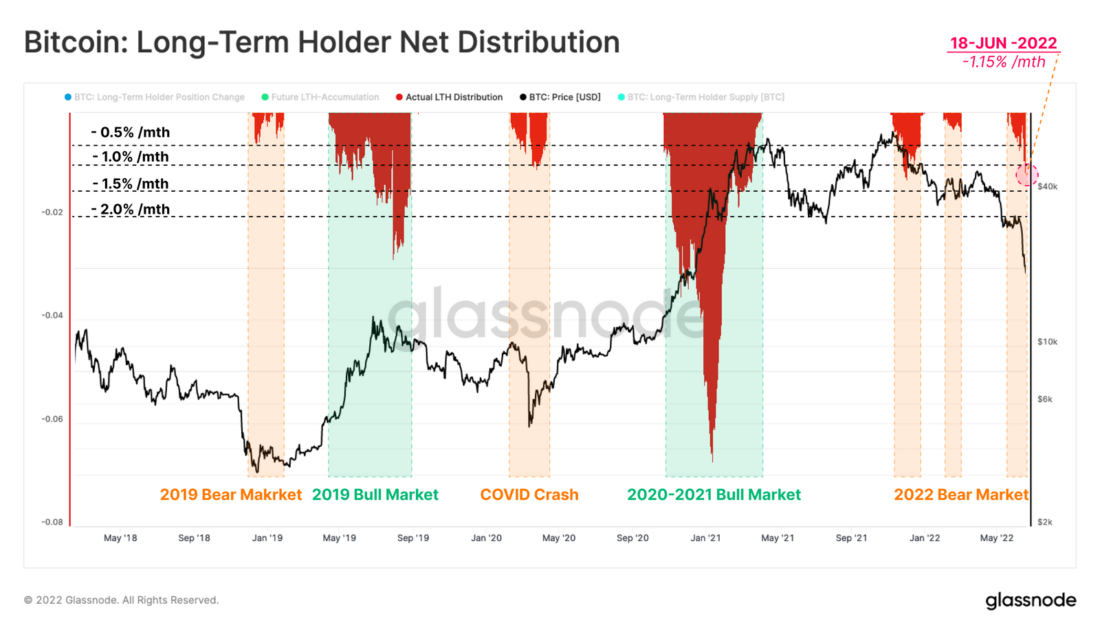
Net reduction in balance sheets of long-term holders (updated schedule)
But what if we measure the average level of "pain" for the influx of BTC to exchanges?
Exchanges remain the main trading venuebitcoins, and the analysis of incoming flows of coins on exchange wallets can clarify our observations about the reaction of the market to volatility and drawdowns in the rate. The following chart only filters out cases where weekly net BTC inflows to exchanges (red) or outflows from exchanges (green) exceeded 1% of total exchange balances.
Here are the latest highlights:
- Bear market 2018–2019: weekly inflow mode > 1% of total exchange balances were maintained for a month.
- Fall Luna: net inflow reached 4% of total exchange balances.
- current market: Net BTC outflow from exchange wallets of -2.8% of total exchange balances, commensurate with the outflow after the crash in the first wave of Covid.
Thus, despite the strong price drop, the supply of BTC on exchanges was declining at a rate of 2.8% per week.
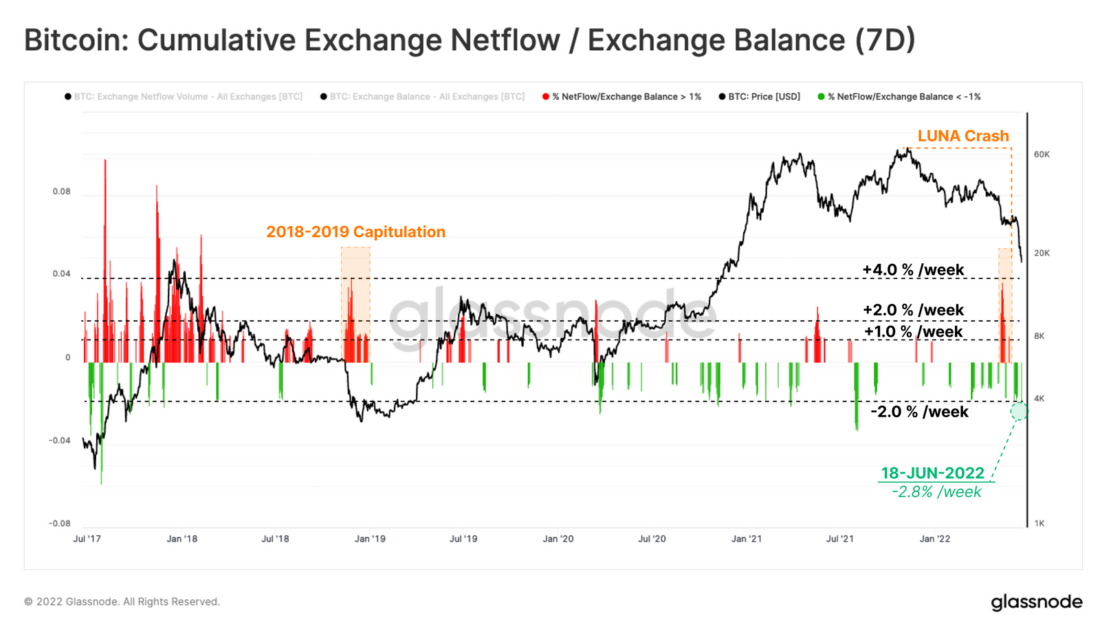
Net BTC in/out of exchange wallets as a percentage of total exchange balances (7-day average) (updated schedule)
Continuing to explore this direction, one cancharacterize the profitability of the inflow of coins to the exchanges in terms of the level of realized profit or loss. The influx of BTC into exchanges over the past month has been predictably accompanied by realized losses, totaling more than 1.5% of Bitcoin’s market capitalization.
This is higher than the May-July 2021 sell-off, but about half the extreme lows of the 2018-2019 bear market. and the collapse during the first wave of Covid.
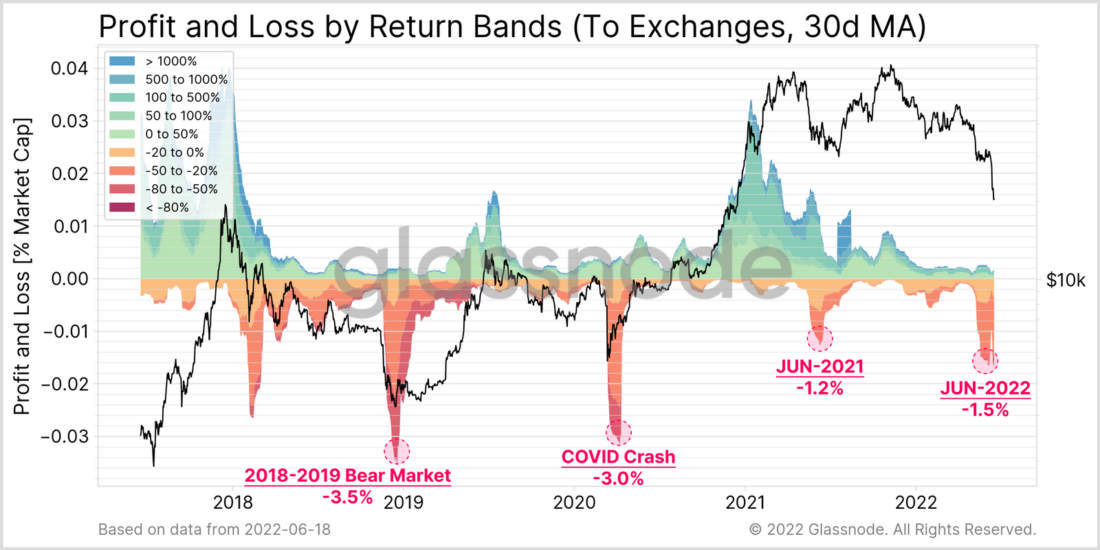
Profit/Loss of BTC inflows to exchanges (30-day MA) (updated schedule)
After November's all-time high, the marketBitcoin has gone through two phases of capitulation. The first was caused by the forced sale of more than 80 thousand BTC Luna Foundation Guard, the second was a large deleveraging of the entire crypto market last week, both on-chain and on exchanges and derivatives. Total realized losses were over $7 billion, with long-term holders adding approximately 178k BTC to the overall sell-off.
Miners are also under serious pressure:BTC is trading near the estimated cost of production, revenues are well below the annual average, and the hash rate has noticeably corrected from set all-time highs - a sign of a piece of equipment shutting down.
The bitcoin market as a whole has come very close tohistorical thresholds for financial pain for participants and may gradually begin to look for signs of waning selling pressure over the coming weeks and months.
BitNews disclaim responsibility for anyinvestment recommendations that may be contained in this article. All the opinions expressed express exclusively the personal opinions of the author and the respondents. Any actions related to investments and trading on crypto markets involve the risk of losing the invested funds. Based on the data provided, you make investment decisions in a balanced, responsible manner and at your own risk.
Based on source
Read this:
 Long-term bitcoin holders are back to building up their positions, according to Glassnode
 Long-term holders and making a profit
 Long Term Bitcoin Holders Will Provide New BTC Rally
 Long-term holders start taking profits
 Long-term holders sell bitcoins: why it's a bullish signal
 CryptoQuant: Long-term investors are capitulating, this is a good sign for Bitcoin