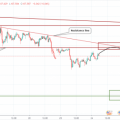
Below I will list the signs of a local Bottom, 1) the price in its fall should form a Support level, 2) afterhow the support level will be formed pricegoes into a rollback, and with a new attempt to go down, now a new attempt to push down will interact with the support level, and according to the reaction of the price it will be possible to understand whether there is a reversal from it or not ... You can figure it out by Japanese candlesticks, a reversal should appear a candle, and 3) after all this, it is advisable to look at the oscillators, is there any divergence?
Bitcoin, H1, fall, support level 8686.18, reversal candle white Popsicle, Stochastic(6.2) double divergence


Read this:
 Do you have any tiredness from trading? how do you deal I use sports and walks.
 Looking forward to move down USDJPY and ETHUSD!
what deposit do you work with? I am inside the day 2 K. The average period is two by 2 K. And you?
Do you often trade intraday? I have no more than 2-5 transactions
Looking forward to move down USDJPY and ETHUSD!
what deposit do you work with? I am inside the day 2 K. The average period is two by 2 K. And you?
Do you often trade intraday? I have no more than 2-5 transactions
 Happy New Year, comrades traders! ! ! (inside the present)