Dialogue between two traders:
- What is the name of the behavior of a stock if it does not coincide with the market as a whole?
—Kotyarovka. They, like fat cats, walk on their own…
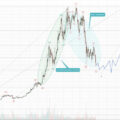
And so, dear readers, today we also plan to analyze a stock exchange instrument based on Eliot’s wave theory. The hero of today's analytics will again be the American index – SP500 / SPY
Let's start with the fact that last week I'm with youI discussed that the beginning of the fall was in the form of a zigzag and a correctional model 3 - 3 - 5, I note that the fall did not start from Zone 2, but, on the contrary, from Zone # 1, this was confirmed by the renewal of the tops on the chart,
It is very important to note that the fall, which was last week, extended right up to wave 4, of the previous order, and again confirmed the continuation of the growth.
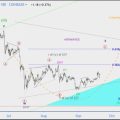
At the moment, we are with you againin the 4th wave, but of a lower order (marked on the chart by Zone 3) and upon its completion we will again go to update the historical highs. It is important to note that when this breakdown is taken into account, we have a critical level (also marked on the chart) which is formed by the top of the first wave, a breakout of this level will mean an overlap, and will cancel the signal with an impulse.
If you have a desire to make trading operations on the American index, then you can build a grid of buy orders with a very pronounced stop with great confidence.
Moreover, I plan to generate a buy signal corresponding to this wave scenario.

Well, then, as they say, we'll take a look!
Don't forget to subscribe to our telegram channel https://t.me/sukiasoffcom to receive the latest analyses, news and trading signals.