Everything you need to know about the adoption of cryptocurrencies around the world as of 2022. Review from Chainalysis.
Navigation:
- Cryptocurrency Global Adoption Index 2022
- North America
- Latin America
- Central, Northern and Western Europe
- Eastern Europe
- Central and South Asia, Oceania
- East Asia
- Middle East and North Africa
- Africa south of the Sahara
- Cryptocurrency Global Adoption Index 2022: Complete List
Cryptocurrency Global Adoption Index 2022
Cryptocurrency Global Adoption Index 2022: Emerging Markets Lead Massive Adoption, China Remains Active Despite Bans, Fundamentals Look Healthy
We are pleased to present an updated indexGlobal Cryptocurrency Adoption for 2022 by Chainalysis. We publish this ranking for the second year in a row. The 2021 report can be found here and we will refer to it more than once in the future.
What do we call mass adoption of cryptocurrencies?
We could just rank countries by volumecrypto transactions, and this would give us a visual representation of where the most crypto activity takes place. But we are not interested in this. The purpose of our index is to measure where most people invest the majority of their money in cryptocurrencies. Institutional activity plays an important role, but we also want to highlight the countries where individual non-professional investors use digital assets the most. In the next section, we describe our methodology and present the top 20 countries in the resulting index.
Methodology
Cryptocurrency Global Adoption Index fromChainalysis is calculated on the basis of five sub-indices, each of which is based on the use of different types of cryptocurrency services in certain countries. We ranked all 146 countries for which we have sufficient data for each of these five indicators, took the geometric average of each country's ranking for all five, then normalized the final value on a scale from 0 to 1, and thus for each country received a score that determines its position in the index. The closer the final score is to 1, the higher the country's ranking.
To calculate our sub-indices, we estimate volumescryptocurrency transactions by country for various services and protocols based on web traffic data of these services and protocols. Traffic data provided by Similarweb. This approach does not take into account the use of VPNs and other methods of masking web traffic, however, given that our index is calculated on the basis of hundreds of millions of transactions, the use of VPNs must be extremely widespread in order to significantly distort the data obtained. Experts we interviewed additionally generally agreed that our index is in line with their perceptions of the markets they operate in, which increases our confidence in the methodology used.
In the following, we describe in detail each of the five sub-indices and how they are calculated.
The value of cryptocurrencies received in on-chain transactions by centralized exchanges, weighted by purchasing power parity (PPP) per capita
The purpose of this sub-index is toassess the overall level of activity of each country in interaction with centralized cryptocurrency services, but weigh the value in favor of those countries where the amount received is more significant in relation to the well-being of its residents and the value of money in the country as a whole. To calculate this indicator, we estimated the total value of on-chain transactions received by users of centralized services in each country and weighted the resulting value by PPP per day. as a measure of the country's wealth in terms of the average resident. The higher the ratio of the total volume of incoming on-chain transactions to PPP per day, the higher the rating, that is, with the same volume of received cryptocurrency transactions, the country with a lower PPP per day. will rank higher.
The value of cryptocurrencies received by centralized exchanges in retail-sized on-chain transactions, weighted by PPP per d.
The purpose of this indicator is to assess the levelactivity on centralized services of non-professional private cryptocurrency users based on the ratio of the volume of their cryptocurrency transactions to the average level of well-being of residents of the corresponding country. We estimated the total volume of retail transactions, in this case defined as any cryptocurrency transactions under $10K. We then ranked countries according to the resulting value, but weighted it in favor of countries with lower PPP per day.
Trading volume on peer-to-peer (p2p) platforms, weighted by PPP per day. and by the number of Internet users
The volume of p2p transactions accounts for a significant share ofof all cryptocurrency activity in emerging markets. For this subindex, we ranked countries by the volume of p2p transactions and weighted the resulting value in favor of countries with lower PPP per day. and fewer Internet users. The goal was to highlight countries where more residents invest a larger share of their wealth in peer-to-peer cryptocurrency transactions.
The value of cryptocurrencies received in on-chain transactions from DeFi protocols, weighted by purchasing power parity (PPP) per capita
In the last two years, DeFi has been one of the mostfast growing areas of the crypto market. In fact, as we can see from the comparison of decentralized exchanges (DEXs) and centralized exchanges, decentralized cryptocurrency protocols that primarily use Ethereum rather than Bitcoin have at times outperformed centralized services in terms of on-chain transaction volume. Given the importance of DeFi to cryptocurrency innovation, we wanted our adoption index to highlight countries where a disproportionate share of user financial activity is concentrated in DeFi protocols. For this sub-index, we rank countries by volume of DeFi transactions, and apply a weighting factor in favor of countries with lower PPP per day.
Per capita purchasing power parity (PPP) weighted value of on-chain retail-sized transactions derived from DeFi protocols
Just like we want to count in the indexactivity of non-professional, individual users of cryptocurrencies on centralized services, we want to get the same for DeFi. Thus, this sub-index ranks each country by the volume of retail-sized DeFi transactions, and applies a weighting factor to the resulting result in favor of countries with lower PPP per day.
How the methodology has changed this year
The biggest change fromgeography report for 2021 is due to the addition of two new sub-indices based on the volume of DeFi transactions and changing the other two sub-indices so that they take into account only the volume of transactions associated with centralized services. This decision is dictated by two reasons: first, as mentioned above, to highlight the countries leading the spread of DeFi, given the importance of these technologies for the entire cryptocurrency ecosystem. Secondly, we wanted to solve the problem of transaction volume inflation caused by DeFi. In the case of centralized services, deposit and withdrawal transactions from them are counted in the volume of on-chain transactions, but transactions within these services, such as trading on centralized exchanges, are not. Centralized services process such transactions on their own, and this data is not available using blockchain analysis tools. But with DeFi protocols, things are different. They do not accept user funds for storage and only coordinate cryptocurrency transactions between private wallets, so all DeFi transactions are displayed on-chain. This means that if you base reports on on-chain data, then the transaction volumes in DeFi protocols will have a strong additional advantage compared to centralized services. In the context of our index, this can artificially rank countries with higher DeFi penetration compared to those with more centralized services, even if the actual volumes of cryptocurrency transfers in them are the same.
To solve this problem, we decided to measureCeFi and DeFi transfer volumes for each of the countries separately - both in general and for retail size transactions - and use the points received as equal components when calculating the overall index. In this way, we achieve greater accuracy in comparing the volume of transactions in each of the countries and greater transparency regarding where there is a relatively large volume of transactions in the DeFi ecosystem.
Top 20 Cryptocurrency Global Adoption Index 2022
| Country | Position in index | Rating by volume of centralized services | Rating by retail volumes of centralized services | Rating by trading volumes on p2p platforms | Ranking by incoming DeFi transfer | Ranking by inbound retail DeFi transfer |
| Vietnam | 1 | 5 | 5 | 2 | 7 | 6 |
| Philippines | 2 | 4 | 4 | 66 | 13 | 5 |
| Ukraine | 3 | 6 | 6 | 39 | 10 | 14 |
| India | 4 | 1 | 1 | 82 | 1 | 1 |
| USA | 5 | 3 | 3 | 111 | 3 | 2 |
| Pakistan | 6 | 10 | 10 | 50 | 22 | 16 |
| Brazil | 7 | 7 | 7 | 113 | 8 | 7 |
| Thailand | 8 | 12 | 12 | 61 | 5 | 3 |
| Russia | 9 | 8 | 8 | 109 | 11 | 12 |
| China | 10 | 2 | 2 | 144 | 6 | 4 |
| Nigeria | 11 | 18 | 18 | 17 | 20 | 17 |
| Turkey | 12 | 9 | 9 | 121 | 19 | 15 |
| Argentina | 13 | 13 | 13 | 26 | 21 | 25 |
| Morocco | 14 | 19 | 19 | 21 | 33 | 18 |
| Colombia | 15 | 23 | 23 | 10 | 27 | 29 |
| Nepal | 16 | 17 | 17 | 19 | 34 | 41 |
| Great Britain | 17 | 14 | 14 | 71 | 12 | 11 |
| Ecuador | 18 | 37 | 37 | 6 | 45 | 56 |
| Kenya | 19 | 43 | 43 | 5 | 9 | 34 |
| Indonesia | 20 | 16 | 16 | 129 | 18 | 13 |
Key takeaways from the Cryptocurrency Adoption Index 2022
Overall adoption slows globally in bear market conditions but remains above pre-previous bull market levels
Our data shows that in the last yearGlobal adoption levels have stabilized after a period of continued growth since mid-2019. We see this trend in the graph below, where we apply our index methodology to the world as a whole, summing up the quarterly performance of all 154 countries from Q2 2019 to date, and re-indexing that number to show how global adoption has trended over time .

Overall index for the 154 countries studied by quarter, 2019 Q2 to 2022 Q2
Global adoption of cryptocurrencies has reachedthe latest record high to date in Q2 2021. Since then, cryptocurrency adoption has come in waves, falling in the third quarter as market prices fell, rebounding in the fourth as it rallied to new all-time highs, and declining in the next two quarters as we entered a bear market. However, it is important to understand that overall global adoption remains well above levels seen before the 2019 bull market.
This suggests that many of those whoattracted price increases in 2020 and 2021, remained in the crypto market and continue to invest a significant part of their funds in digital assets. This is also in line with our previous data showing that crypto markets have been surprisingly resilient in recent downturns. Large long-term hodlers continued to hold onto their cryptocurrencies in the bear market as well, and on-chain data suggests that this class of holders is generally bullish on the prospects for a recovery, keeping market fundamentals relatively healthy.
Emerging Markets Dominate Global Crypto Asset Adoption Ranking
The trend we noted last year inthis year has only intensified: emerging markets dominate the index. The World Bank classifies countries into one of four categories based on income levels and overall economic development: high income, upper middle income, lower middle income, and low income. Using this classification, we found that the middle two categories dominated the top of our index. From the top 20 countries in our ranking:
- ten with lower middle incomes: Viet Nam, Philippines, Ukraine, India, Pakistan, Nigeria, Morocco, Nepal, Kenya and Indonesia;
- eight with upper middle incomes: Brazil, Thailand, Russia, China, Turkey, Argentina, Colombia and Ecuador;
- two high-income countries: the United States and the United Kingdom.
As we will see later in the report, users inLower and upper middle income countries often rely on cryptocurrencies to send remittances, maintain their savings during fiat currency volatility, and meet other financial needs unique to their economies. Users from these countries are also more likely to rely on Bitcoin and stablecoins compared to residents of other countries. In the coming years, it will be interesting to see what solutions the cryptocurrency industry can offer to increase the adoption rate of cryptoassets in high and low income countries.
Vietnam holds first place, US climbs to fifth, China returns to top ten
There are a few individual countries whose ratings stand out from the rest.
Vietnam ranks first for the second year in a rowon the level of acceptance of cryptocurrencies. The sub-index values show that Vietnam is showing extremely high purchasing power and adoption (adjusted by population) of centralized, DeFi and p2p crypto-currency instruments. Other sources also note the craving of the Vietnamese for cryptocurrencies. A 2020 survey found that 21% of Vietnamese consumers reported using or owning cryptocurrencies, second only to Nigeria at 32%, and since then, the adoption rate of cryptocurrencies in Vietnam appears to have only grown. According to local media reports, games based on cryptocurrencies, including play-to-earn (P2E) and move-to-earn (M2E) models, are especially popular in this country. This applies not only to user interest, but also to developers: the developer of the most profitable P2E game in the world, Axie Infinity, is based in Ho Chi Minh City, and its success has inspired many startups in the field of cryptogaming.
The United States has risen to fifth place in ourranking from eighth in 2021 and sixth in 2020. The U.S. is in the top three in every sub-index, with the exception of p2p exchange usage adjusted for population and purchasing power, where it ranked only 111th. This is generally not surprising as our research shows that p2p usage tends to be more common in countries with low purchasing power. Perhaps the most interesting thing here is that the US is by far the leader in cryptocurrency adoption among developed countries and one of only two countries in this category in the top 20 of our index, along with the UK. The reasons for this will be discussed later in the section on North America.
Finally, China this year re-entered the toptop ten of the index after 13th place in 2021. Our sub-indices show that China scored highest in the use of centralized services, ranking second in terms of purchasing power-adjusted transaction volume both overall and in retail category transactions. This is interesting, given the Chinese government’s ban on any cryptocurrency-related activity in the country, including both mining and trading. Our data shows that while the ban initially caused a significant downturn in activity around cryptocurrencies, there has been a notable rebound in the Chinese market in recent months, suggesting ineffective or weak enforcement of the ban.
Bear Markets Can't Undo Growth in Adoption During Bull Trend Periods
As we noted above, although with the beginning of the currentbear market growth has become more sporadic, global adoption remains well above pre-2020 bull market levels. The data suggests that a critical mass of new users investing in cryptocurrencies during periods of rising prices tend to remain in the crypto market even when it declines, which has so far allowed the ecosystem to grow steadily from one market cycle to the next. One of the reasons for this may be the value that users in emerging markets receive from cryptocurrencies. These countries dominate the adoption index, in large part because cryptocurrencies provide unique tangible benefits to people living in unstable economic conditions.
North America
Cumulative indicators of cryptocurrency activity in North America

The value of cryptocurrencies received by North America compared to the rest of the world

North America: countries by value of received cryptocurrencies

Volumes of crypto-currency transfer of the region by the size of transactions

The total cost of an incoming cryptocurrency transfer for different regions by type of service
Cryptocurrency markets in North America: strong but volatile, dominated by DeFi
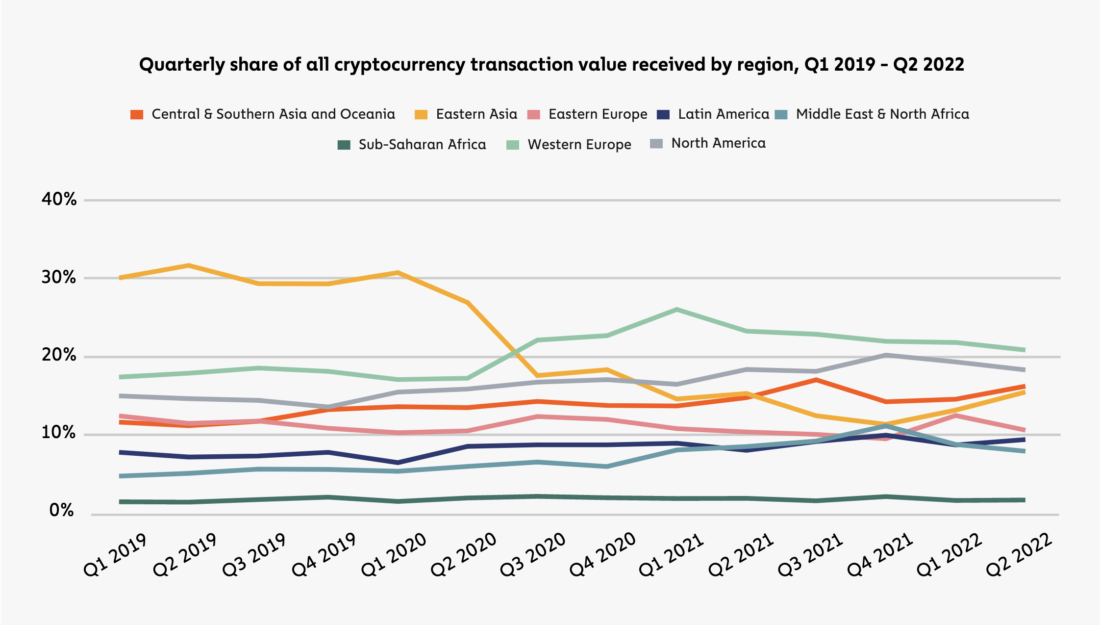
North America is the secondlargest crypto market in our study, with $1.15 trillion in inward crypto transfer from the region from July 2021 to June 2022, or 19% of global activity over that period. The vast majority of this volume is in the United States.

Shares of regions in the total volume of the global cryptocurrency transfer
North America became the second largestcrypto region after the recession in East Asia in mid-2020, and recently DeFi has significantly increased the overall level of crypto activity in the region. Between July 2021 and June 2022, DeFi accounted for 37% of all cryptocurrency transactions in North America, more than any other region. Western Europe ranks second in this indicator (31%), while in other regions, such as sub-Saharan Africa, the share of DeFi is only 13%.
DeFi is still an area wheremany of the most cutting-edge cryptocurrency projects, and tend to seek to enter the North American and Western European markets first. To learn more about this dynamic, we spoke with Matt Van Buskirk, formerly Head of Compliance at Circle and now co-founder and CEO of cryptocurrency startup Hummingbird. “Centers like New York and London have a lot of talent and academic interest, so you can see a lot of blockchain projects coming from those regions,” says Matt. “I consult with people who have great projects in Latin America, for example, but find it harder to find talent and funding without going to places like Silicon Valley.”
Additionally, many DeFi use cases,such as «profitable farming» (DeFi farming) and trading of new tokens on decentralized exchanges (DEXs) are highly speculative, which naturally attracts investors who have either already built up significant cryptocurrency holdings or already have capital to play with. Such investors are more likely to be found in developed markets in North America and Western Europe and less likely to be found in emerging markets.
But as of today, the bear market seems to beweakened the cryptocurrency markets of North America - both DeFi and CeFi - just as in other regions. Let's take a closer look at what the past year looked like for crypto usage in North America.
How DeFi dominance is shaping the ebb and flow of the North American cryptocurrency markets

Share of the region's total crypto transfer volume: DeFi (blue) and CeFi (orange)
The DeFi adoption rate in North America is higher than any other region, which has also led to the largest decline in Bitcoin dominance over the past year in that region.

Decline in Bitcoin dominance year-on-year by region: July 2020 – June 2021 vs. from July 2021 – June 2022
But DeFi is a pretty broad term. And which use cases are driving DeFi adoption in North America the most?

Comparison of DeFi sub-categories in North America: total incoming transfer volume (Y-axis), number of transactions (X-axis), and web traffic (circle size)
The answer depends on how you look at things.DEXs lead in terms of total value received, but lag far behind NFTs in terms of website traffic and transfer volume. It can be assumed that NFTs are leading in terms of mass adoption and, as we wrote in a recent study, are attracting the attention of newcomers to the cryptosphere. DEXs, on the other hand, with their advantage in transaction size and total transfer volume, seem to be used more by professional and even institutional players.
The disproportionately widespread adoption of DeFi inNorth America has seen the region’s crypto market behave differently than the rest of the world over the past year, often with sharper fluctuations in activity. Take a look at the charts below that show quarterly changes in total transaction volume for North America and the rest of the world, broken down by DeFi and centralized exchanges.
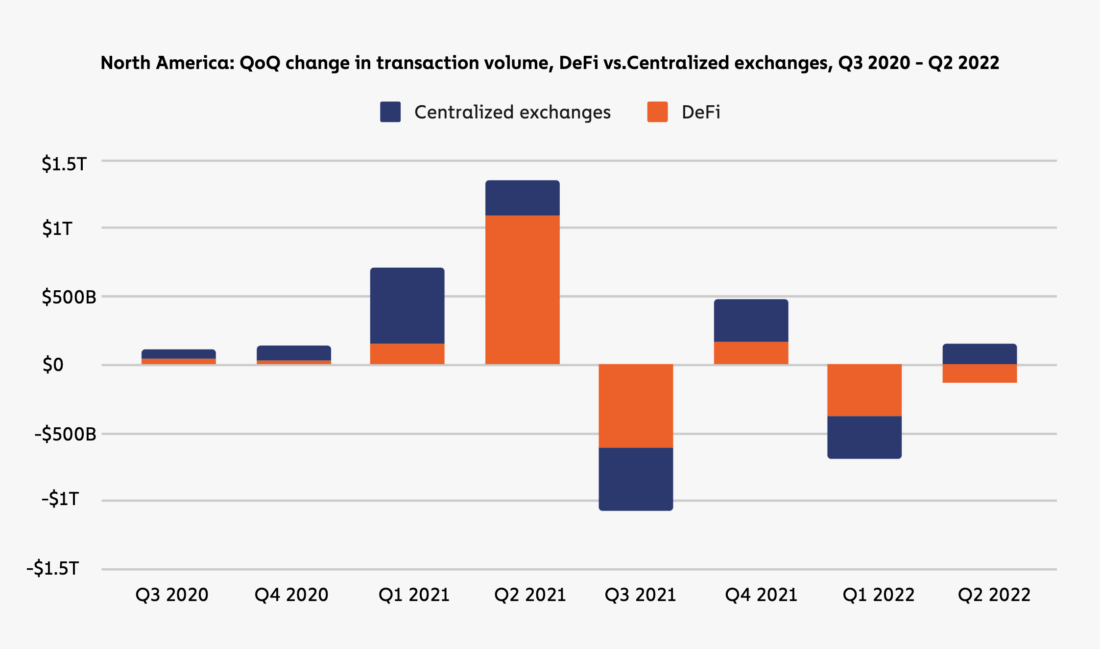
North America: Quarterly Change in Transaction Volume, DeFi and Centralized Exchanges

Rest of the World: Quarterly Change in Transaction Volume, DeFi and Centralized Exchanges
The charts above show that in mostquarters, activity in North America moved at a faster pace than the rest of the world, driven largely by fluctuations in DeFi usage. At times, this effect has been enough to cause transaction volume in North America to move in the opposite direction of the rest of the world. For example, in the second quarter of 2022 in the «rest of the world» There was an increase in the total volume of transactions, provided primarily by centralized services. North America also saw an increase in centralized services activity, but this was offset by a huge drop in DeFi activity. Overall, the data suggests that when the market was strong and inflows were positive in the second half of 2021, transaction volume in North America grew even more as the region's investors were more attracted to the high-yield opportunities in DeFi. Similarly, when the market fell in 2022, North American investors were more willing to exit the DeFi sector, which they view as riskier, which meant a more pronounced decline in activity.
What's Next for the North American Cryptocurrency Market?
Despite the volatility and risks of DeFi, the mostwell-known DeFi protocols have survived the bear market so far and continue to attract significant investment. Now the question is: what will be the next big innovation in cryptocurrencies? If previous trends continue, then it is likely to receive the largest initial distribution in North America and Western Europe.
It is also possible that these new projects will be lessspeculative. Matt Van Buskirk told us a little more: “With the market down, we are seeing more projects addressing real infrastructure problems in the financial sector and other areas: mortgages, identity, physical asset tokenization – I think we will see blockchain-based primitives around these. of things".
Latin America
Cumulative indicators of cryptocurrency activity in Latin America

The value of cryptocurrencies received by Latin America compared to the rest of the world

Latin America: countries by value of received cryptocurrencies]

Volumes of crypto-currency transfer of the region by the size of transactions

The total cost of an incoming cryptocurrency transfer for different regions by type of service
Major drivers of crypto adoption in Latin America: capital preservation, sending remittances and the search for alpha
Latin America is the seventh largestcryptocurrency market we are researching this year: from July 2021 to June 2022, citizens of Latin American countries received $562 billion in cryptocurrency transactions. This is 40% more than in the previous year period. Latin America also hosts five of the top thirty countries in this year's overall crypto index: Brazil (7), Argentina (13), Colombia (15), Ecuador (18) and Mexico (28).
In our analysis of the on-chain activity of users from Latin America, we identified three main use cases for cryptocurrencies:
- capital saving,
- sending money transfers,
- search for alpha (additional profitability compared to the market average).
Let's take a closer look at these three factors, as well as those countries in Latin America where each of them is most common.
Capital savings
In April, the International Monetary Fund establishedthat the combined inflation rate in the five largest economies in Latin America (LA5) - Brazil, Chile, Colombia, Mexico and Peru - exceeded 8%, a 15-year high. Four months later, they updated that estimate to 12.1%, a 25-year high. Meanwhile, in countries such as Venezuela and Argentina, things are even worse in this regard. These two countries have an annual inflation rate (at the time of writing) of 114% and 79% respectively, meaning their fiat currencies have lost about half their value over the past twelve months.
The last time inflation in LatinAmerica reached such a level that Bitcoin had not yet been invented. While Bitcoin's willingness to serve as a hedge against inflation, as many had hoped, seems debatable, stablecoins — crypto assets designed to remain pegged to the price of a fiat currency (usually the US dollar) — are the favorites in inflation-hit regions. In fact, recent survey data suggests that more than a third of Latin American consumers already use stablecoins for everyday purchases.
Below, we explore how citizens in two of the most inflation-prone countries in Latin America are using stablecoins to modernize their way of saving.
Spotlight: Venezuela
This year Venezuela was not included in the index,as there are no reliable and recent estimates of PPP per capita for this country. However, based on the World Bank estimate for 2014, Venezuela would have taken 11th place in the overall ranking.
And given the sharp decline in the country over the pasteight years and the growing adoption of cryptocurrencies, they could have ranked higher. The country's national currency, the bolivar, depreciated by more than 100,000% between December 2014 and September 2022. Venezuela also, despite the incredible devaluation of fiat currency, is still a growing cryptocurrency market in dollar terms. Last year, Venezuelans received $28.3 billion worth of cryptocurrencies. This year the figure was $37.4 billion, an increase of 32%.
Most of this volume is associated withstablecoins. Stablecoin transactions in Venezuela account for 34% of the total volume of small retail transactions, more than in any other country in Latin America. This is in good agreement with the thesis of capital savings as the main factor in the mass adoption of cryptocurrencies in Venezuela.
This economic instability can alsoto explain Venezuelans' addiction to play-to-earn blockchain games, some of which (for a short time) brought income in excess of the minimum monthly salary in Venezuela. As a result, this year Venezuela ranked second in the number of Axie Infinity players of all countries, just behind the Philippines, which ranked 2nd in the overall Global Crypto Adoption Index this year. Brazil, the next most active Latin American play-to-earn community, has the fifth largest player base of Axie Infinity.
Spotlight: Argentina
Argentina was faced with an inflation problemthroughout most of the twentieth and twenty-first centuries. During the Latin American debt crisis of the 1980s, when the conflict was particularly acute, Argentina's inflation rate briefly exceeded 3,000%. Therefore, as Rodolfo Andragnes, founder of ONG Bitcoin Argentina, explains, “Argentines are used to buying dollars and literally storing them under the mattress.” And therefore, almost every high-level purchase is paid in US dollars. “To buy a house, you bring $400,000 in physical dollars and pay cash. There are no 30-year loans or anything like that.”
But the Argentine government applies strictcontrol over the movement of capital, which makes it difficult to accumulate savings. Citizens can exchange pesos from their bank accounts at the official rate of 165 pesos to the dollar, up to $200 per month. While on the black market, where most of the country's foreign exchange transactions take place, the unofficial exchange rate, Dólar Blue, is around 315 pesos to the dollar. This has prompted many Argentines to be creative about keeping the money they earn.
One popular solution is stablecoins.Why? Because “psychologically, Argentines use cryptocurrencies for security,” says Sebastian Serrano, CEO of Argentine-based crypto payment company Ripio. “That’s why you can see such a wide use of stablecoins here – because it’s a good digital alternative to holding physical dollars.”
On-chain data shows the popularity of this use case, especially in Venezuela and Argentina.

Share of stablecoins in the total volume of small retail (<$1 thousand) crypto transactions
More than 31% of the total volume of small retailof crypto transactions in Argentina is the sale of stablecoins, compared to 26% in Brazil and 18% in Mexico. These stablecoins - especially USDT, USDC and USDD - have become popular in Argentina for three simple reasons:
- Theypegged to US dollar, which is the currency of choice for many Argentines;
- Theydigital, which means they are easily accessible on various devices; and
- in themno purchase limits, which means that Argentines can convert any amount of pesos into stablecoins.
Although Argentines may not get a better exchange rate for fiat currency to stablecoins than to the blue dollar, it at least creates some sense of stability after conversion.
Alternative economy and community
One of the by-products of long-termArgentina's economic instability is that it has become one of the most active blockchain communities in all of Latin America. “We have a large number of people working in crypto-currency projects and get paid in crypto too,” says Andragnes. This is especially true for Buenos Aires, where many of the biggest players in the crypto industry live and where the biggest events take place. For example, MakerDAO and Chainlink each have several key developers in the city and LABITCONF, the largest Bitcoin conference in Latin America, attracts thousands of participants and speakers to Buenos Aires every year, up to Vitalik Buterin, founder of Ethereum, and Elizabeth Stark, CEO and co-founder of Bitcoin. lightning network.
Sending money transfers
Money transfers are also common throughoutLatin America. The official Latin American money transfer market is estimated to reach $150 billion this year, and adoption of crypto money transfer services across the region is uneven but fast. Salvadoran official payment app Chivo processed $52 million worth of bitcoin money transfers between January and May of this year; and, as we will explore further below, cryptocurrency services have also processed billions of dollars of money transfers to Mexico.
Let's take a closer look at arguably the largest cryptocurrency remittance corridor in the world: the US-Mexico border.
Spotlight: Mexico
According to Felipe Vallejo, director ofUnder the regulation of Mexico’s largest crypto exchange, Bitso, a large percentage of Mexico’s lowest socioeconomic families receive remittances from family members working abroad, and the crypto industry’s share of this $51.6 billion market is growing rapidly. As of June, Bitso alone has already processed more than $1 billion in remittances from the US to Mexico in 2022, which means a growth of 400% and capture 4% of the Mexican money transfer market.
Coinbase gives you the opportunity to earn andtraditional cross-border payment providers such as Western Union. In February 2022, Coinbase announced the launch of cryptocurrency cash-out services at 37,000 locations nationwide, including department stores, supermarkets and all 20,000 branches of Oxxo, Mexico's largest convenience store chain.
Search for alpha
Finally, we found that citizens of the largest andThe most developed economies of Latin America more often use cryptocurrencies not only for savings, but also for making a profit. As shown in the chart below, LA5 ranks top six in terms of DeFi share of total cryptocurrency transactions. This means that a large number of users in these countries use open public protocols that allow them to lend, trade, «stake» and borrowing a wide variety of tokens is a speculative activity that carries significant risks and upside potential.

The share of DeFi in the volume of cryptocurrency transfers of the ten largest countries in Latin America
The most DeFi-focused cryptocurrenciesLatin American markets are no different from those of Western Europe or North America, where market participants adopt advanced yield-oriented crypto platforms much more willingly than centralized capital-saving services. Brazil is one of the leaders in the region in terms of DeFi adoption and adoption.
Spotlight: Brazil
According to Thomas Fortes, head ofcryptocurrencies in Nubank, one of the world's largest digital banking platforms, which recently launched a cryptocurrency trading platform, in Brazil, cryptocurrencies are now used mainly for speculative investments. “Clients are looking to increase the return on their savings,” he explains. “Interest rates in the country are at an all-time low, plus a significant increase in the price of cryptocurrencies seems to have contributed, but one way or another, the adoption of cryptocurrencies has continued even into the so-called crypto winter.”
“The number of new retail users incryptocurrencies grew much faster than the stock market. It took several years to grow to several million stock investors,” Fortes notes. Nubank reached 1 million users in just a month after launching its crypto platform. “It's not just institutional capital or wealthy people. The democratization of access means widespread adoption by retail users. We at Nubank have developed a cryptocurrency trading experience that helps users overcome the difficulty barriers that are typical for niche crypto brokers.”
We can see some evidence of thisadoption by retail users and on-chain. Compared to other countries in Latin America, in Brazil, a large share of the total volume is accounted for by retail-sized transactions. And trading activity on Mercado Bitcoin, one of the largest Brazilian crypto exchanges, illustrates this trend.

The share of transactions of various sizes in the total volume of cryptocurrency transfer: Mercado Bitcoin (Brazil) (blue) vs. with other Latin American services (orange)
As can be seen from the above diagram, smallRetail (<$1K), Large Retail ($1K - $10K) and Professional ($10K - $1M) transactions account for a much larger share of total trading volume on Mercado Bitcoin than the rest of Latin America.
Variety of use cases
In general, according to on-chain data and interviews withIt can be said by service operators in the region that the adoption of cryptocurrencies in Latin America occurs for various reasons, depending on the unique needs of each country. Users in countries with weak economies typically use cryptocurrencies for remittances and, in the event of high inflation, for savings, while users in more developed markets such as Brazil treat cryptocurrencies as more of a speculative investment. With the development of cryptocurrencies and the likely change in the needs of Latin American users, it will be interesting to see what other use cases will emerge to meet their needs.
Central, Northern and Western Europe
Aggregate indicators of cryptocurrency activity in Central, Northern and Western Europe

The value of cryptocurrencies received by Central, Northern and Western Europe compared to the rest of the world

Central, Northern and Western Europe: countries by value of received cryptocurrencies

Volumes of crypto-currency transfer of the region by the size of transactions

The total cost of an incoming cryptocurrency transfer for different regions by type of service
Central, Northern and Western Europe remains the world's largest crypto economy thanks to the rise of DeFi, NFT and regulatory clarity
Central, Northern and Western Europe (CNWE) -still the largest crypto-economy in the world. From July 2021 to June 2022, individuals and organizations in the region received $1.3 trillion worth of cryptocurrencies, and Western Europe alone is home to six of the 40 countries with the most widespread adoption of cryptocurrencies: the UK (17), Germany (21), France (32), Spain (34), Portugal (38) and the Netherlands (39). A huge share of this activity came from DeFi, as EU regulations such as the crypto travel rule and the MiCA licensing regime provided greater regulatory clarity.
Most of the ten largestcryptocurrency markets CEEC on-chain activity increased by 1-30% compared to the previous year. But two countries stand out: Germany, with a 47% increase, and the Netherlands, with a 3% decline in cryptocurrency activity.

Growth in the volume of cryptocurrency transactions year-on-year in the top ten CEEC countries
The strongest growth in Germany was probablya side effect of two recent decisions: (1) introducing a 0% tax on long-term capital gains and (2) allowing a variety of asset managers to invest in cryptocurrencies. Chainalysis data suggests that these actions have fueled both retail and institutional adoption. Dutch regulators, on the other hand, have taken a more cautious stance.
In smaller CEWE countries, changes inon-chain activities vary to a much greater extent. At opposite extremes are Estonia, whose cryptocurrency activity jumped by 76%, and Malta, with a halving over the study period.

Growth in the volume of cryptocurrency transactions year-on-year in the CEEC countries in addition to the top 10
Malta in the annual period studied from July 2021to June 2022 faced increased competition from the Bahamas and Bermuda, as well as jurisdictions such as Abu Dhabi and Dubai, which have stepped up their efforts to attract crypto startups. However, «blockchain island» still has one of the most comprehensive regulatory frameworks in the world. Estonia, meanwhile, has made rapid progress in its quest to become Central Europe's premier crypto hub, and since May 2022 has placed particular emphasis on mitigating the risks of money laundering, extortion and «infection» market.
The UK is the largest DeFi market in Europe
This year, the UK ranked 17th inGlobal Cryptocurrency Adoption Index, up from 21st a year earlier. And in terms of total transaction volume, the UK ranks 1st in the CEEC and 6th in the world, having received $233 billion worth of cryptocurrencies from July 2021 to June 2022.

Central, Northern and Western Europe: countries by value of received cryptocurrencies
Much of this activity has been related to DeFi. This year almost 20% of web traffic to NFT and loan contracts sites in the entire CEEC came from the UK.
The UK crypto market is also unique in thatthat it was the only one of the top five Western European countries between July 2021 and June 2022 that grew in the number of on-chain transactions made by its citizens every quarter.

Index: Quarterly Growth in Cryptocurrency Transactions for Top Five CEEC Countries
This suggests that the rate of adoption of cryptocurrenciesin the United Kingdom were more sustainable than in other CEEC countries. “I'd like to think it's because we've tried to provide certainty about the regulation and taxation of cryptocurrencies in the UK,” says Dion Seymour, CTO of Cryptocurrency and Digital Assets at Andersen LLP and a former policy adviser at HMRC. UK tax authority. “No one wants cryptocurrencies to be taxed, but the uncertainty about their taxation can also cause some concern.”
Another important barrier to the adoption of cryptocurrencies,one that Seymour believes the UK has yet to overcome is inadequate consumer protection: “Consumer protection is absolutely essential if we want DeFi to go mainstream. This year we will continue to talk a lot about this with politicians, the World Bank, the World Economic Forum, the OECD, the UK Treasury, the FCA and, obviously, the tax authorities.”
NFT as the main driver of DeFi activity in Central, Northern and Western Europe
DeFi is also popular in other CEEC countries, andNFT platforms are paving the way for widespread adoption of cryptocurrencies, driving the most web traffic in the region compared to any other type of DeFi protocol. This is especially true in Ireland and Norway, where NFT marketplace traffic accounts for over 70% of all DeFi-related web traffic.
The second most visited DeFi category in the CEEC was blockchain games, followed by France, Italy and Spain. In these three countries, over 30% of web traffic was related to the metaverse.
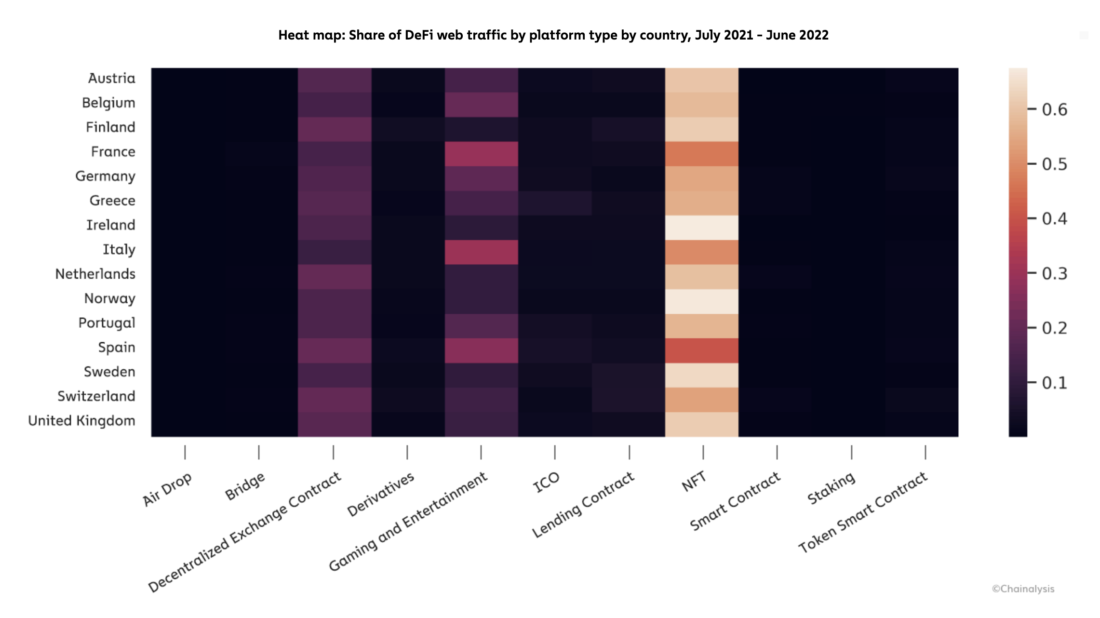
Heatmap: Share of DeFi web traffic by platform type and country
On the front line
In addition to being the world's largestcrypto market, it has always been at the forefront of crypto innovation, and the level of DeFi adoption in the region is a great example of this. With the advent of new crypto-currency technologies and their use cases, it will be seen whether the CEEC will retain its status as an early adopter of them.
Eastern Europe
Total indicators of cryptocurrency activity in Eastern Europe

The value of cryptocurrencies received by Eastern Europe compared to the rest of the world

Eastern Europe: countries by value of received cryptocurrencies

Volumes of crypto-currency transfer of the region by the size of transactions

The total cost of an incoming cryptocurrency transfer for different regions by type of service
The Eastern European cryptocurrency market is active, and surges in it over the past year are caused by the armed conflict between Russia and Ukraine
Eastern Europe is the fifth largest ofThe cryptocurrency market we studied received $630.9 billion in transactions between July 2021 and June 2022. This represents just over 10% of global cryptocurrency transfers during the same period.

Shares of regions in the total volume of the global cryptocurrency transfer
Comparative share of Eastern Europe in the globalThe cryptocurrency market has remained surprisingly stable over the past few years, hovering around 10%. In other regions, however, there was greater volatility.
In this series of posts we talked in detail aboutthe role of Eastern Europe in global cryptocurrency crime. In particular, in this region we have historically seen a huge number of ransomware viruses. and money laundering, with the latter supported by a massive ecosystem of risky cryptocurrency businesses. Some of these companies, like over-the-counter broker Suex, have even been sanctioned by the US Treasury. However, risky and illegal activity still makes up a significant portion of the region's onchain activity: high-risk exchanges (with little or no KYC) account for 6.1% of Eastern Europe's cryptocurrency transfers, compared to just 1.2% for the next largest. this regional indicator. In fact, if you combine addresses associated with risky and illegal activities into one category, it is clear that users from Eastern Europe interact with them much more often than residents of other regions.

Percentage of risky and illegal cryptocurrency activity by region
Note:illegal activity refers to transactions in which one or more counterparty addresses are associated with criminal wallets. Risky activity includes transactions in which counterparty addresses are associated with a risky network entity, such as a high-risk exchange or a service headquartered in a high-risk jurisdiction.
18.2% of all crypto transfers received by Eastern Europe came from addresses associated with risky or criminal activity, more than in any other region.
Changes in the market and the role of cryptocurrencies in the armed conflict between Russia and Ukraine
Of course, the biggest event in Eastern Europe last year was Russia's military operation in Ukraine. It affected almost all aspects of life in both countries, and cryptocurrencies are no exception.
Shortly after the start of the military operation, the UnitedThe states and a number of other countries have begun imposing sanctions on Russian oligarchs and others associated with the Putin government. This, combined with the level of adoption in Russia of cryptocurrencies for both legal and illegal uses, has raised questions about whether Russians will (and to what extent) try to use cryptocurrencies to circumvent sanctions. Our research has shown that crypto markets are likely not liquid enough to be a vehicle for large-scale and systematic sanctions evasion. With this in mind, and that this index is primarily about the mass adoption of cryptocurrencies, here we will use on-chain data to analyze how cryptocurrencies have been adopted by the population of both countries in general, and not just the wealthy or sanctioned individuals.
After all, the war had seriouseconomic consequences for the citizens of both countries. Ukraine is experiencing extremely high inflation, with a New York Times article in July reporting a 90 percent rise in fuel costs and a 35 percent rise in food prices. In Russia, too, there were separate periods of high inflation, as well as significant difficulties in international trade, including due to limited access to the SWIFT interbank network. In this context, let's see how the use of cryptocurrencies in Russia and Ukraine has changed since the start of the military operation. One can immediately note the initial increase in cryptocurrency transfers in both countries in March 2022.

Eastern Europe: monthly volumes of cryptocurrency transfers by country
However, after that, the trends diverge.In Russia, the volume of transactions continued to fluctuate in a relatively narrow range in the following months. In Ukraine, on the other hand, the entire study period since March has seen a steady increase in cryptocurrency transfers. It is possible that the level of cryptocurrency activity of Russian users could be affected by the restrictions imposed by many services after the introduction of US and EU sanctions.
Of course, given the economic problems, withfaced by both countries, the overall transaction figures are not where we would expect to find the most telling trends. Most of these transactions are crypto-to-crypto transactions, but in an emergency or potential hyperinflation, you can expect people to be more focused on protecting or moving their fiat assets. We can estimate this at least in part by trading volumes denominated in ruble and hryvnia using order history data on two exchanges that accept these currencies: Binance and LocalBitcoins.

Monthly trading volumes for transactions denominated in rubles and hryvnias. exchange order data: Kaiko
Here the trend is even stronger, especially in March,immediately after the start of the military operation. This month, hryvnia-denominated trading volume grew by 121% to $307 million, and Russian ruble-denominated trading volume increased by 35% to $805 million. After this, we see a decline in volumes for both countries, increasing and decreasing, but never reaching March highs. The true extent of this activity appears to be much higher, as this is data from only two exchanges that accept fiat currencies from both countries, but we can still draw some conclusions from the directional trends.
We showed our data to Tatyana Dmitrenko,adviser to the Ministry of Finance of Ukraine and a member of the World Economic Forum Digital Assets Working Group, and asked her what use cases could explain the surge in trading cryptocurrencies for hryvnias. She drew attention to the introduction of foreign exchange controls by the Ukrainian government: "In connection with the introduction of martial law in Ukraine, the Ukrainian central bank has imposed restrictions on cash transactions, such as buying dollars or euros," she said. Shortly thereafter, transfers of foreign currency abroad were also limited, and Dmytrenko believes that some Ukrainians may have been looking for opportunities to exchange hryvnias for cryptocurrencies in response to these measures. She also noted that these currency controls were eased in July 2022, at which point we will see a decrease in the volume of trading cryptocurrencies for hryvnias.
To learn more about similar activity inRussia, we spoke to a regional money laundering expert who has worked with FIUs in Eastern Europe as well as several international organizations. He wished to remain anonymous, but allowed him to be quoted on how to interpret these data in the light of what he observed in Russia after the start of the military operation.
“The main issue not only for the oligarchs, but alsofor many ordinary Russians, the question arose of how to withdraw money from Russia,” the expert told us. “Many people started looking for new places where they could cash out their cryptocurrencies.” He named the UAE and Turkey as countries that Russians often relied on in the past, and also pointed to Kazakhstan and Georgia as countries that could at least partially meet the increased demand for such services after the start of the military operation. While such activity is difficult to accurately quantify, the number of visits from these countries to cryptocurrency service sites that cater primarily to Russian users can be a useful proxy. As you can see from the chart below, all four countries saw a surge in the number of visits to Russian cryptocurrency services after the start of the military operation.

Index: the number of visits from individual countries to the sites of predominantly Russian cryptocurrency services
The expert also spoke about the roleCryptocurrency can play in the financing of Russia's foreign trade after it is disconnected from SWIFT. In September, the Russian central bank finally agreed to legalize the use of cryptocurrencies for cross-border payments and international trade, and the expert suggested that, in his opinion, some Russian companies have already begun to carry out such transactions: “Probably somewhere this is already happening in small and medium scale, but can be much more widespread. The expert named China and Iran as possible trading partners in such a scheme, noting that the latter is already experimenting with payments in cryptocurrencies for imports. He also suggested that stablecoins are likely to be the preferred medium of exchange for this use case, as they are not subject to the same price volatility as other crypto assets, including bitcoin. Our data shows that the use of stablecoins in Russia has indeed increased since the beginning of the military operation.

Shares of various types of assets in the total volume of transactions on predominantly Russian cryptocurrency services
In January, stablecoins accounted for 42% of the totalthe volume of transactions on predominantly Russian cryptocurrency services. After the start of the military operation, this share rose sharply to 55% in February and 67% in March. While some of this may be due to the use of cryptocurrencies by companies for international transactions, part of the growth, as mentioned above, may also be due to the fact that ordinary Russian citizens buy stablecoins to withdraw or protect their capital.
Schemes like «crypto-for-import» putnew questions regarding the effectiveness of financial sanctions against countries such as Russia. But, as usual, all parties are trying to take advantage of the opportunities offered by technology - Ukraine for large-scale fundraising campaigns around the world, Russia for circumventing sanctions.
Central and South Asia, Oceania
Aggregate indicators of cryptocurrency activity in the countries of Central, South Asia and Oceania

The cost of cryptocurrencies received by the countries of Central, South Asia and Oceania, in comparison with the rest of the world

Central and South Asia and Oceania: countries by value of received cryptocurrencies

Volumes of crypto-currency transfer of the region by the size of transactions

The total cost of an incoming cryptocurrency transfer for different regions by type of service
Cryptocurrency adoption is slowing in South Asia and skyrocketing in Southeast
Central, South Asia and Oceania (CSAO) - thirdthe largest cryptocurrency market in our index this year, with incoming transaction volume of $932 billion during the study period. CSAD also includes seven of the top 20 countries in this year's index: Vietnam (1), Philippines (2), India (4), Pakistan (6), Thailand (8), Nepal (16) and Indonesia (20).
Later in this section, we will analyze the mainfactors promoting adoption and major barriers to the spread of cryptocurrencies in these countries. But first, let's take a look at the figures for CAAO as a whole.

Central and South Asia and Oceania: countries by value of received cryptocurrencies
India remains the region's leader in unweightedvolume of cryptocurrency activity, receiving $172 billion in transactions over the study period. Thailand, Vietnam, Australia and Singapore follow closely behind, all with more than $100 billion in incoming cryptocurrency transfers. Less involved in the cryptocurrency market are Central Asian countries such as Uzbekistan, and island states of Oceania like the Maldives.

The total cost of an incoming cryptocurrency transfer for different regions by type of service
As in other regions, mostof crypto-currency transactions of SAO are accounted for by centralized services. In terms of DeFi transaction volumes, the region is in the middle of the list. But the data gets more interesting when it comes to what is driving DeFi adoption in the region.
For example, web traffic patterns indicate thatthat NFTs appear to be the main entry point into the DeFi market for CSAO. In the second quarter of 2022, 58% of DeFi-related web traffic from CSAO users was related to DeFi, another 21% was related to play-to-earn blockchain games.

Shares of different types of services in total DeFi-related web traffic
Play-to-earn games and non-fungible tokensare closely related. In most blockchain games today, in-game items are released in the form of NFTs—like pets in Axie Infinity or sneakers in STEPN—that can be resold on various NFT marketplaces like MagicEden or OpenSea. In countries with high web traffic to NFT marketplaces—particularly in Thailand, Vietnam, and the Philippines—a significant portion of this traffic can come from blockchain game players.

Heatmap: Share of DeFi web traffic by platform type and country
As you can see from the heatmap above, almost everyIn CASA, NFT sites account for the majority of DeFi-related web traffic, but in most of these same countries, blockchain games and entertainment account for the second largest share.
This is not surprising:CSAO is the hub of blockchain-based entertainment innovation. For example, blockchain game developers Polygon and Immutable X are headquartered in India and Australia, while Axie Infinity and STEPN, the two largest play-to-earn games, are headquartered in Vietnam and Australia, respectively.
However, traffic to sites related, for example,with decentralized exchange contracts, has declined in recent quarters. This seems to be related to the bear market in general. Manan Vora, Senior Vice President of Operations and Strategy at Liminal, a Singapore-based wallet infrastructure provider, confirms this point: “Failures of major projects, of course, undermine the credibility of the crypto market as a whole. When one of the ten largest coins drops to zero in a matter of days, it is difficult to keep those who have just entered it in the market. You can lose these users forever.”
Now, having considered the crypto-currency markets of the Central South Administrative District as a whole, let's take a closer look at the most active countries in the region.
Play-to-earn games and money transfers as drivers of rapid adoption in Vietnam and the Philippines.
Vietnam leads our index for the second year in a rowacceptance of cryptocurrencies. The Philippines, meanwhile, made a giant leap, climbing from 15th place to second. The main factors for the adoption of cryptocurrencies in these countries are similar: these are play-to-earn (P2E) blockchain games and money transfers.
We have already talked about the first of them, P2E games,but one cannot fail to note separately the huge scale of P2E penetration in these two countries. An estimated 25% of Filipinos and 23% of Vietnamese citizens played play-to-earn games, and at one point, Filipinos made up 40% of Axie Infinity players. Meanwhile, Axie Infinity developer Sky Mavis is based in Vietnam.
At the same time, Vietnam and the Philippines arealso large markets for remittances: incoming remittances account for 5% and 9.6% of the GDP of these countries, respectively. According to Manan Vor, cryptocurrencies — especially stablecoins — fill the gap when recipients have limited access to banking services, while money transfer services such as Western Union charge high fees. "It makes sense. Why pay 3% to a bank intermediary and wait two days for the transfer to reach when USDT or USDC can be transferred in a minute and almost without commission?
The same thesis about remittances applies toother countries of Central South Administrative District. Pakistan, India and Bangladesh each have remittance markets worth more than $20 billion, and blockchain-based payment providers are beginning to displace traditional intermediaries. Some of these payment rails are even built in coordination with government agencies, such as Pakistan's central bank's work with Alipay. Typically, these transfers are made using stablecoins, which preserves the dollar value in transit.

Shares of each of the largest crypto-markets of the Central South Administrative District by type of assets
As seen in the diagram above, stablecoins andETH/wETH are the two most actively traded asset types in many of the CSAO countries, consistent with an adoption model focused primarily on remittances and NFTs.
Regulation of cryptocurrencies in India and Pakistan may reduce market activity, but not the pace of innovation
In the overall cryptocurrency adoption index for 2021India and Pakistan ranked second and third respectively. In 2022, they dropped to fourth and sixth places. The reasons, apparently, lie in the changes in legislation that have occurred during this time.
India
April 1st, 2022 Indian governmentimposed a 30 percent tax on any income from crypto assets, with no opportunity for users to compensate for their losses. Later, on July 1, the government also introduced a 1% transaction deduction at source, meaning Indian cryptocurrency users must pay an additional 1% fee on every transaction from then on. “This has led to a big brain drain out of the country,” Vora says, “first to Singapore and now to Dubai. Because even if your business is market making, now it is actually treated like a lottery.
Vikram Rangala, director of Indian crypto exchange ZebPay, helped us look at these new rules from a government perspective. For them, as he explained, it is about consumer protection:
“From the dialogues that I and my colleagues had,people in the Indian government, including members of parliament, are not anti-cryptocurrencies per se. Some are even more supporters. But they are concerned that their constituents are trading in volatile assets without sufficient information. A twenty-five-year-old young man who has saved money for a wedding or to provide for a family can invest in some kind of meme-coin and lose everything. No statesman can publicly support something so risky for most people. Wealthy people can survive such losses, but, for example, a cleaner, a farmer or a rickshaw driver cannot.”
And according to Rangal, the pace of cryptocurrency innovation in India is unabated:
“There are dozens of crypto projects in India workingin the areas of establishing property rights, access to tickets and subscriptions, helping to monetize the work of rural artisans, and even giving token holders the opportunity to skydive with a movie star in Dubai, and much more.”
Pakistan
In January of this year, the central bank andThe government of Pakistan has recommended a ban on cryptocurrencies. Since then, the federal government has formed three subcommittees to further discuss the issue and ultimately propose its own policy on cryptocurrencies. It is not yet clear whether the current policy will be as restrictive as the total ban proposed earlier.
Other issues make adoption even more difficultcryptocurrencies in Pakistan. Since 2018, the country has been on the «gray list» FATF, which limits its ability to receive international financial assistance and strengthens the government’s negative attitude towards cryptocurrencies. State Bank of Pakistan (SBP) Governor Reza Baqir said in February that the potential risks associated with cryptocurrencies «far outweigh the benefits» and called «expansion of the gray economy» and «capital flight» key problems for the country.
Given the recent civil unrest inPakistan - The former prime minister was indicted under the country's anti-terrorism law but remains one of Pakistan's most popular political leaders - Bakir's fears of capital flight could prove prophetic. Vikram Rangala puts it this way: “Looking at the example of Venezuela and Argentina, I think anyone who is in a country with a not very stable economic situation begins to see cryptocurrencies as an opportunity.”
East Asia
Total indicators of cryptocurrency activity in East Asia

The value of cryptocurrencies received by East Asia compared to the rest of the world

East Asia: countries by value of received cryptocurrencies

Volumes of crypto-currency transfer of the region by the size of transactions

The total cost of an incoming cryptocurrency transfer for different regions by type of service
Cryptocurrency market growth in East Asia has stalled, the Chinese market has fallen, but has not left the game after the introduction of government bans
East Asia is the fourth largestcryptocurrency market we examined received $777.5 billion in transactions between July 2021 and June 2022, representing just under 13% of global cryptocurrency transaction volume during the same period. East Asia has lost ground to other regions this year, with the region ranking third in terms of cryptocurrency transaction volume in last year's report. This year, the volume of cryptocurrency transactions in East Asia grew by only 4%, which is the lowest of all the regions we analyzed.

Growth in the volume of cryptocurrency transactions year-on-year by region
The main reason for this seems to be the decline in cryptocurrency activity in China, the largest market in the region.

Growth in the volume of cryptocurrency transactions year-on-year in East Asia
Although China remains the largest cryptocurrencymarket in the region, the volume of its cryptocurrency transactions decreased by 31% compared to the previous year, while in neighboring countries such as Japan, this figure more than doubled. This seems to be due to the Chinese government’s bans on mining and cryptocurrencies in the country over the past year.
The data also point to surprisingly lowDeFi adoption rate in East Asia. In fact, DeFi accounted for just 28% of East Asia’s cryptocurrency transaction volume over the year we studied, less than all but one of the other regions.

The share of DeFi in the total volume of cryptocurrency transactions for various regions
Next, we look at these and other trends to understand what is driving the East Asian cryptocurrency market.
DeFi Drives Rapid Growth in Japan's Cryptocurrency Market
As we noted above, the Japanese cryptocurrency marketincreased significantly in the year under review: the volume of on-chain transactions increased by 113.2% compared to the previous 12 months, compared with 72.4% growth for the next country (Mongolia), 13.2% for South Korea and a reduction of 31.1% for China. Why is that? One reason could be the relatively high adoption rate of DeFi in Japan.

Total incoming cryptocurrency transfers to CeFi and DeFi services in East Asia by country
With a smaller overall volume of the cryptocurrency market,Japan's DeFi transaction volume is almost double that of South Korea at $56.7 billion and is approaching China's $67.6 billion. To learn more about this, we spoke with Chainalysis advisory solutions architect Hayato Shigekawa of Tokyo. “DEX trading has become very popular in Japan,” says Hayato, citing the important role of platforms such as Uniswap, 1inch and TokenIon. Regarding the popularity of NFTs and the potential for their continued growth in Japan, he noted, “Many have noted that Japan has a lot of quality IP from anime, comics, and video games that could be used on Web3 in the future.” Chainalysis data confirms that these services have played a big role in the Japanese DeFi market.

Shares of various types of DeFi protocols in total inbound DeFi transfers in Japan
Interestingly, the data (PDF) on spot tradingoffchain data released by the Japan Virtual and Crypto Asset Exchange Association (JVCEA) suggests that DEX trading may be displacing trading on centralized services, which are not showing commensurate growth. Reported trading volume on centralized Japanese exchanges is down relative to 2020 and 2021, and the number of new account registrations in most months is between 30% and 40% of previous years. One reason trading volumes are shifting from centralized exchanges to DEXs may be the large number of assets on offer. “Centralized exchanges in Japan support about 60 crypto assets, and the process of listing new coins is lengthy and regulated,” says Hayato, and also notes that the list of available assets does not currently include stablecoins. With this in mind, it will be interesting to see how the use of DeFi in Japan changes as local cryptocurrency regulations evolve.
The Chinese market remains one of the strongest in the world, despite government bans
As we noted above, in China there isa significant decline in cryptocurrency activity, apparently due to government bans. They started by banning mining in May 2021, and in September of the same year they banned all transactions with cryptocurrencies in the country. “Activities related to virtual currencies are illegal financial activities,” the People’s Bank of China (PBoC) said in no uncertain terms.
However, despite the drop in volumetransactions by 31.1%, China remains the largest crypto market in the region, fourth in the world, and ranks tenth in terms of mass adoption of cryptocurrencies in our index. In addition, in recent months, trading activity has even begun to recover. This hardly reflects the total ban announced by the government, as well as the scathing statements of PBoC officials that followed.

China Monthly Incoming Cryptocurrency Transfer Volumes
Even mining, which was first targetedChinese government, and after the prohibition of which there was a significant decline, returned to China again. This is especially surprising when you consider that it should be easy for the government to identify the increased power consumption that accompanies mining and take appropriate action.

Bitcoin mining hashrate by country
Data show persistence in Chinarebellious spirit, characteristic of the early period of the development of cryptocurrencies. Government bans have definitely taken their toll, however, the Chinese cryptocurrency market remains strong, with healthy transaction volumes on both centralized and DeFi services.
Middle East and North Africa
Total indicators of cryptocurrency activity in the Middle East and North Africa

The value of cryptocurrencies received by the Middle East and North Africa compared to the rest of the world

Middle East and North Africa: countries by value of received cryptocurrencies

Volumes of crypto-currency transfer of the region by the size of transactions

The total cost of an incoming cryptocurrency transfer for different regions by type of service
Cryptocurrency markets in the Middle East and North Africa are growing faster than any other region in 2022
The Middle East and North Africa (MENA) maybe one of the smallest cryptocurrency markets in the 2022 rankings, but it is also the fastest growing. From July 2021 to June 2022, MENA users received $566 billion in crypto transactions, up 48% from the previous year.

Growth in the volume of cryptocurrency transactions year-on-year by region
MENA includes three of the top 30 countriesthis year's index: Turkey (12), Morocco (14) and Egypt (24). The use cases for cryptocurrencies related to capital savings and remittances, as well as the increasingly liberal regulation of the industry, help to understand why.
Cryptocurrency price fluctuations in Turkey and Egyptcoincided with the rapid devaluation of local fiat currencies, which increased the attractiveness of cryptocurrencies as a store of value in the eyes of users. The Turkish lira has depreciated by 80.5% over the past year, and the Egyptian pound by 13.5%. No less significant, however, is the Egyptian remittance market. Incoming remittances account for about 8% of Egypt's GDP, and the country's national bank has already begun a project to create a cryptocurrency «corridor» for money transfers between Egypt and the UAE, where many Egyptian citizens work.
Egypt's position at the intersection of growing volumescryptocurrency transfers and rising inflationary pressures explains why it has become the MENA region's fastest-growing cryptocurrency market this year. Egypt's incoming cryptocurrency transfer volume tripled between July 2021 and June 2022 compared to the previous similar period. Turkey, meanwhile, remains the region's largest cryptocurrency market, with its citizens receiving $192 billion during the study period, but the growth rate has slowed significantly compared to the previous year.

MENA Countries by Annual Growth Rate of Cryptocurrency Transactions
In Morocco, inflation was kept atmore acceptable level of 5.3%. In fact, the notable level of adoption of cryptocurrencies in the North African country seems to be more related to the easing of the stance of regulators than to any specific macroeconomic factors. In 2017, the Moroccan central bank said that any cryptocurrency transaction in the country would result in fines. But in 2022, they partnered with the IMF and the World Bank to create a new cryptocurrency regulation with a focus on innovation and consumer protection.
The Gulf Cooperation Council and the Rise of Institutional Adoption of Cryptocurrencies in MENA
As key business centers in the MENA region,the member countries of the Gulf Cooperation Council (GCC) - Saudi Arabia, Kuwait, the United Arab Emirates, Qatar, Bahrain and Oman - rarely make it to the top of our cryptocurrency adoption index, as we weight countries by purchasing power parity per capita, which favors poorer countries. However, their role in the crypto ecosystem should not be underestimated. Saudi Arabia, for example, is the third largest cryptocurrency market in the MENA, while the UAE is the fifth. But they also have deep connections to global crypto markets: in our sections on Sub-Saharan Africa and Central and South Asia, we see that Dubai has become a hub for crypto companies that serve clients across Asia and Africa, not just in the Middle East.

Middle East and North Africa: countries by value of received cryptocurrencies
As explained by Akos Ergé, Senior Manager forAccording to the government policy of the Dubai-based crypto exchange BitOasis, the main factors driving the adoption of cryptocurrencies in the GCC countries are different from those in the rest of the Middle East and North Africa. “For the GCC, we believe this adoption is driven by young and tech-savvy early adopters with relatively high disposable income who are looking for investment options and who are convinced of the promise of cryptocurrencies. In addition, adoption occurs not only on the side of retail users, but also in the ecosystem when banks and other financial institutions begin to work with companies like ours.” Hergé also highlighted the role of recent inflation in driving crypto adoption in other parts of the region.
Heavy Taliban Regulation Brings Afghan Cryptocurrency Markets to a Halt
One of the region's past leaders in mass adoption has since experienced a severe downturn: Afghanistan.
Afghanistan ranked 20th in overall acceptancein our 2021 index, but has dropped to the bottom of the list since the Taliban takeover last August. Under the rule of the Taliban, dozens of crypto dealers were arrested, and the ruling government body, the Ministry for the Propagation of Virtue and the Prevention of Vice, equated cryptocurrency with gambling and declared it haram.
We found that in August and September - immediatelyAfter the Taliban seized power, on-chain activity in Afghanistan underwent a temporary strong surge, after which it fell to an unprecedented level. From November 2021 to today, the monthly volume of on-chain transactions received by users in Afghanistan averaged less than $80,000—far less than the previous $68 million per month before the Taliban took power.

Afghanistan Monthly Incoming Cryptocurrency Transfer Volumes
The Taliban crackdown has had a huge deterrentimpact on the country's cryptocurrency markets. In the current environment, crypto dealers have three options: flee the country, cease operations, or risk arrest.
As to how legal orThe thwarted and ongoing crypto activity has been criminal in nature, an anonymous source familiar with the Afghan cryptocurrency market told us: “A small part of this ongoing activity is just young people who have a few hundred bucks to day trade.
But I would say that for most of thesevolumes, the only use I have seen is money laundering from illegal sources. Most of them are either bribes or drug money.”
As our source explained, the point is not thatCryptocurrencies cannot end up being more useful to the region—to become a means of payment for unbanked people, a store of value, or a means of payment. The problem is that this is extremely difficult to implement, especially given the small number of smartphone users and the underdeveloped cellular networks in Afghanistan.
“[Afghanistan] has been through so much that I canuse US dollars almost everywhere. Even if we are talking about a potato seller somewhere on the side of the road, I am 100% sure that he will take my dollar. Most likely, he will not give me change in dollars, but he will always accept them as payment, since people have an understanding of the volatility of currencies. A cryptocurrency solution could work, but planning the initiative always underestimates the severity of the obstacles. … There is such a difference between plan and reality that it usually just never works out.”
It seems that under the current Taliban regime, newCryptocurrency initiatives are unlikely as such, let alone successful, but those who manage to acquire cryptocurrencies secretly will be able to protect themselves from future economic shocks, as we have already seen in other countries.
Africa south of the Sahara
Cumulative indicators of crypto-currency activity in sub-Saharan Africa

The value of cryptocurrencies received by Sub-Saharan Africa compared to the rest of the world

Sub-Saharan Africa: countries by value of received cryptocurrencies

Volumes of crypto-currency transfer of the region by the size of transactions

The total cost of an incoming cryptocurrency transfer for different regions by type of service
How Cryptocurrencies Meet the Economic Needs of Sub-Saharan Africans
Sub-Saharan Africa accounts for the smallestCryptocurrency transaction volume across all regions we surveyed: $100.6 billion in incoming on-chain transfers between July 2021 and June 2022, representing 2% of global volume and 16% more than a year earlier.
Shares of regions in the total volume of the global cryptocurrency transfer quarterly
However, numbers can be misleading becausea deeper analysis shows that Africa hosts some of the most developed crypto markets of any region, with deep penetration and integration of cryptocurrencies into the daily financial activities of many users. We see this primarily in Nigeria and Kenya, ranked 11th and 19th in our overall cryptocurrency adoption index, respectively. In both countries, there is an active adoption of cryptocurrencies, taking into account the size and purchasing power of the population, especially on P2P exchanges, which, as experts also confirm in interviews, are of decisive importance for the crypto-economy of the region. South Africa, the region's leader in total transactions, also ranks 30th on our index.
Small Retail Transactions Power Cryptocurrency Markets in Sub-Saharan Africa
«Retail» sub-Saharan African market andThe widespread use of P2P platforms sets this region apart from all others. Retail-size transfers (under $10K) account for 6.4% of total transaction volume here, more than in any other region. The role of small retail users becomes even clearer when looking at the number of individual transfers. Retail transfers account for 95% of total transactions, and when considering small retail transactions under $1,000, they account for 80%—more than in any other region.

Share of retail transactions (<$10 thousand) in the total number of transactions in the region
Our interviews show that thisreflects a trend in which many young people in this region are turning to cryptocurrencies as a way to save and build wealth despite low economic opportunities—unlike in many other countries where we see many using cryptocurrencies as a way to increase existing wealth. Adedeji Owonibi, founder of Nigerian consulting and product studio Convexity, told us more about this dynamic. “We see a lot of active traders who trade cryptocurrencies to make ends meet,” he says. — We don't have large institutional-level traders here. Retail players are the main driving force of the market. Nigeria has a lot of highly educated young people with high unemployment, no available jobs, and the crypto market is a lifesaver for many of them. It's a way to feed your family and solve your day-to-day financial issues." The volatility of the Nigerian naira is also driving demand for cryptocurrencies in the country, Deji said, as users believe they will be better able to store their savings with stablecoins like Tether.
The use of cryptocurrencies conditionedeveryday necessity, as opposed to the speculation of already wealthy people, may explain an interesting phenomenon that we observed in sub-Saharan Africa this year: the number of small retail transactions since the beginning of the bear market in May has actually increased, while the number of transactions of other sizes decreased.

Index: Rise in Cryptocurrency Transfers by Transaction Size in Sub-Saharan Africa
If many people running small retailtransactions, trade cryptocurrencies out of economic necessity - especially in countries where the value of local fiat currencies is falling, such as in Nigeria and Kenya - these people may be more willing to continue trading despite the market drop. And, of course, users who buy stablecoins like Tether will not be affected by price drops in BTC, ETH, etc.
P2P exchanges as an essential part of the ecosystem
We are also seeing widespread adoption of P2P exchangesregion users. P2P exchanges account for 6% of the total volume of cryptocurrency transactions in Africa, which is more than twice the share of the next region in this indicator - Central, South Asia and Oceania.

Share of P2P exchanges in the total volume of cryptocurrency transactions by region
To better understand the reasons for this, we spoke withRay Youssef, CEO of the popular P2P platform Paxful. According to Ray, Sub-Saharan Africa is Paxful's main driver of growth, with Nigeria, already Paxful's largest market, seeing annual growth in money transfer users of 55% and Kenya nearly 140%. He explained to us that P2P platforms such as Paxful originally emerged in Africa as one of the first services that residents could use to buy cryptocurrencies. “We needed to bring Bitcoin to Africa, which was not easy because it is very difficult to get money out of Africa. We needed some out-of-the-box smart solution to bypass the system,” says Ray. Such a solution was found in the form of gift cards: “We connected Nigerians with Chinese gamers who wanted to buy App Store gift cards, and a huge shopping market was born. Because of this, Bitcoin came to Nigeria and then to the rest of West Africa.” Strategies like these allowed P2P platforms to fuel early bitcoin activity in sub-Saharan Africa, and these services have proven to be viable in the region.
Regulatory restrictions can also encourageusing P2P exchanges. The Nigerian government has banned banks from transacting with crypto companies in 2021, and while these measures do not appear to have lowered the overall volume of crypto transactions, they have affected usage patterns. We spoke with an analyst from the Nigerian FIU to find out more. “Nigeria restricted the use of naira to buy cryptocurrencies in 2021 out of concerns about fraud and tax evasion, and because of this, many began to trade peer-to-peer,” the analyst told us.
However, this activity goes beyondconventional P2P platforms such as Paxful. Many in Nigeria also trade cryptocurrencies with each other directly, making deals in group chats on WhatsApp or Telegram. This activity is not reflected in our geographic data, as it occurs through interaction with private wallets, but the experts we interviewed described it as a significant part of the Nigerian cryptocurrency ecosystem. Adedeji Owonibi told us a little more: “Thousands of people from all over the world — Nigeria, China, Dubai and so on — are in these groups and trade cryptocurrencies with each other. Significant trading volumes are created in such groups.”
Trade and remittances are also fueling the adoption of cryptocurrencies in sub-Saharan Africa
In addition to trading and savings, Ray and Deji talked about two more common use cases for cryptocurrencies in the region: remittances and commerce.
Money transfers from abroad have been playing for a long timeimportant to sub-Saharan African economies, with cash flows into the region rising 14.1% to $49 billion in 2021, after declining the previous year. However, such transactions can be costly and difficult to execute. Ray Youssef explained in more detail: “Making an international payment in a country like Nigeria, Cameroon or Senegal is almost impossible. There is no pan-African payment solution. There are thousands of payment networks in Africa, and only a fraction of them communicate with each other.” He told about an expat friend who had to pay €200 for every €1,000 she tried to send home from Europe. Ray helped this woman use Paxful to buy BTC and sell it to another user for Kenyan shillings through the Kenyan payment network M-PESA, which she could then transfer directly to her family. “She ended up making a 4% profit instead of a 20% commission because the user she was trading with was willing to pay a little more for the BTC,” Ray says.
Another use case is commercialtransactions. Adedeji Owonibi told us that many businesses that work with international suppliers have turned to cryptocurrencies to settle with them, as sending funds abroad is difficult due to tight capital controls in Nigeria: “Companies need to buy materials in the US, but there is no way deliver the money there, and they have no choice but to use the USDT.” He named China as another popular trading partner for such cryptocurrency commercial transactions.
Future Growth in Sub-Saharan Africa
Which countries will provide the next round of growthcrypto adoption in sub-Saharan Africa? Ray pointed to Ghana as a place where he predicted adoption rates would be as high as Nigeria or Kenya, based on current growth trends and the needs of the local population. “Many Nigerians consider Ghana their summer home, they spend a lot of time there, and they train the locals on bitcoin,” says Ray. He told us that Paxful's total trading volume in Ghana has grown almost 100% in the last year and more than 400% in two years. This is consistent with our data indicating significant growth in the cryptocurrency market in Ghana along with several other countries in the region.

Index: Cryptocurrency Website Traffic Quarterly Growth by Country
In general, we expect the usecryptocurrencies in sub-Saharan Africa will rise as long as residents face the challenges that cryptocurrencies can solve – for example, maintaining savings in the face of economic instability and cross-border transactions in countries with strict capital controls.
Cryptocurrency Global Adoption Index 2022: Complete List
| Values for individual metrics on which the overall cryptoasset global adoption index is built | ||||||
| Country | Position in the index | Rating by volume of centralized services | Rating by retail volumes of centralized services | Ranking by trading volumes on P2P platforms | Ranking by incoming DeFi transfer | Ranking by inbound retail DeFi transfer |
| Vietnam | 1 | 5 | 5 | 2 | 7 | 6 |
| Philippines | 2 | 4 | 4 | 66 | 13 | 5 |
| Ukraine | 3 | 6 | 6 | 39 | 10 | 14 |
| India | 4 | 1 | 1 | 82 | 1 | 1 |
| USA | 5 | 3 | 3 | 111 | 3 | 2 |
| Pakistan | 6 | 10 | 10 | 50 | 22 | 16 |
| Brazil | 7 | 7 | 7 | 113 | 8 | 7 |
| Thailand | 8 | 12 | 12 | 61 | 5 | 3 |
| Russia | 9 | 8 | 8 | 109 | 11 | 12 |
| China | 10 | 2 | 2 | 144 | 6 | 4 |
| Nigeria | 11 | 18 | 18 | 17 | 20 | 17 |
| Turkey | 12 | 9 | 9 | 121 | 19 | 15 |
| Argentina | 13 | 13 | 13 | 26 | 21 | 25 |
| Morocco | 14 | 19 | 19 | 21 | 33 | 18 |
| Colombia | 15 | 23 | 23 | 10 | 27 | 29 |
| Nepal | 16 | 17 | 17 | 19 | 34 | 41 |
| Great Britain | 17 | 14 | 14 | 71 | 12 | 11 |
| Ecuador | 18 | 37 | 37 | 6 | 45 | 56 |
| Kenya | 19 | 43 | 43 | 5 | 9 | 34 |
| Indonesia | 20 | 16 | 16 | 129 | 18 | 13 |
| Germany | 21 | 22 | 22 | 114 | 15 | 10 |
| Canada | 22 | 28 | 28 | 96 | 14 | 8 |
| South Korea | 23 | 11 | 11 | 141 | 28 | 22 |
| Egypt | 24 | 15 | 15 | 110 | 57 | 47 |
| Belarus | 25 | 31 | 31 | 29 | 43 | 57 |
| Japan | 26 | 20 | 20 | 143 | 17 | 9 |
| Cambodia | 27 | 38 | 38 | 28 | 29 | 23 |
| Mexico | 28 | 21 | 21 | 122 | 23 | 19 |
| Malaysia | 29 | 42 | 42 | 31 | 38 | 32 |
| South Africa | 30 | 29 | 29 | 81 | 41 | 31 |
| Palestine | 31 | 45 | 45 | 15 | 94 | 93 |
| France | 32 | 26 | 26 | 101 | 16 | 20 |
| Poland | 33 | 25 | 25 | 102 | 32 | 30 |
| Spain | 34 | 27 | 27 | 99 | 24 | 26 |
| Peru | 35 | 39 | 39 | 45 | 39 | 50 |
| Bangladesh | 36 | 30 | 30 | 92 | 48 | 39 |
| Georgia | 37 | 47 | 47 | 33 | 53 | 52 |
| Portugal | 38 | 51 | 51 | 24 | 40 | 36 |
| Netherlands | 39 | 41 | 41 | 69 | 26 | 24 |
| Australia | 40 | 40 | 40 | 90 | 25 | 21 |
| Moldova | 41 | 49 | 49 | 27 | 72 | 88 |
| Bolivia | 42 | 54 | 54 | 20 | 93 | 91 |
| Dominican Republic | 43 | 64 | 64 | 13 | 87 | 74 |
| Somalia | 44 | 75 | 75 | 7 | 131 | 128 |
| Algeria | 45 | 34 | 34 | 100 | 50 | 43 |
| Hong Kong | 46 | 50 | 50 | 52 | 35 | 33 |
| Tanzania | 47 | 81 | 81 | 9 | 61 | 42 |
| Bulgaria | 48 | 48 | 48 | 54 | 42 | 44 |
| Ghana | 49 | 66 | 66 | 14 | 68 | 58 |
| Tunisia | 50 | 63 | 63 | 22 | 64 | 68 |
| Italy | 51 | 32 | 32 | 132 | 30 | 27 |
| Iraq | 52 | 24 | 24 | 130 | 98 | 101 |
| Taiwan | 53 | 33 | 33 | 124 | 31 | 35 |
| Jamaica | 54 | 97 | 97 | 4 | 100 | 98 |
| Salvador | 55 | 61 | 61 | 36 | 89 | 83 |
| Chile | 56 | 58 | 58 | 53 | 37 | 40 |
| Ivory Coast | 57 | 76 | 76 | 23 | 78 | 64 |
| Sri Lanka | 58 | 59 | 59 | 48 | 54 | 63 |
| Serbia | 59 | 67 | 67 | 34 | 75 | 60 |
| Mozambique | 60 | 36 | 36 | 125 | 63 | 62 |
| Kazakhstan | 61 | 44 | 44 | 115 | 73 | 59 |
| Czech Republic | 62 | 52 | 52 | 89 | 44 | 48 |
| Singapore | 63 | 55 | 55 | 80 | 47 | 51 |
| Ethiopia | 64 | 62 | 62 | 67 | 66 | 46 |
| Costa Rica | 65 | 86 | 86 | 16 | 84 | 80 |
| Switzerland | 66 | 57 | 57 | 76 | 36 | 38 |
| Saudi Arabia | 67 | 35 | 35 | 133 | 91 | 81 |
| Jordan | 68 | 60 | 60 | 68 | 88 | 78 |
| Guatemala | 69 | 65 | 65 | 57 | 111 | 107 |
| Belize | 70 | 106 | 106 | 8 | 109 | 71 |
| Seychelles | 71 | 123 | 123 | 1 | 110 | 114 |
| Zimbabwe | 72 | 69 | 69 | 47 | 117 | 119 |
| Myanmar | 73 | 53 | 53 | 103 | 95 | 89 |
| Cameroon | 74 | 102 | 102 | 12 | 79 | 102 |
| Armenia | 75 | 72 | 72 | 70 | 49 | 45 |
| Romania | 76 | 56 | 56 | 118 | 55 | 49 |
| Kyrgyzstan | 77 | 73 | 73 | 84 | 51 | 37 |
| Sweden | 78 | 85 | 85 | 44 | 62 | 67 |
| Democratic Republic of the Congo | 79 | 80 | 80 | 98 | 46 | 28 |
| Slovakia | 80 | 70 | 70 | 95 | 70 | 69 |
| Rwanda | 81 | 103 | 103 | 18 | 107 | 108 |
| Estonia | 82 | 95 | 95 | 38 | 60 | 75 |
| Uruguay | 83 | 96 | 96 | 32 | 114 | 118 |
| Mongolia | 84 | 77 | 77 | 87 | 71 | 70 |
| Greece | 85 | 68 | 68 | 117 | 59 | 53 |
| Laos | 86 | 88 | 88 | 59 | 83 | 86 |
| Uzbekistan | 87 | 46 | 46 | 140 | 99 | 77 |
| Finland | 88 | 78 | 78 | 97 | 65 | 79 |
| Lebanon | 89 | 90 | 90 | 56 | 2 | 72 |
| Honduras | 90 | 84 | 84 | 73 | 4 | 54 |
| Hungary | 91 | 79 | 79 | 112 | 81 | 73 |
| Latvia | 92 | 98 | 98 | 55 | 96 | 92 |
| Togo | 93 | 82 | 82 | 104 | 101 | 85 |
| Belgium | 94 | 74 | 74 | 128 | 58 | 55 |
| Paraguay | 95 | 92 | 92 | 62 | 106 | 113 |
| Albania | 96 | 105 | 105 | 49 | 86 | 76 |
| Mali | 97 | 112 | 112 | 25 | 134 | 130 |
| Madagascar | 98 | 71 | 71 | 123 | 124 | 115 |
| Nicaragua | 99 | 104 | 104 | 42 | 116 | 117 |
| Uganda | 100 | 89 | 89 | 91 | 105 | 105 |
| Barbados | 101 | 121 | 121 | 11 | 136 | 137 |
| Lithuania | 102 | 93 | 93 | 86 | 92 | 90 |
| Croatia | 103 | 91 | 91 | 93 | 80 | 84 |
| Panama | 104 | 107 | 107 | 43 | 74 | 96 |
| Senegal | 105 | 115 | 115 | 37 | 104 | 82 |
| Benin | 106 | 94 | 94 | 85 | 52 | 103 |
| Austria | 107 | 83 | 83 | 127 | 56 | 66 |
| New Zealand | 108 | 99 | 99 | 94 | 76 | 61 |
| Azerbaijan | 109 | 100 | 100 | 88 | 102 | 94 |
| Cyprus | 110 | 118 | 118 | 40 | 103 | 104 |
| Israel | 111 | 101 | 101 | 105 | 77 | 65 |
| Macedonia | 112 | 111 | 111 | 63 | 97 | 87 |
| Slovenia | 113 | 87 | 87 | 131 | 90 | 97 |
| Norway | 114 | 108 | 108 | 83 | 85 | 99 |
| Bosnia and Herzegovina | 115 | 113 | 113 | 65 | 112 | 109 |
| Denmark | 116 | 116 | 116 | 72 | 69 | 100 |
| Angola | 117 | 109 | 109 | 116 | 121 | 106 |
| Bahamas | 118 | 137 | 137 | 3 | 120 | 126 |
| Montenegro | 119 | 126 | 126 | 41 | 115 | 110 |
| Zambia | 120 | 119 | 119 | 75 | 118 | 111 |
| Trinidad and Tobago | 121 | 122 | 122 | 60 | 127 | 121 |
| Mauritius | 122 | 130 | 130 | 30 | 82 | 120 |
| Saint Lucia | 123 | 129 | 129 | 35 | 135 | 134 |
| Ireland | 124 | 117 | 117 | 120 | 67 | 95 |
| Congo | 125 | 120 | 120 | 108 | 146 | 142 |
| Namibia | 126 | 131 | 131 | 64 | 122 | 127 |
| Malta | 127 | 133 | 133 | 79 | 113 | 112 |
| Tajikistan | 128 | 124 | 124 | 135 | 126 | 124 |
| Botswana | 129 | 135 | 135 | 51 | 138 | 138 |
| Suriname | 130 | 134 | 134 | 74 | 130 | 132 |
| Libya | 131 | 125 | 125 | 137 | 125 | 122 |
| Haiti | 132 | 110 | 110 | 145 | 128 | 133 |
| Burkina Faso | 133 | 128 | 128 | 136 | 108 | 116 |
| Maldives | 134 | 140 | 140 | 46 | 139 | 135 |
| Bahrain | 135 | 132 | 132 | 134 | 132 | 131 |
| Luxembourg | 136 | 138 | 138 | 78 | 119 | 123 |
| Malawi | 137 | 127 | 127 | 142 | 140 | 139 |
| Gabon | 138 | 136 | 136 | 106 | 133 | 136 |
| Iceland | 139 | 141 | 141 | 77 | 129 | 129 |
| Fiji | 140 | 143 | 143 | 58 | 143 | 145 |
| Qatar | 141 | 139 | 139 | 138 | 123 | 125 |
| Guyana | 142 | 142 | 142 | 126 | 142 | 143 |
| Bermuda | 143 | 144 | 144 | 107 | 144 | 144 |
| Macau | 144 | 145 | 145 | 119 | 137 | 140 |
| Brunei | 145 | 146 | 146 | 139 | 141 | 141 |
| Afghanistan | 146 | 114 | 114 | 146 | 145 | 146 |
</p>
BitNews disclaim responsibility for anyinvestment recommendations that may be contained in this article. All the opinions expressed express exclusively the personal opinions of the author and the respondents. Any actions related to investments and trading on crypto markets involve the risk of losing the invested funds. Based on the data provided, you make investment decisions in a balanced, responsible manner and at your own risk.
Read this:
 Chainalysis: "Vietnam remains the leader in cryptocurrency adoption"
 Geography of cryptocurrencies 2021
 Russia and Ukraine lead the cryptocurrency adoption index
 Ukraine and Russia lost leadership in the global cryptocurrency adoption index Chainalysis
 Cryptocurrency Tax Law Enters into Force in South Korea from 2022
 Russia in the TOP-10 countries in terms of cryptocurrency adoption index