All good!
There is a good tradition in the community of coining cue ball, so I can’t stay awayand not contribute to the treasury of the natives.

Global View

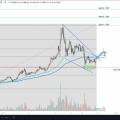
BTCUSD Week
Bitcoin is a very technical instrument which is a good illustration of how TA works. This weekly chart shows several TA patterns at once (from left to right):
If you start breaking down Bitcoin into smallertimeframes, then there are their own sets of figures, waves, patterns. The main thing here is that all the figures work out perfectly, which makes it possible to predict the further behavior of this most speculative and fundamentally disconnected from reality tool. I'm not going to go into the analysis of patterns and figures on smaller timeframes (hundreds of telegram channels and bloggers do this every day and much better than me), but I will make my forecast on the medium-term timeframe that I'm used to.
So native or?

BTCUSD Day
The GUI's right shoulder points to a target around 10400natural bucks. At the moment, the percentage of implementation of this goal is 70%, where a reversal pattern was drawn at the peak of the decline: updating of the layers on increased volumes and divergence on the RSI.

BTCUSD Day
But, as we know from the basic TA course, this signal is not a signal without the presence of larger formations and therefore I suggest taking a look at the current disposition of the cue ball.

BTCUSD Day
This figure, formed by the neck line of the GUI from aboveand trend support from below, is called “bull wedge”. As a rule, exit from this figure is carried out upwards with the aim to reach the height of the wedge at the first touch point of the price of the lower border of the figure. Thus, we have an approximate target, in case of an exit from the figure by the Catholic Christmas = 28700. If the exit takes place later, then the target is corrected parallel to the decrease in the upper border of the wedge.
Why not down to 10400? Because we have a reversal signal. And signal + figure = forecast.
So - native.)
@ThePearlDiver