A few thoughts on “right” and “wrong” in markets, risk management, and Bitcoin as(non) speculative asset, as well as technical analysis for BTC / USD, ETH / USD and Facebook (Meta).
“With a 10% chance of winning 100%, you have to bet every time.” - Jeff Bezos
The idea of placing bets with asymmetric upside potential is nothing new.
What can be added to Bezos' phrase isthat you should not bet all your capital on such opportunities. And this is an important nuance! A professional poker player can go all-in with all the chips on the table, but most likely he only plays 1-2% of his bankroll.
If you put your entire portfolio on an investment with a 10% success rate, then the odds don't even matter. In 90% of cases, you will be left without a livelihood.
So the statement is true in spirit, but important.context. This is why traders use only a small part of their portfolio to trade the markets, keeping the rest in more reliable long-term investments. You can regularly “play like Bezos” with a small percentage of your portfolio and not ruin it.
But never go for broke - only risk what you can afford to lose. And even very moderate positions can turn into life-changing investments.
Чтобы это могло произойти, нужно научиться, и хорошо, с большим терпением держать выигрышные позиции и вовремя списывать убытки.
“Rushing to take profits and persisting in holding losing positions is like cutting flowers and watering weeds.” - Peter Lynch.
Investors and traders often developa strange and seemingly counterintuitive behavioral pattern - long and patiently waiting for unprofitable positions to enter profit and quickly fixing profits on winning ones. It seems strange, but it can be easily explained in the context of the emotional component of trading in the markets. Striving to be “right,” traders will take profits too early for fear that they may ultimately be “wrong” if they let the situation take its course. On the other hand, fixing a loss on a trade is also an admission that they are “wrong”, so traders often tend to hold a losing position to the last, hoping that in the end they will be “right”.
But after all, we know how to act on the verybusiness? It is necessary to get rid of unprofitable positions in time and allow several profitable ones to continue to recoup small local losses. A few of the most successful trades per year bring traders most of the profit. But this is impossible if you are in a hurry to take profit in the first zone of uncertainty, fearing to be “wrong”.
Strong hands always win.
Is Bitcoin a speculative asset? Think again
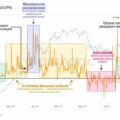
The UTXO chart below reflects the transaction volumeactivity relative to the age (time since the last on-chain transfer) of "coins". The age ranges are indicated by colored stripes, the width of these stripes reflects the relative share of the corresponding category of “coins” in the total supply. The recent expansion of the yellow bars indicates an increase in the share of coins introduced to the market in the last 6-12 months; today they account for ~ 20% of the circulating BTC supply. At the same time, the blue bar reflects the volume of coins that have not changed owners for several years, and their share in the total volume continues to grow steadily, indicating that Bitcoin is increasingly perceived by holders as a long-term investment.

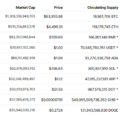
Data can be collected into a single metric,taking into account all bitcoin addresses and their activity. This is calculated by averaging the hold times for all addresses before they transfer (or sell) their bitcoins. The average retention time for bitcoins is 3.3 years. That is, for an asset that has existed for 13 years, on average, each bitcoin was held by one owner for more than a quarter of the entire life of the asset.
These data indicate that behind the buyingBitcoin's activity is the real demand from investors interested in long-term ownership of the asset. Which is consistent with the thesis that bitcoin is mainly used as a store of capital that can be stored for years without losing its value. And by the way, over the past month, several representatives of influential financial institutions, such as JPMorgan and Paul Tudor Jones, have expressed the opinion that Bitcoin is superior to gold as a hedge against inflation risks. So far, this has been true, and as of now, there is no sign that BTC holders should start thinking otherwise.
Bitcoin technical analysis
On the Bitcoin price chart there is noliterally nothing new. The price has been trading in the $60K area for what seems like an eternity, without forming meaningful patterns or offering any real signals. As I said earlier, the market needs to break through all-time high resistance to truly continue the rally, and on most time frames, the BTC price chart is showing a short-term period of uncertainty within a long-term uptrend.
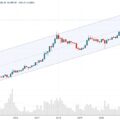
Monthly schedule

Chart executed in TradingView
I like to include this graph in reviews asa way to remind you of what the big picture looks like for the bitcoin market at the macro level, and perhaps immediately reduce the level of (likely) anxiety of some readers, especially new ones.
The monthly chart is in an ascending channel, notviolated since 2013. Whenever the middle of the channel (dotted line) turned into resistance or support, the price reached the lower or upper border of the channel, respectively.
Now protracted for 6 months (!) the retest ended with the middle of the channel working as support. If history repeats itself (yes, it may not), then the price should reach the upper border of the channel, which gives us several six-digit target levels, depending on when it happens.
When in doubt, zoom out and see the big picture. On the longer timeframes, it really looks like this growth wave is really just beginning.
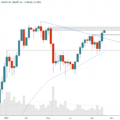
Weekly schedule

Chart executed in TradingView
Uncertainty.A few weeks ago, the price broke through the sloping resistance (blue line) and formed a larger high, thereby refuting any bearish thesis. This momentum was continued in the form of another strong candle with the highest close of the week in history, then a renewal of the record high and a pullback below that level.
We now have two candles in a row (andpotential third is not yet closed), signaling uncertainty. The first of these has the form of a "shooting star", which can be considered a pattern of probable top formation, but to complete it still needs to be confirmed in the form of the next "bearish" candlestick. In addition, the same candle formed a bearish Failed Breakout Pattern (SFP), with a wick above the resistance of the previous high and a close well below that level. The next candlestick did not add any certainty (nor did it confirm a shooting star), closing in a spinning top (yes, another candlestick pattern) with long wicks in both directions and a minimum candlestick body in the center of the weekly trading range. Another potential “spinning top” may be forming now, but it is still too early to judge this, since there are more than two days left before the candle closes.
The most favorable scenario for the “bulls” and a signal to continue the uptrend would be a breakout and closing of the weekly candle above the record high.
Daily chart

Chart executed in TradingView
The only thing I can mention here isnarrowing of Bollinger bands. This is how this moving average-based indicator responds to declining volatility and price consolidation. Such periods of consolidation are usually resolved by high volatility and expansion of the Bollinger Bands, signaling the start of a new impulse. In the meantime, there is no such signal, it seems reasonable to assume the likelihood of the continuation of a more or less chaotic "haircut" in a narrow and uncomfortable side range.
ETH / USD

Chart executed in TradingView
ETH just a few days ago updated its recordmaximum, albeit local (that is, installed quite recently). This makes the breakthrough somewhat less convincing. Nevertheless, so far we already have three candles in a row (today’s is not yet closed) of a successful retest of this level as support. So far, ETH is moving in line with the assumption I made last Friday. If the ~$4460 level is maintained, then… There will be only one limit - the sky.
Traditional Markets
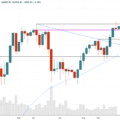
FB (Facebook / Meta)

Chart executed in TradingView
Meta Platforms, aka Facebook, forms a pattern“morning star” on the weekly chart, with a clear retest of the 50 MA (blue curve) last week. As you can see, two weeks ago, the market opened with a gap, formed a long wick down and closed a candle with a green body - a bullish signal. The current week opened with a gap again (now up) and looks like it is ready to close with a bullish candle, but will have to wait for the close to be sure.
If everything happens like this, then it can be perceived as a clear signal of the formation of the bottom, which gives reason to expect the price to rise at least to the current highs.
BitNews disclaim responsibility for anyinvestment recommendations that may be contained in this article. All the opinions expressed express exclusively the personal opinions of the author and the respondents. Any actions related to investments and trading on crypto markets involve the risk of losing the invested funds. Based on the data provided, you make investment decisions in a balanced, responsible manner and at your own risk.
Read this:
 October did not disappoint. What can you expect now? - technical analysis from November 1, 2021
 Clear (Mainly) Sky for BTC and ETH - Tech Review November 3, 2021
 A technical analysis of the Bull Hammer Bitcoin exchange rate speaks of the start of the BTC rally
 Continued Growth - Most Likely Scenario - Onchain Pulse of November 2, 2021
 Consolidation under the resistance of the previous high - tech. analysis dated October 25, 2021
 Key point for the BTC market - technical analysis from October 11, 2021