Closing of the week and month in the bitcoin market.The chart of the total capitalization of the crypto market looks likeReadystorm new highs.
Bitcoin technical analysis
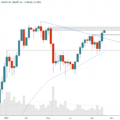
Monthly schedule
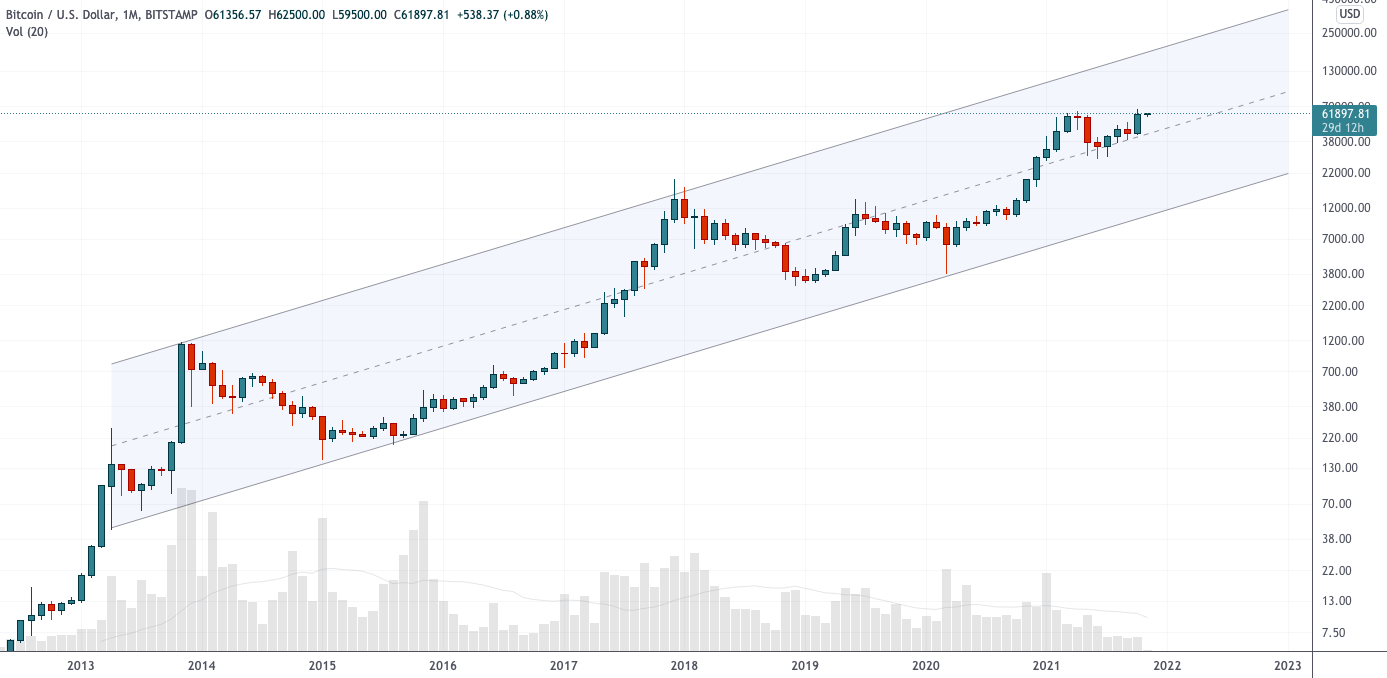
Chart executed in TradingView
The traditionally successful October for crypto markets was notdisappointed with the highest monthly candle close in Bitcoin history. As you can see in the chart, the middle line of the ascending channel has been tested as support for 6 candles in a row, and the current momentum most resembles a somewhat belated move to the upper border of the channel.
When in doubt, zoom out and watchto the big picture. The upper border of the channel corresponds to the six-digit BTC prices and from a TA point of view, we have reason to expect a price rally into this area. It doesn't matter how long it takes.
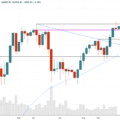
Weekly schedule
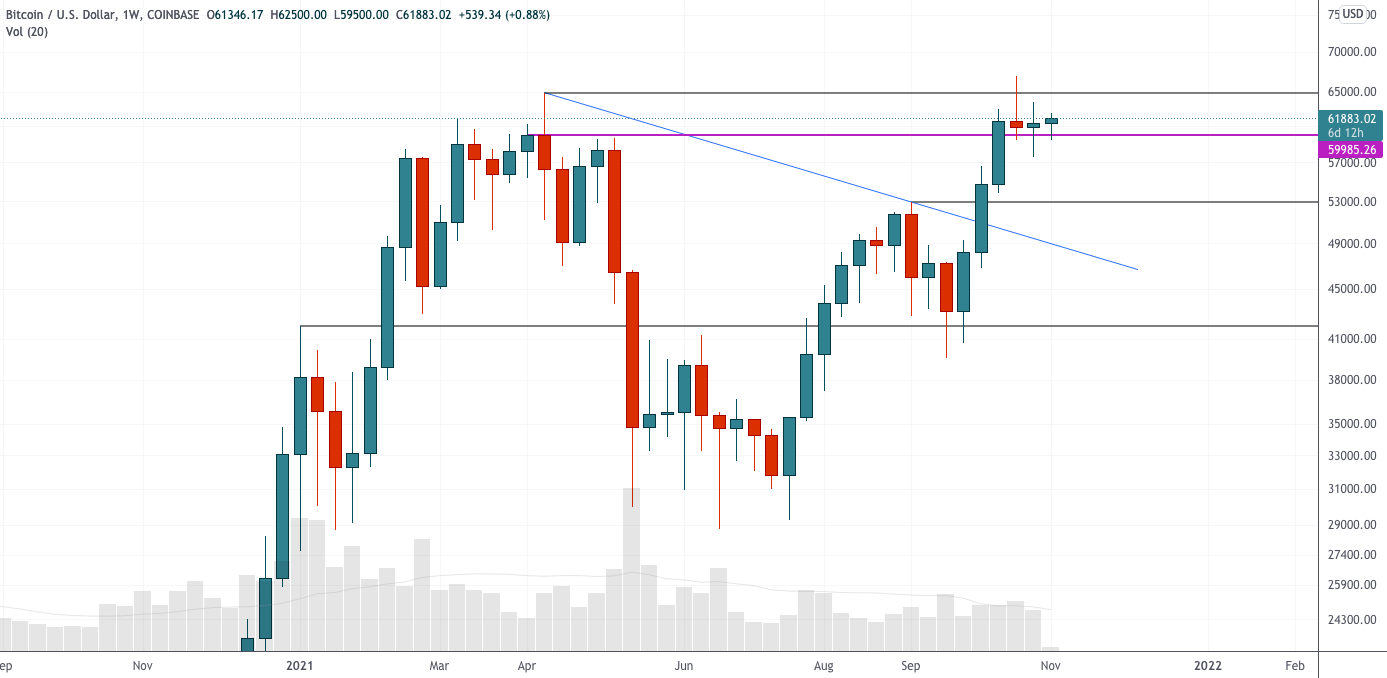
Chart executed in TradingView
The weekly chart shows someindecision. Last week closed as the ugliest-looking shooting star with a bearish Failed Breakout Pattern (SFP) through all-time high resistance. It was followed by a spinning top — a candlestick reflecting market indecision — with long wicks at the top and bottom and price closing approximately in the middle with the small candle body. From this candlestick chart structure it is difficult to determine what to expect next, but it is somewhat reassuring that last week closed green, not providing the classic confirmation of the shooting star pattern. I think that the best possible signal for continued growth from the current position, again, would be the close of the weekly candle above the all-time high.
Daily chart
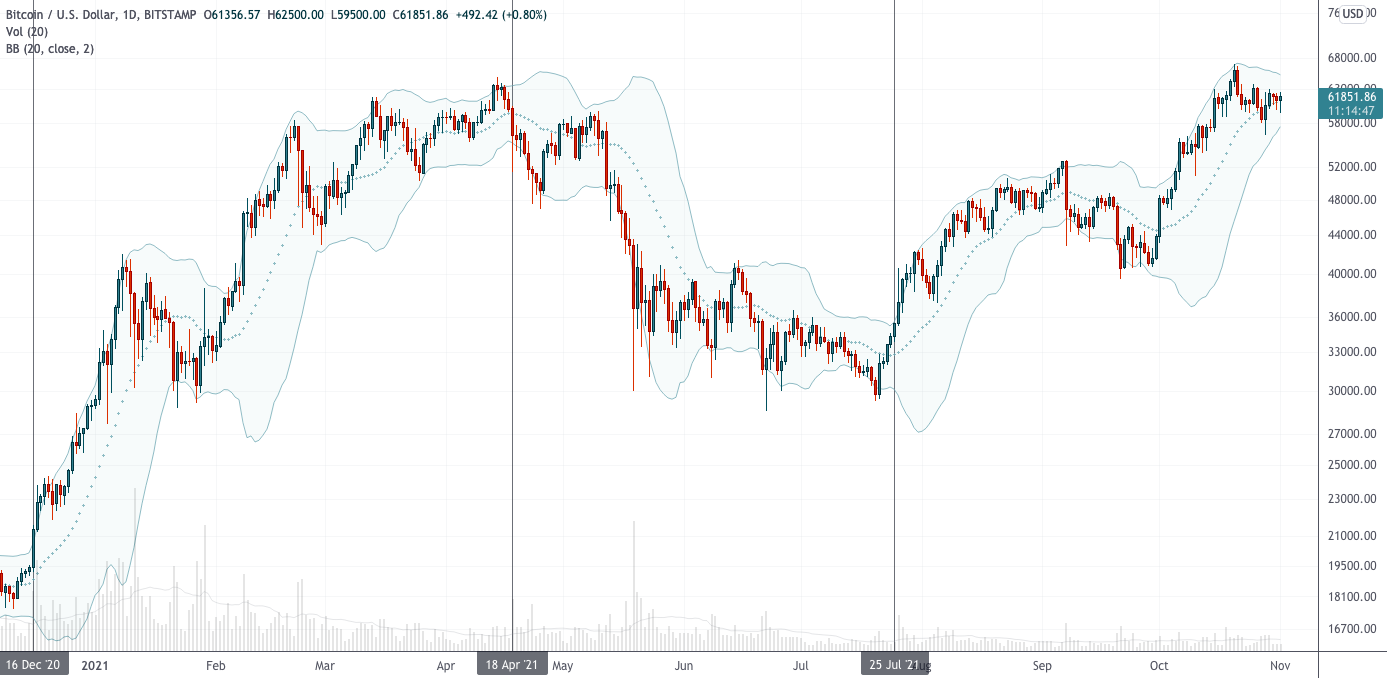
Chart executed in TradingView
The last three daily candles (today's one is not yetclosed) have pronounced wicks down, indicating a fairly strong demand for each small decline. As you can see, the price is still holding the center of the Bollinger Bands as support for now, which is bullish. The indicator borders are tightening again, indicating the likelihood of continued consolidation in this area before the market is ready for another explosive move, which will be accompanied by the expansion of Bollinger Bands. I don't see any clear bearish signs on the daily chart.
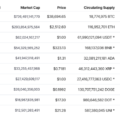
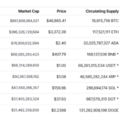
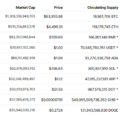
Total cryptocurrency market capitalization
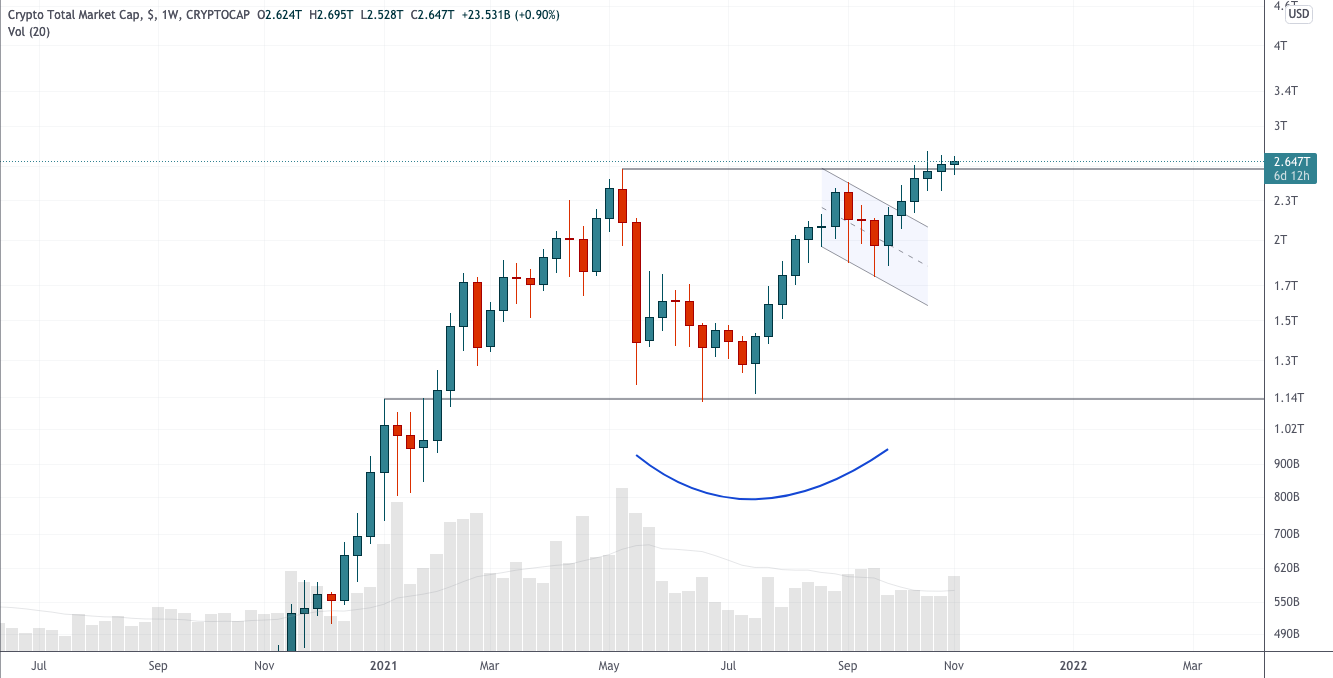
Chart executed in TradingView
In my opinion, the analysis of the graphs of the totalcryptocurrency market capitalization, Bitcoin dominance and other similar non-tradable indicators should not be taken too seriously, since they do not have orders that directly form support and resistance levels. Nevertheless, many technical analysts seem to be convinced that literally everything in the world follows certain patterns and that it makes sense to pay attention to the analysis of such charts.
Well, in that case, according to the general schedulecryptocurrency market capitalization, it can be stated that it broke the previous record highs two weeks ago and maintained these levels by the close of last week. There is a fairly clear cup and handle pattern on the chart, indicating that we may see even greater gains in the coming weeks and months. Here, for now, everything looks as if the real fun is just beginning.
BitNews disclaim responsibility for anyinvestment recommendations that may be contained in this article. All the opinions expressed express exclusively the personal opinions of the author and the respondents. Any actions related to investments and trading on crypto markets involve the risk of losing the invested funds. Based on the data provided, you make investment decisions in a balanced, responsible manner and at your own risk.
Read this:
 Key point for the BTC market - technical analysis from October 11, 2021
 Break of Weekly Resistance - Technical Review Aug 4, 2021
 Consolidation under the resistance of the previous high - tech. analysis dated October 25, 2021
 Analysis of the prices of Cardano and Dogecoin for 07/19/2021
 Crypto market at support in S&P 500 - Technical review from September 15, 2021
 Clear (Mainly) Sky for BTC and ETH - Tech Review November 3, 2021