The bitcoin price has received a noticeable bullish momentum, however, the resistance at $ 11,000 may remain unbreakable for a long time.
After the weakness of recent weeks and the fall from $ 12,000 to $ 10,000, the BTC price chart seemed to be showing signs of an imminent recovery.
Psychological level $ 10.000 worked reliably as support, from which the price bounced to almost $ 11,000. Now, the main thing is, will Bitcoin be able to break this level and continue the bullish momentum it received?
Bitcoin Holds $ 10,000 Level By Suspending Correction In Crypto Markets
In September, the price of BTC failed to stay above $ 11,000 and, with its decline, provoked a fall in other crypto markets.


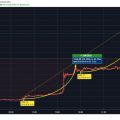
1-day BTC/USD chart. :TradingView.
Rapid break above $ 10.000 in July created a large gap between significant support zones. Since no new support zones were formed in this range, BTC plummeted to $ 10,000 within one day.
Like the old important resistance level,especially during the May Bitcoin halving, this $ 10,000 area is now a crucial support level. At the same time, the reversal of this resistance into support increases the chances for the continuation of the planned upward trend.
Are the markets outstripping the gap in CME futures?
Amid falling prices earlier this month, many traders and investors looked to the potential gap in CME futures as a likely target for a downside move.


1-day BTC/USD futures chart on CME. :TradingView.
However, this gap was not filled - buyers entered earlier. The price bounced off $ 10,000 before reaching $ 9,600.
In this regard, the probability that the CME gap is soand will not be filled, increasing every day. Not all futures gaps are filled; this is just another factor that traders should consider, like the change of support to resistance (and vice versa), or Fibonacci levels.
A more likely scenario for Bitcoin nowappears to be a transition to a long sideways trend, which may last for months. A similar period was observed in the previous market cycle in 2016.
Potential scenario for Bitcoin


1 hour BTC/USDT chart. :TradingView.
As you can see on the chart, after the fall, an uptrend with the likelihood of continuation emerged.
The upper resistance level is at $ 10.900. If this barrier is overcome, the next major resistance will be found in the $ 11.100-11.300 area. This range also coincides with the significant level on the older timeframes, and if it is broken, it can lead to a strong rally.


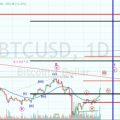
1-day BTC/USDT chart. :TradingView.
In such a case, the BTC price could quickly rise to the next important resistance level at $ 12,100.
However, a one-move breakout is less likely as this is only the first test of the previous support ($ 11,100).
Therefore, we should be prepared for a potential continuation of the sideways range, reminiscent of what happened immediately after the May halving.
And in conclusion, I will once again say clearly defined support levels: $ 9200–9500 and about $ 10,000; resistance levels - $ 11.100-11.300 and $ 11.900-12.200.
�
</p>Read this:
 Analysis of TRX / USD and ADA / USD on 08/10/2019
 Analysis of TRX / USD and ADA / USD on 10.24.2019
 Bitcoin rate jumped 29% per night
 Analysis of TRX / USD and ADA / USD on 11/12/2019
 Trading signals! | BTCUSD targets 11000/14000 / 18000/21000
 Copy-paste | Bitcoin: it seems that the strength of the bulls is running out