Upward momentum is showing signs of weakness and Bitcoin price may be subject to deepercorrection.
In recent months, the price of BTC has shown a significant increase, rising by almost 100%: from $10,000 to $19,800.However, at a historic high of $20,000, it met significant resistance, rolling back fromit has already been several times, including today, December 4.
The chances of a correction are gradually growing against the background of the decline in the volume of trading observed in recent days.There are several arguments in favour of a deeper correction, which will not necessarily bebad for the market as a whole.
The historical maximum remains an important level of resistance
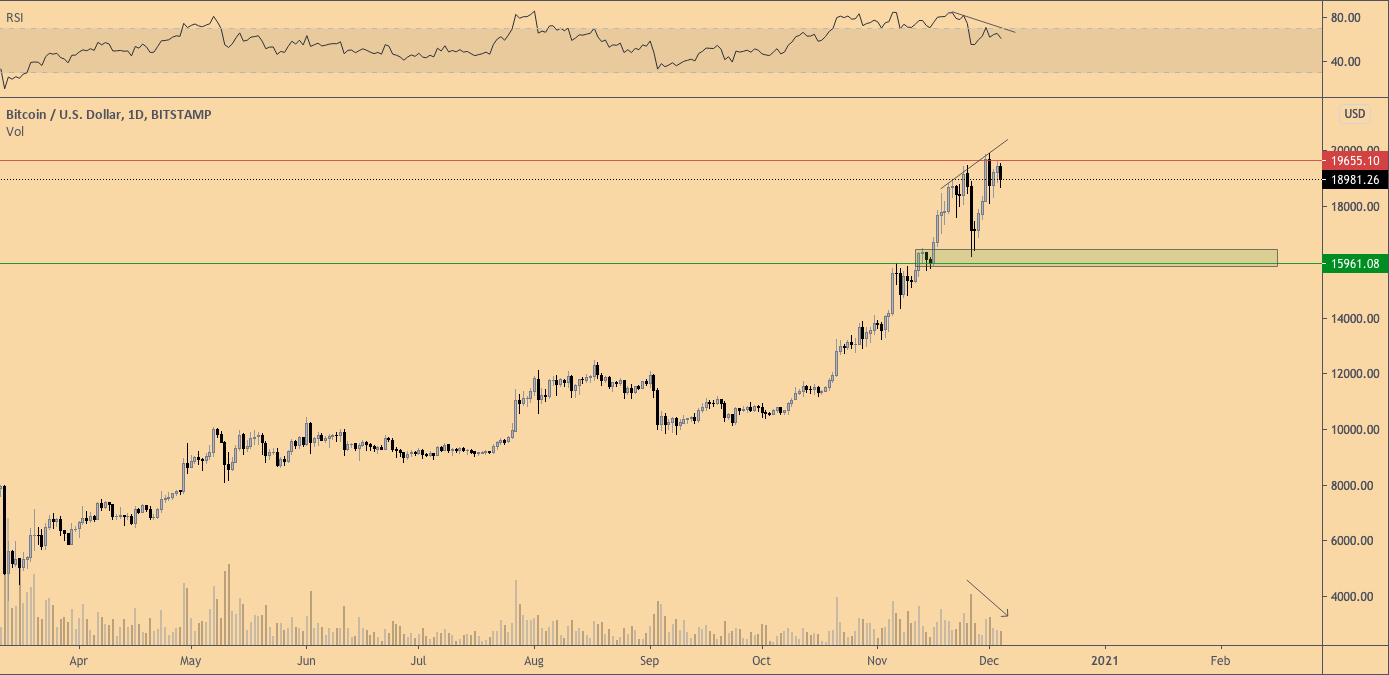
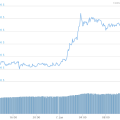
BTC/USD, 1-day chart. :TradingView
As can be seen in the graph, the resistance to the historical maximum is still not broken.However, this is not surprising, as for many retail investors the achievement of the record price level set at the peak of the bull market in 2017 servesAnd this is the last hurdle before bitcoin movesto the opening of new price levels, at which the target values will be determinedmuch more complicated.
Given that the price of BTC has reached the current maximum as a result of almost vertical movement, a sustained breakthrough of this level is unlikely to behappen on the first attempt.
However, while the price is still at this level, we can make several arguments in favor of a potential correction.
First of all, this decline in trading volumes after a recent attempt to break through $20,000, indicating a potential weakening of momentum.Secondly, the current retests of this level open the possibility for the formation of bearish divergence on the daily timeframe.
This bearish divergence is not yet complete, but shows potential signs of a slight reversal of the trend.In the case of correction, the key levels for finding the intended support are $16,000 and $14,000.
The maximum of 2014 was also taken not the first time
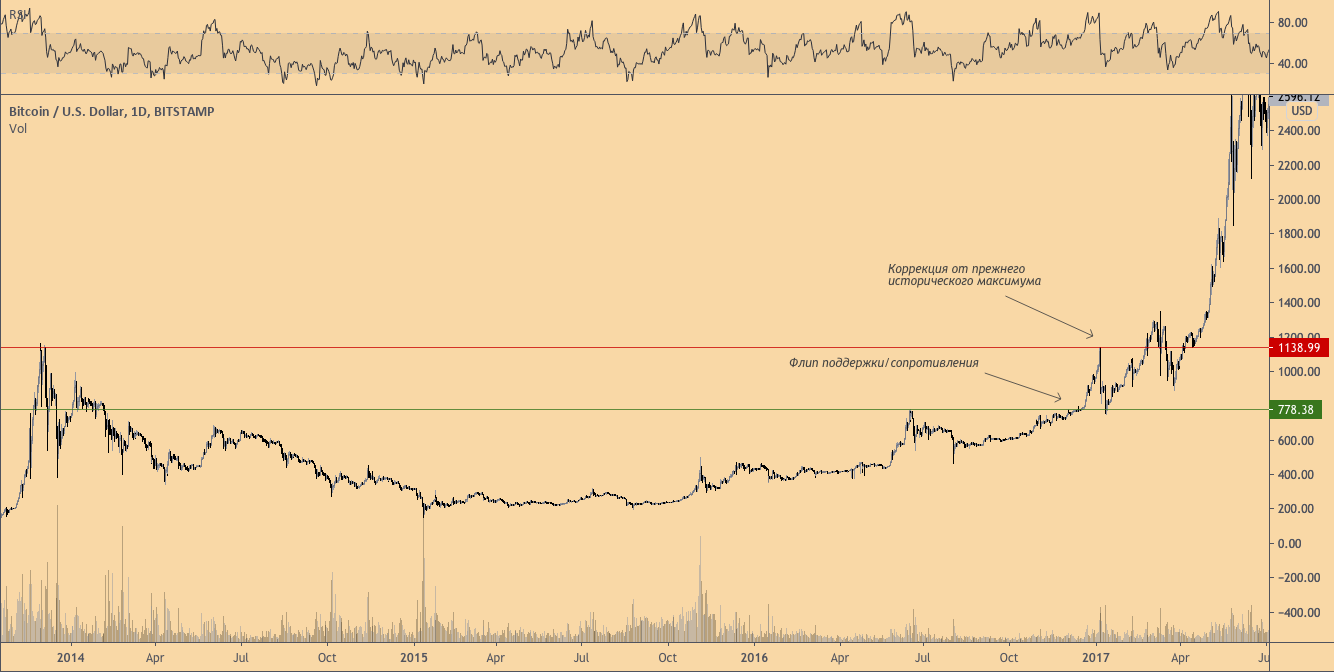
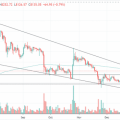
1-day BTC/USD chart. :TradingView
Current price movements are comparable to its behavior in the previous cycle.The peak of 2014 acted as the last resistance, upon reaching which the price was adjusted by 30%.
Such a correction often reaches the level of the previous resistance, and as shown in the graph, then this resistance was at the level of $800.
This level was confirmed as support, as a result of which the price of bitcoin continued its growthto new record values.
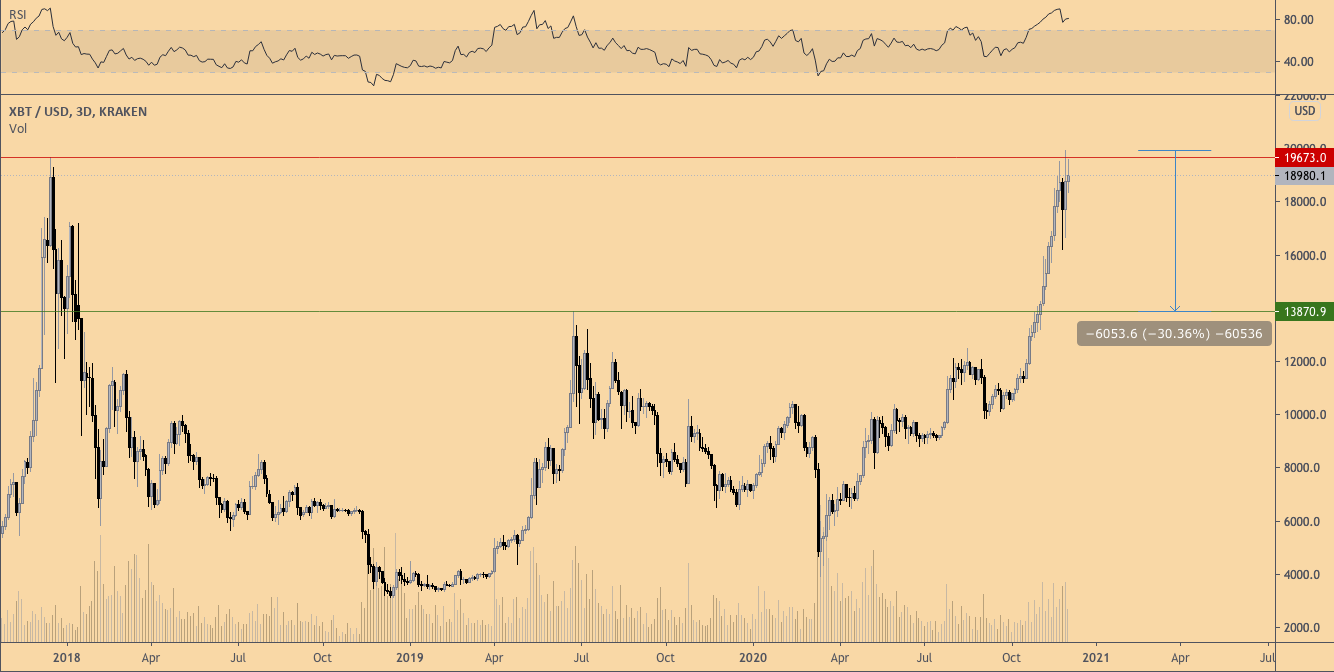
BTC/USD, 3-day chart. :TradingView
Often, markets in each cycle repeat the same number ofpattern, and a similar 30% correction of the leaking level impliesthe price of BTC to $14,000.This level coincidesalso with the previous high set in June 2019, which makesits likely target for a potential support/resistance flip.
Such a 30% correction would not be unhealthy for the market and is quite common. It can also be a great buying opportunity for anyone who hasn't gotten into Bitcoin yet.
Key levels on lower timeframes
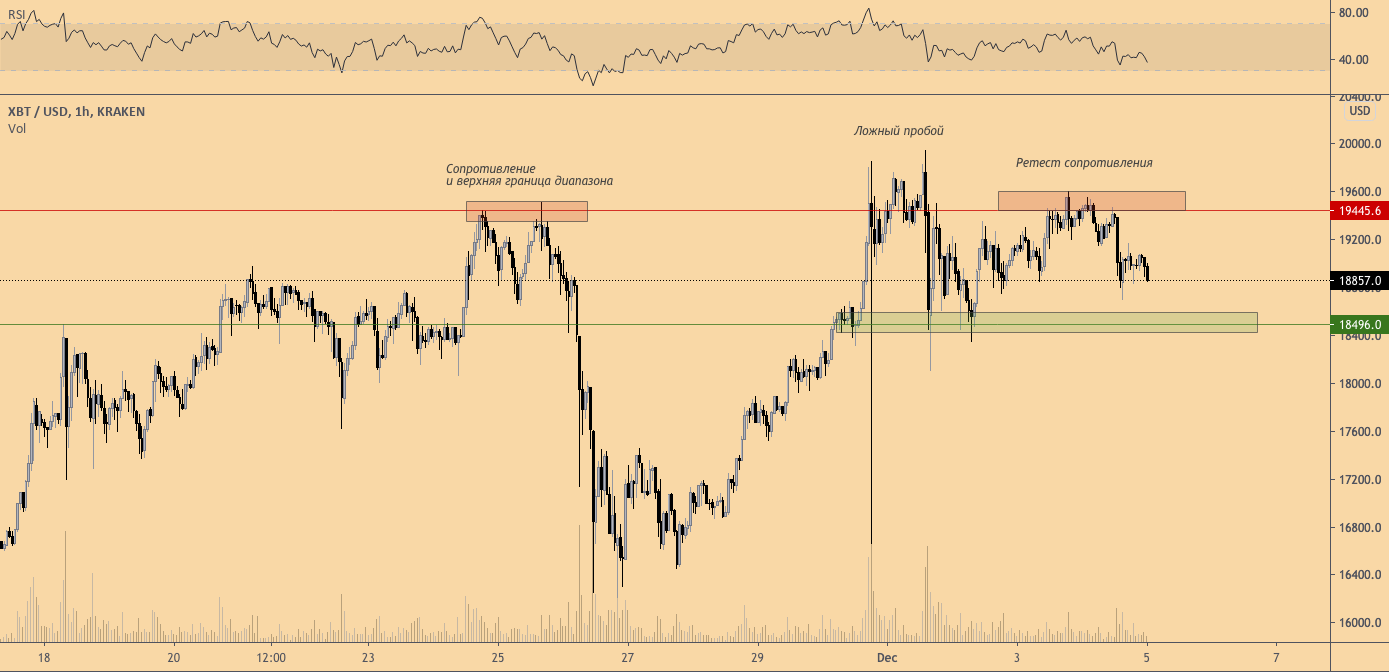
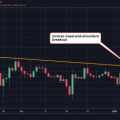
BTC/USD, 1-hour chart. :TradingView
On lower timeframes, you can observeformation of a potential reversal. The current range is well defined, with support in the green zone around $ 18,500. To maintain the upward momentum, this level must be held.
If this support fails, it is very likelyarea retest $ 16,000. However, if the market wants to maintain the bullish momentum, then it needs to break through the $ 19,500 resistance in order to allow the growth to continue. On the chart, we see a classic bearish flip of support to resistance.
$ 19,400 served as resistance, followed by a false breakout. Such false breakouts are often confirmed by another retest of previous resistance, as shown in the chart.
Therefore, to continue the upward impulsethe US dollar should continue to show weakness, and against this background, the BTC price needs to break through the resistance of $ 19.500 on lower timeframes. Until that happens, the most likely scenario is a correction and retest of $ 18,500 and possibly $ 16,000.
The article does not contain investment recommendations,all opinions expressed are solely the personal opinion of the author. Any activity related to investing and trading in the markets carries risks. Make your own decisions responsibly and independently.
</p>
Read this:
 Bitcoin price retested $ 10,000 amid Fed statements
 Bitcoin price unexpectedly touched $ 8000
 Bitcoin Price Returns Above $ 8,000 - Traders Take Off Shorts
 BTC rate correction will not prevent it from reaching the $ 20,000 level
 Tech analyst: Bitcoin price will soon reach $ 9,500
 Bitcoin price fell by $1000 – correction or resumption of growth