In this analyst note, I'll talk about three metrics that track and measure transactionalcryptocurrency activity: number of on-chain transactions, total transferredcost and turnover. We will also look at the differences with the practice of applying these metrics outside the context of cryptocurrencies and what this says about the innovativeness of blockchain technology in relation to payments.
I will not give a lot of math here.calculations. There are several simple formulas in the article, but I was guided primarily by the understanding of ordinary people, and not specialists in the field of statistics. I would like to contribute to making the measurement and understanding of the transactional activity of cryptocurrencies more accessible and understandable for all interested, and also to emphasize the importance of these metrics for cryptoassets and their potential role in building an investment portfolio.
I will refer mainly to Bitcoin here.as the largest and most liquid cryptocurrency, most often used as a kind of industry standard when comparing cryptocurrencies with traditional assets. I write bitcoin with a small letter when I mean an asset, BTC. I will write Bitcoin with a capital letter, referring to the blockchain or the protocol.
Metric 1: number of on-chain transactions
The first and most basic transactional metriccryptocurrency activity is the number of on-chain transactions. Processing transactions "on-chain" means writing them directly to the main blockchain, that is, no third-party platforms are used to complete these transfers. Thus, these transactions represent the activity of cryptocurrency users - both individuals and companies - independently and autonomously managing their crypto assets.
Over the past decade, user activityBitcoin, controlling their BTC independently and without intermediaries, has increased significantly. From 2009 to 2018, the number of daily processed on-chain transactions grew exponentially from single digits to over 375,000. Although the growth rate of this indicator has slightly slowed over the past 12 months, the number of on-chain Bitcoin transactions per day continues to regularly exceed 300 000 (see diagram below).
On the Ethereum network, transactional activity for theseyears (that is, in the case of Ethereum from the end of 2017) has grown even more. One of the key events in the history of Ethereum that caused a surge in the number of on-chain transactions was the CryptoKitties decentralized application (dApp). CryptoKitties was the first Ethereum dApp to go viral and attracted a large user audience. It was released at the end of November 2018. Two months after the launch, CryptoKitties reached 250,000 registered users and generated $ 4.5 million on the Ethereum network.

Bitcoin and Ethereum on-chain transactions, 30-day moving averages
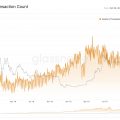
Comparison of the number of on-chain transactions with the priceof these two cryptoassets over time reveals a close relationship between the two metrics. BTC's price maximum was reached almost on the same day that the largest number of on-chain transactions was recorded.
In the early years of Ethereum, correlationbetween the price of ETH and the number of on-chain transactions was almost perfect. However, for both Bitcoin and Ethereum, the relationship between price and number of transactions has weakened markedly since 2018, and fluctuations in one metric do not always lead to changes in another.

Bitcoin on-chain transaction count (orange) and BTC price (black chart), 30-day moving averages.

Ethereum on-chain transactions (orange) and BTC price (black chart), 30-day moving averages.
Obvious relationship between price and quantitytransactions seem to have several cumulative effects. The higher level of activity on the blockchain is a bullish signal for platform use and acceptance, which could persuade investors to value the asset in the markets higher. On the other hand, the rise in the market value of the cryptoasset can be perceived as an expression of a vote of confidence in the network by investors, which will further stimulate its use by individuals and companies.
However, the price of a cryptoasset is influenced by manyfactors other than the number of on-chain transactions, and sometimes an increase in price can be observed even against the background of a decrease in this metric. These factors include (but are not limited to) the number of off-chain trades made without being written to the main blockchain. Large trades to buy and sell BTC on exchange platforms like Coinbase or Binance can trigger an avalanche sequence of trades in the same direction across the entire market.
Regulatory measures takengovernments of countries in relation to crypto assets can be one of the factors affecting both the price of an asset and the number of on-chain transactions. It is difficult to identify all the possible factors that play a role in this dynamic relationship between the price of a cryptoasset and the number of on-chain transactions, and also to quantify the impact of off-chain transactions. However, as a starting point for analysis, the number of on-chain transactions is a relatively easy metric to understand and track.
Metric 2: total value transferred
One example of a transactional metricon-chain activity, which is usually calculated using data on off-chain transactions, is the total value transferred. This metric summarizes the value transmitted through all transactions in the cryptocurrency network over a given period of time. Cryptocurrency networks can vary greatly in the number of transactions and native units of account transferred, so the best way to compare network activity might be to compare transaction activity in dollar terms.
When using only data abouton-chain transactions, the total transferred value can only be summed up in the native units of the cryptoasset network (BTC for Bitcoin, ETH for Ethereum, etc.). This is problematic for two reasons. Firstly, cryptocurrencies are not widely used as currency of account, and therefore the values expressed in BTC or ETH will be perceived by most readers as completely arbitrary and not tied to anything. Secondly, the values obtained will not be suitable for comparison with other cryptoassets or traditional platforms.
To accurately match the value transferredthrough one crypto-asset, with another network (cryptocurrency or not), you need to use a common unit of account. This is most often done by multiplying the market value of the native currency of the cryptoasset (determined off-chain on exchanges) by the data obtained from the cryptoasset's blockchain.
Applying this calculation to Bitcoin and Ethereum with 1January 2020, it can be seen that, although in the native units of the network in Ethereum there are more transactions than in Bitcoin, in terms of dollars, Bitcoin is significantly ahead of Ethereum.

Daily transaction volume of Bitcoin (orange) and Ethereum (black graph) in native network units (left) and in US dollars (right).
Total value transferred in dollar termsnot unlike another popular metric used to rank cryptoassets. Instead of multiplying the market price of a cryptoasset by the number of native network tokens transferred in transactions, the market capitalization is obtained by multiplying the price of the asset by the total number of tokens issued into circulation. Market capitalization provides insight into the relative size of a cryptoasset within the larger crypto market.
Another metric related to the total transmittedcost - the average transferred cost per on-chain transaction. It is calculated by dividing the total value transmitted over the network over a given period by the number of transactions processed in the same time.
When comparing the average transferred value forOn-chain transaction in Bitcoin and Ethereum networks, it is clear that the dollar value of transactions in BTC is, on average, higher than in ETH (see graph below). This observation reinforces the understanding that the two networks have different use cases.
Bitcoin's purpose is to be safe anda stable network for peer-to-peer payments. The dollar value of these payments is usually quite high, averaging over $ 6,000. Ethereum is evolving as a network for deployment and interaction with decentralized applications (dApps). Cases when Ethereum users transfer a large amount of ETH in one transaction to pay for using the application or running it on the network are quite rare.

Average transferred value per transaction for Bitcoin (orange) and Ethereum (black graph).
However, since July 2020, the averagethe dollar value of transactions in Ethereum is skyrocketing. While this is still less than half that of Bitcoin, the growth trajectory of this metric for Ethereum is impressive.
One possible explanation for this trendmay be the recent surge in user activity around financial dApps based on the Ethereum blockchain. Collectively defined as “Decentralized Finance” (DeFi), these types of dApps are designed to mimic the services of traditional financial institutions such as banks, lending platforms, and exchanges. The nature of these services, to a greater extent than gaming or gambling dApps, facilitates and even implies the attraction of significant financial flows.
Metric 3: Turnover
Latest transactional activity metricof cryptocurrencies, which we will consider, is the rate of circulation of units of account. In traditional economics, turnover is calculated as the ratio of a country's gross domestic product (GDP) to the country's money supply. The resulting value is a measure of how quickly currency units are exchanged in a country's economy.
High circulation rate of currency unitsmeans that they often change hands and, therefore, are spent more often than saved. The high velocity of money circulation is also perceived by economists as a sign of a healthy and growing economy.
One of the first to provide a detailed reviewChris Berniske, partner at venture capital firm Placeholder Ventures, was a student of how the turnover metric can be applied to understanding and valuing cryptoassets.
In September 2017, Berniske published a book titled "Cryptoassets: The Innovative Investor's Guide to Bitcoin and Beyond," in which he proposed treating cryptoassets as separate, isolated economies rather than private companies.Instead of gross revenue, profits, etc., Berniske proposed rethinking valuation models for cryptocurrency networks in terms of GDP, money supply base, and inflation.
After the release of Bernisce's book, other prominentrepresentatives of the cryptocurrency industry, including Ethereum founder Vitalik Buterin and founder of the investment firm Multicoin Capital Kyle Samani, presented their versions of this model for evaluating cryptoassets as self-governing economies.
To calculate turnover, in particular, there are several different ways to measure the GDP and money supply of a cryptoasset.
With regard to GDP, the broadest definition of thisthe metrics applied to cryptocurrencies are the total value transferred. The total value transferred is the sum of all coins that have been moved from one address to another in a given period of time.
Dividing this indicator by the total volume of coins issued at the end of the period shows how many times, on average, these coins were spent on the cryptocurrency network.
Calculation of turnover A:
GDP = total value transferred
Money supply = current volume of coins issued
Turnover = total transferred value / current money supply of the cryptoasset
In addition, a slightly more accurate methodology for calculating turnover is to use it as a money supplymean valueof the total number of coins in circulation for the relevant period of time.For most crypto assets with a fixed supply volume, this difference does not affect theHowever, for some assets with a floating supply, which mayvary from month to month as a result of the "burning" of coins (i.e.Taking an average ensures that any changes in the money supply of an asset over a given period will beequally weighted.
Calculation of turnover B:
GDP = total value transferred
Money supply = current volume of coins issued
Turnover = total transferred value / average money supply of cryptoasset for a given period
Another generally accepted calculation methodologyturnover of a cryptoasset, a narrower definition applies to the total value transferred. Rather than summing the values across all on-chain transactions, the metric can be adjusted to exclude any value transfers that are determined to be unrepresentative in the context of significant economic activity.
The line between what should be seen asmeaningful transactions and what not is very subtle. Some blockchain data analytics companies use various techniques to filter out the real economic bandwidth of the blockchain. One of these methods involves the exclusion from the calculation of on-chain transactions sent in quick succession one after another in a short period of time. Such transactions usually occur when the user splits the amount into smaller parts in an attempt to disguise the address of the recipient of a large amount of money.
Turnover calculation B:
GDP = Adjusted total value transferred
Money supply = current volume of coins issued
Turnover = Adjusted total value transferred / current money supply of the cryptoasset
When comparing bitcoin turnover charts,calculated according to methods A and B, a large gap between the obtained values is visible, created by using in one of the cases the adjusted total transferred value. This suggests that a significant part of on-chain transactions is unrepresentative in terms of significant economic activity (at least according to this criterion).

BTC CAGR, unadjusted (orange) and corrected (black graph).
Although the values can be very different, the trends obtained by these two calculations usually confirm each other, moving more or less synchronously.
Thus, the turnover grapha cryptoasset is an illustration of how quickly, on average, coins and tokens are spent on a cryptocurrency network instead of being held in one wallet. However, this should not be taken as a direct representation of how often users transact to purchase goods or services. This is because on-chain transaction data does not clearly distinguish between transactions initiated by one or different users.
In order to more accurately reflect the realthe level of economic activity on the blockchain and compare it with other blockchains or state economies, when processing data about on-chain transactions, it is necessary to apply some additional assumptions and heuristic rules.
Conclusion
While on-chain transaction data is easy to obtain,it can be difficult to draw meaningful conclusions from them when taken literally. When not properly correlated with off-chain data, such as the market price of an asset, it can sometimes be misleading.
As a starting point for analysis,the number of on-chain transactions, the total transferred value, and the unit velocity are useful metrics to help track changes in the transactional activity of a cryptoasset over time. The novelty of cryptoassets is largely based on how their technology allows value to be transferred directly and without third party oversight.
Nonzero value for any of these threeindicators is a confirmation of the usefulness of the platform. However, based on these metrics, it is not possible to guess which use case predominantly determines economic activity in the cryptoasset ecosystem.
Thus, the next step for analysis, onwhich is naturally indicated by data on on-chain transactions, is the identification of off-chain circumstances and trends that induce users to make transactions with Bitcoin, ether and other cryptocurrencies. Whitepaper and statements from the main developers of most cryptoassets often point quite clearly to the intended use cases for the respective cryptocurrency.
of cryptoassets leaves the choice of their practical application in the hands of users, whoever they are and wherever they are. This makes the analysis of cryptoassets a highly iterative process that will continue to evolve as the user base of these assets evolves.
�
</p>Read this:
 ETH Transaction Count Beats All Records
 Study: the number of transactions in the Bitcoin network has been decreasing since June of this year
 Ethereum transaction volume is growing rapidly
 Elliptic: “The number of illegal transactions with BTC decreased to 1%”
 The history of on-chain data research by Nick Carter
 Analysis of data on bitcoin futures indicates the imminent growth of BTC