Forex channel strategies are based on price movement within a certain range. Channel boundaries can bestatic or dynamic, depending onmarket conditions - trend or flat. Traders have long noticed that the price does not move in a straight line. Its movements represent fluctuations around some average value. The price deviates from it in one direction or the other and constantly strives to return to it.
A price channel can be built manually by connectinghighs and lows, you can use technical indicators. There are different algorithms used for calculating channel boundaries, but all channel strategies boil down to trading from the channel boundaries or for a breakout. The channel boundaries represent support and resistance lines. Most of the time the price moves from one border to another. This makes it possible to determine with high probability the point of entry into the market and exit from the position.
Manually built channels are trendinglines connecting the maximum and minimum price values. The MetaTrader service has a graphical tool - an equidistant channel. With its help, you can build a channel, the boundaries of which are represented by two parallel lines.

Equidistant channel in Metatrader, USDCAD chart, m30
Channel strategies work on any instruments and timeframes.
BOLLINGER STRIPES
One of the most popular and sought afterThe tool for trading in the channel is the technical indicator “Bollinger Bands” (“Bollinger Band”). On the chart, the indicator looks like three lines. The average is a moving average, the other two are calculated by the standard deviation of the moving average for a certain period.
The indicator is unique in that it describes the current state of the market.
Depending on market activity, the boundary lines may converge or diverge. This fact alone gives the trader food for thought. The bands are converging - the market is flat and calm.
The bands begin to diverge - directional movement develops. The stronger the divergence of the channel boundaries, the stronger the trend.
Working on his indicator, John BollingerThe goal was to find a principle for calculating boundary lines so that 95% of the time the price would be in the channel range. Thus, we can assume that having bounced off one of the channel boundaries, the price will reach the other. With sideways movement and slight market volatility, Bollinger Bands narrow and move almost horizontally.
Breakout of the channel border and closing of the candle behind the topor the lower border - the strongest signal to continue the movement towards the breakout. If this is accompanied by a divergence of the outer boundaries of the Bollinger Bands, then the end of the sideways movement and the beginning of a trend are observed. As a rule, in this case the price moves along the channel border for some time. Confirmation of the development of a trend is always the divergence of the boundaries and their direction towards the trend movement. The possible end of the trend is indicated by the narrowing of the outer boundaries of the channel.
Price may cross the external border of the channel atfalse breakdown. Identify a false breakdown will help the state of the Bollinger bands. If the external boundaries of the channel will remain horizontal, then the development of such a movement will not follow.

Channel strategy using the Bollinger Bands indicator
The Bollinger Bands indicator remains one of thethe most relevant and popular technical analysis tools. Understanding the logic of this indicator makes it possible to determine the exact entry point into a trade when the price goes beyond the boundaries of the channel, which signals the beginning of a trend, and also provides entry points for sideways movement.
KELTNER CHANNEL
The popular Keltner Channel indicator is very similaron Bollinger Bands, the differences relate to the methods of calculating the boundaries and the center line of the channel. The author of the strategy, Chester Keltner, based the calculation of the central line on a ten-day simple moving average. The boundary lines represented the difference between the maximum and minimum price values over a ten-day period. In 1980, professional trader Linda Raschke introduced a modified version of the Keltner Channel, where she used the ATR indicator to calculate the boundaries of the channel.
Strategies based on this indicator are most often used by scalpers.
About other short-term Forex strategiesread here.
In order to start trading with the Keltner Channel indicator, you need to transfer it to Metatrader:
Trading is identical to any Forex channel strategy.
Red lines are the outer boundaries of the channel.
The blue line is the middle line.
The boundaries of the channel can diverge - and this reflects the strengthening of the trend movement, or they can converge - during a flat.
During a trend movement, traders trade using the “breakout” technique of the channel border. The signal to open a trade will be the closing of the candle outside the channel.
Stop-Loss is set beyond the opposite boundary of the channel. As the price moves, the stop can be moved along the border of the channel.
During night sessions the market is often inside channel - flat. For such a situation, the rebound trading technique from the channel boundaries is more suitable. Transactions are concluded when the candle breaks through the channel border in the opposite direction.
For example, if the upper boundary of the channel breaks through, a sell trade is opened, and vice versa.
The logic is that the price will not be able to move far fromchannel boundaries, as there is a lack of market activity. Stop order levels are set based on each specific situation. But this should be the minimum level that makes it clear that the market has gone against the deal. Then it is better to close the position with minimal losses.

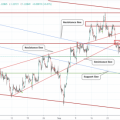
GBPUSD minute bars, trading strategy in the Keltner channel.
Read this:
 Trading signals! | quarantined gold and what about cryptocurrency / review of forex market / cryptocurrency market /
 GBPUSD continues to decline. BTCUSD is going up.
Forex Academy. Lesson 16. Determine the effect on the price of news release on the chart
Trading signals! | Forex Signals and NYSE Stocks by Bill Williams Trading Chaos System. Grail in Stock Trading
The collapse of Forex brokers / How not to lose money? The Truth About Forex Brokers and Industry in 2020
Forex Academy. Lesson 12 Determine the price levels of long and short transactions Forex Academy.
GBPUSD continues to decline. BTCUSD is going up.
Forex Academy. Lesson 16. Determine the effect on the price of news release on the chart
Trading signals! | Forex Signals and NYSE Stocks by Bill Williams Trading Chaos System. Grail in Stock Trading
The collapse of Forex brokers / How not to lose money? The Truth About Forex Brokers and Industry in 2020
Forex Academy. Lesson 12 Determine the price levels of long and short transactions Forex Academy.