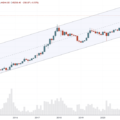
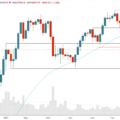
Little has changed on the weekly chart. But here's something really interesting: we now have threered candles in a row.This doesn't happen very often. This did not happen at all in the 2021 bear market, even when Bitcoin fell from $65K to $28K and consolidated throughout the summer. Do you know what happens even less often? Four red weekly candles in a row. In fact, the last time 4 consecutive downward candles were formed was in October… 2019. There has to be a rebound in here somewhere, and I think it could be starting around now, for a variety of reasons.
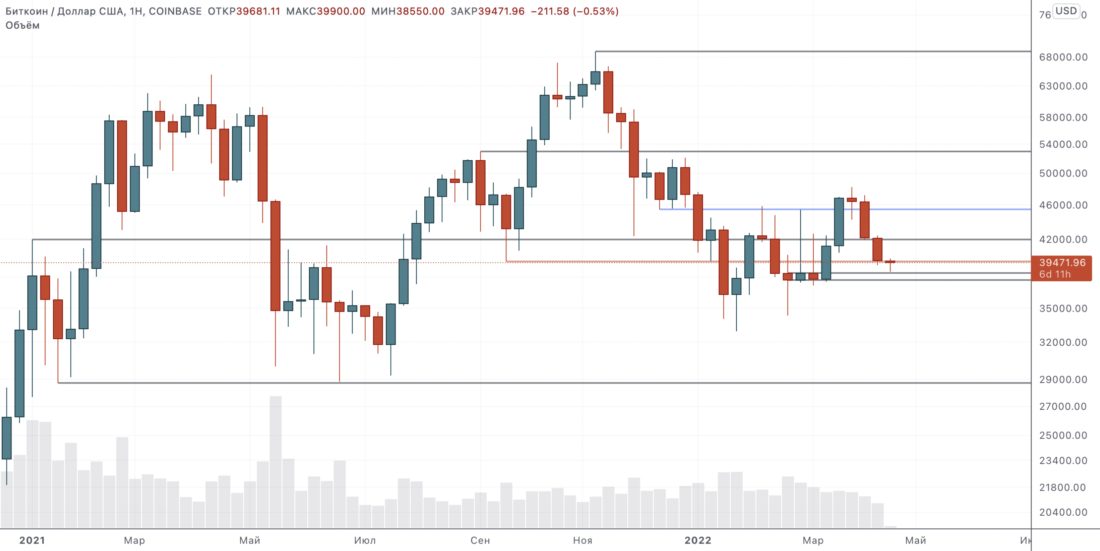
The market closed the week exactly at the support level,before going lower with the start of a new candle. Not ideal, but there is still a full week to close higher and hold support. The next support zone is located at $37.7-38.4 thousand. The candle opened today has almost touched this area.
However, the assessment of the current candle will have to wait until the end of Sunday.
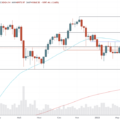
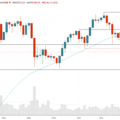
Daily chart
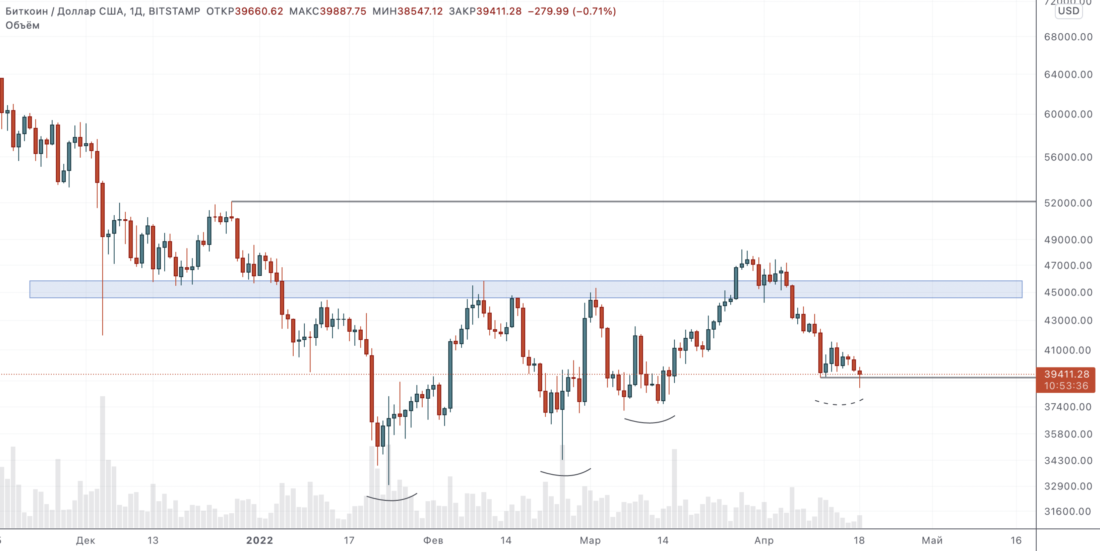
Bitcoin is holding a larger low for now.
At the level of $39.2 thousand.It is worth paying attention when closing today's candle. A close above this would give some hint that liquidity has been found below this level and the price is now ready to head higher. A close below will mean a breakdown of local support.
There is also potential for a bullish divergence with the RSI on all timeframes from the daily and below.
12 hour chart
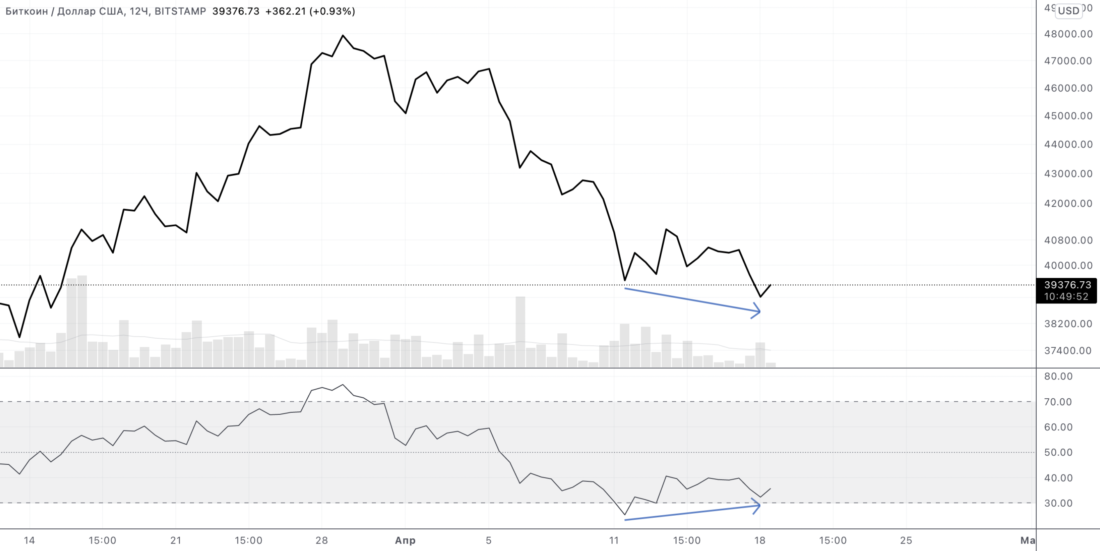
The 12-hour chart shows the potential for a bullishdivergence with RSI leaving the "oversold" zone. This is one of my favorite setups, so I tend to pay close attention to it. The divergence has already been confirmed on the 6- and 4-hour charts, albeit over a longer period than would be optimal. If the current 12 hours end with growth, then the divergence on this timeframe will also be confirmed by a clear upward movement of the RSI.
My favorite long setup is when bullishdivergence is confirmed on several timeframes, one after another, like a domino effect. It could happen here too. If confirmed on the 12-hour chart, it will be possible to state confirmation on all timeframes up to 12-hour, and then the daily one will come into play.
With this in mind, it seems increasingly likely to me that a local bottom has already been found and is forming right now.
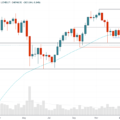
4-hour chart
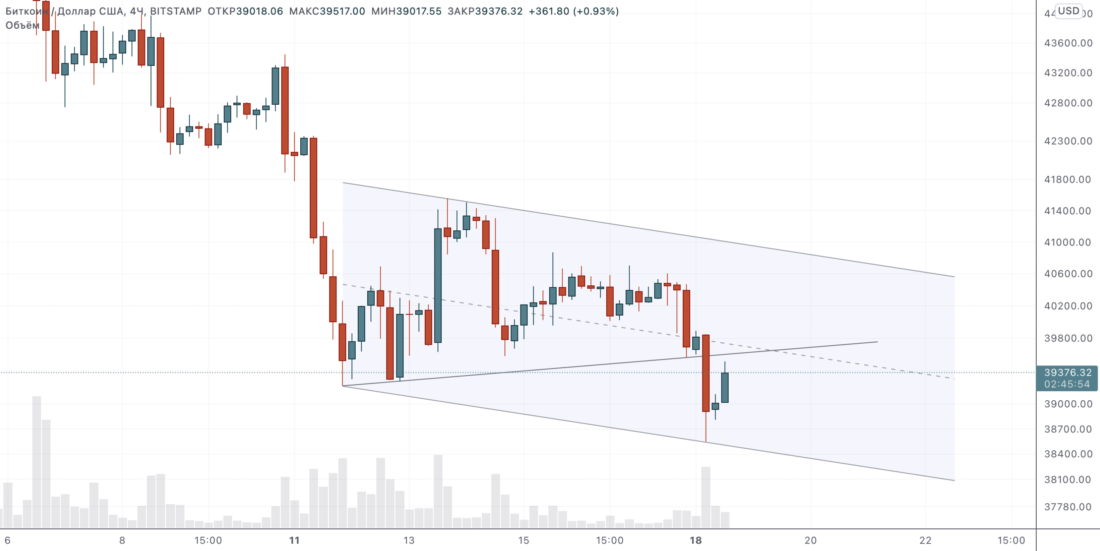
As you can see, the price has broken through the support of the blue line,which is not ideal. However, now it has marked a probable downward channel, however, not yet confirmed, since it is impossible to state two alternating touches of the upper and lower boundaries.
Nevertheless, the idea is there, and the downward pattern should eventually disintegrate.
Of course, the price can go down and find support somewhere lower or somehow refute this thesis, but at the moment it seems that it gives additional confirmation to the idea of divergences.
BitNews disclaim responsibility for anyinvestment recommendations that may be contained in this article. All the opinions expressed express exclusively the personal opinions of the author and the respondents. Any actions related to investments and trading on crypto markets involve the risk of losing the invested funds. Based on the data provided, you make investment decisions in a balanced, responsible manner and at your own risk.
Based on source
Read this:
 Support retest, both expected and decisive - technical analysis of April 01, 2022
 Bad news - technical analysis from April 11, 2022
 Good news - technical analysis from April 4, 2022
 Technical analysis from February 4, 2022
 You wanted volatility - technical analysis of January 21, 2022
 Uncertainty and Potential for a Defining Week - Feb 21, 2022 tech analysis