Blockchain technology opens up broad opportunities for monetary analysis that are not available in traditionalfinance. In particular, modern tools of on-chain analytics allow us to find out the real balance of power between whales and small market participants. You can also find out how the distribution of assets among large coin holders is changing in anticipation, background and after significant price changes.
Ossified proponents of traditional financeoften express an inequality in the distribution of assets among Bitcoin holders. Well-known economist Nuriel Roubini once said that “bitcoin is worse than North Korea” because of the uneven distribution of wealth. He has repeatedly argued that decentralization is a myth. Digital gold is often criticized by the head of Ripple, Brad Garlinghouse, who believes that it, like Ethereum, is controlled by Chinese miners.
How right are the critics of digital currencies? What is the current situation with the distribution of wealth among popular coins? To answer these questions, ForkLog magazine offers readers the translation of a review article by Analyzing Crypto Supply Distribution Patterns from CoinMetrics researcher Nate Maddry.
Those in whose hands wealth is concentrated, oftencontrol power. But so far, the distribution of wealth has been difficult to track. People often hide information about the size of the state and assets.
Cryptocurrencies have taken a big step towards transparencydistribution of wealth. This is the first class of assets that provides the ability to track all the information about the distribution of offers throughout the history of transactions.
Because every cryptocurrency transactionit is public and verifiable; using on-chain data, balances can be determined at each address. You can also study the distribution of balances at individual addresses in order to obtain detailed information on the supply of coins.
However, the distribution of the proposal cannot givecomprehensive understanding of the distribution of wealth. People often create many addresses, and it’s difficult to determine which of them belong to a particular person. In addition, one address can refer to many users, as, for example, in the case of a cold exchange wallet.
To get a clear picture, you need to find outwho controls each address. The amazing properties of the blockchain make it possible not only to come close to solving this problem, but also to identify various patterns of asset use.
For example, the tendency to even distributionmay be a sign that the asset is increasingly being used in real transactions as a medium of exchange. Analysis of sudden changes among addresses with large balances can also give a lot of insights related to trading activity.
In this article, we will consider changes in the distribution of offers among eight cryptocurrencies and find out what this can say about the use of each of the coins.
Methodology
The graphs in this material show the percentage of an asset’s supply stored in different categories of addresses.
First, we looked at the balances for each individual address. Then — grouped addresses by volume of funds, ranking them from relatively small to relatively large.
For comparability of information on variousassets, we grouped balances by share of total supply. The classification begins with addresses with one ten billionth (1/10 billion, 0.0000000001% billion) to addresses with one thousandth of a share (1 / 1k, 0.001%) of the total supply.
For context: at the time of writing, the volume of the first cryptocurrency was 18 214 117 coins. Thus, one ten billionth of the total Bitcoin supply was 0.0018214117 BTC, which is equivalent to approximately $ 16.
These addresses were then grouped into separateranges based on balance value. We started with addresses that store at least 1/10 billion, but no more than 1/1 billion; then — 1/1 billion, but not more than 1/100 million, etc., reaching addresses containing 1/1k or more (1/1k+).
Finally, we calculated the amount of the offer,stored at the addresses of each category. This made it possible to obtain a percentage of the total supply for each group. The price is marked on the Y axis, which makes it possible to track changes in the market value of an asset when the distribution changes.
Note that the differences between the protocolssignificantly affect distribution. For example, the offer of coins on blockchains using the UTXO model (outputs of unspent transactions) becomes more distributed over time. This happens for natural reasons - new addresses are often created for each transaction. This, however, is not visible on networks like Ethereum, where addresses are often reused.
Bitcoin
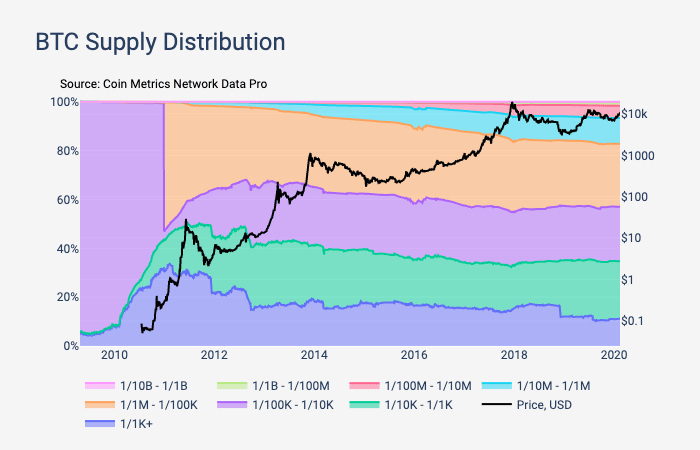
At first, the BTC proposal was concentrated among several individuals, but over time, it was scattered across millions of addresses.
The share of BTC held at major addresses (with a balance of at least 1/1 of the total supply) peaked at 33% in February 2011.
In February 2020, at such addresses were storedonly 11% of the total supply. At the same time, the percentage of proposals held by small addresses with balances of 1/10 million or less has been growing steadily since 2011.
Decreased share of supply heldlarge addresses, before a significant price increase - from the end of 2011 to the beginning of 2013. A similar process took place in December 2018, which was probably caused by the redistribution of funds on Coinbase cold wallets.
Ethereum
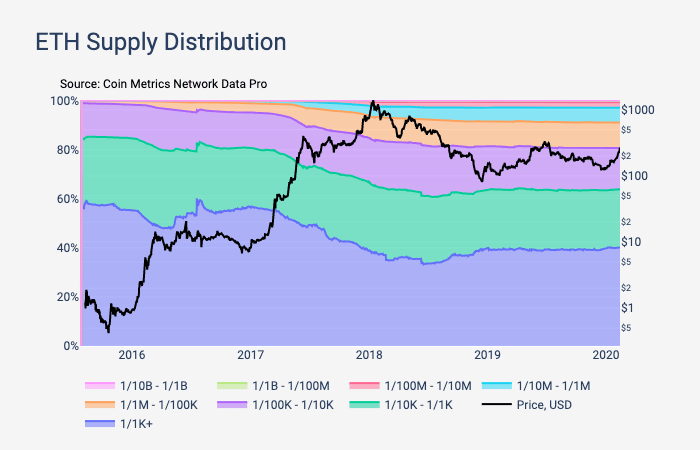
Unlike Bitcoin, the originalEthereum distribution (ETH) occurred through crowdsale. At first, the ETH offer was heavily concentrated on large wallets, but over time the distribution became more even.
The percentage of offers at large addresses (not less than1 / 1k of the total supply) peaked at around 60% in July 2016. The volume held by these addresses decreased significantly against the background of an ICO bubble blown - from the end of 2017 to 2018. In February 2020, about 40% of the total ETH supply was stored at such addresses.
The share of coins at relatively small addresses (from 1 / 100k of the total supply or less) has been growing steadily since 2016.
Litecoin
Litecoin had a few notable ones in 2013downturns in the number of coins held by large addresses (at least 1 / 1k of the total supply). This happened just before the price surge in December 2013, during 2017 and before the peak in January 2018.
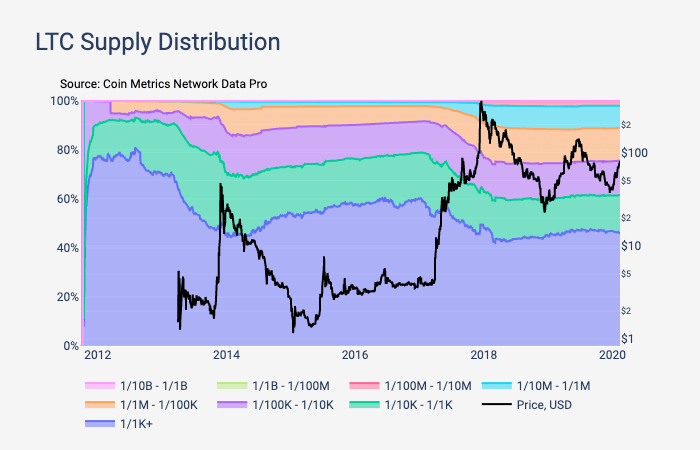
Interestingly, almost 46% is still focused on large LTC addresses. Bitcoin, as mentioned above, has a figure of 11%.
Bitcoin Forks
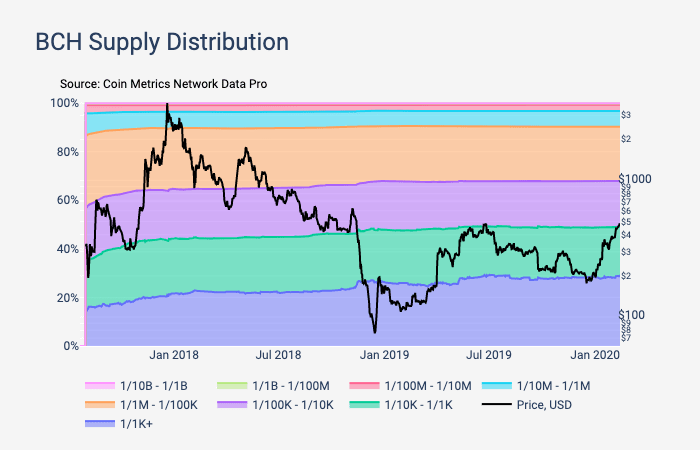
During hard fork, such networks inheritBitcoin offer distribution. That is why forks at first could seem relatively evenly distributed. However, unlike Bitcoin, the offer of Bitcoin Cash (BCH) over time has become increasingly focused on large addresses.
When Bitcoin Cash separated from the Bitcoin network inOn August 2017, approximately 14% of his proposal was at major addresses. At least 1 / 1k of the total coin supply was stored on each of them. In February 2020, over 29% of BCHs were located at large addresses.
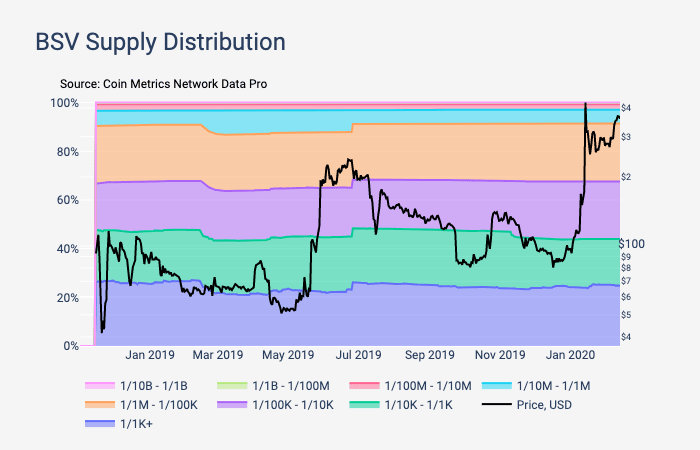
The share of Bitcoin SV (BSV) on addresses with a balance of at least 1 / 1k remained almost unchanged, if you do not take into account the significant decline in February 2019 and a sudden increase in June 2019.
In 2018, when BSV appeared, about 26% of the total supply of the new coin appeared at the corresponding addresses. In February 2020, this figure was around 24%.
Ripple and Stellar
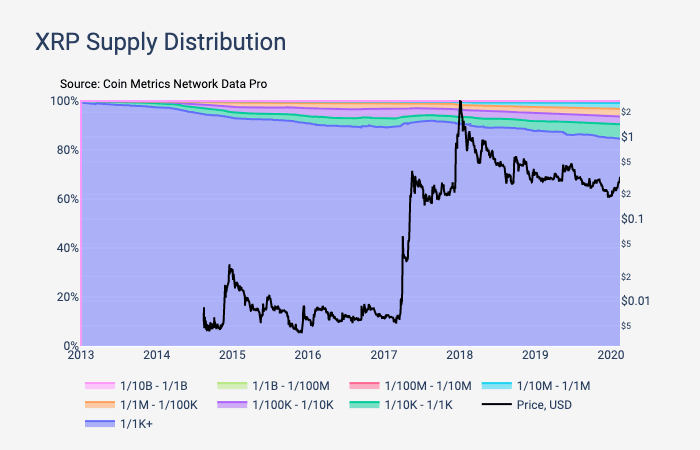
Ripple (XRP) and Stellar (XLM) - Networks Basedaccount systems, behind which there are formal organizations that control a significant part of the proposal. About 85% of the total number of XRP tokens is located on addresses with a balance of at least 1 / 1k.
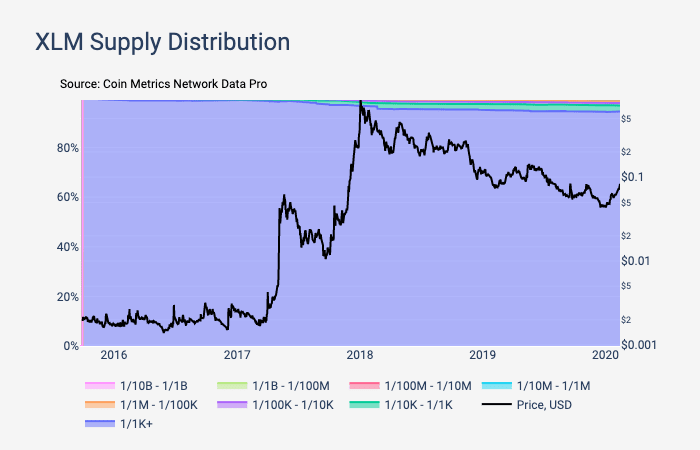
Approximately 95% of XLM is stored on addresses with a balancenot less than 1 / 1k of the total offer. This is largely due to the fact that the Stellar Development Foundation (SDF) holds more than half of all coins (29.4 billion XLM).
In the fall, SDF burned 50% of the total XLM supply,reducing it to 50 billion coins. However, after sending to the address for burning, these coins are still displayed on the blockchain as part of the total monetary mass.
Tether
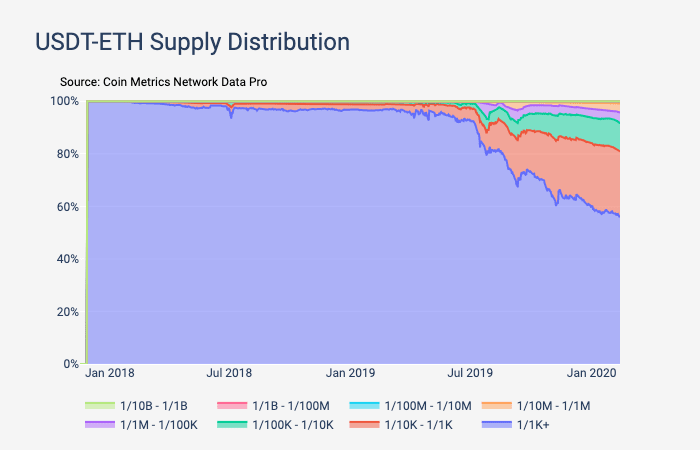
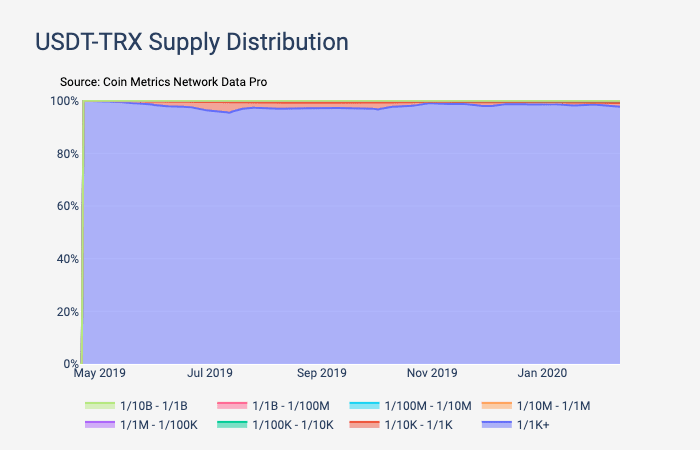
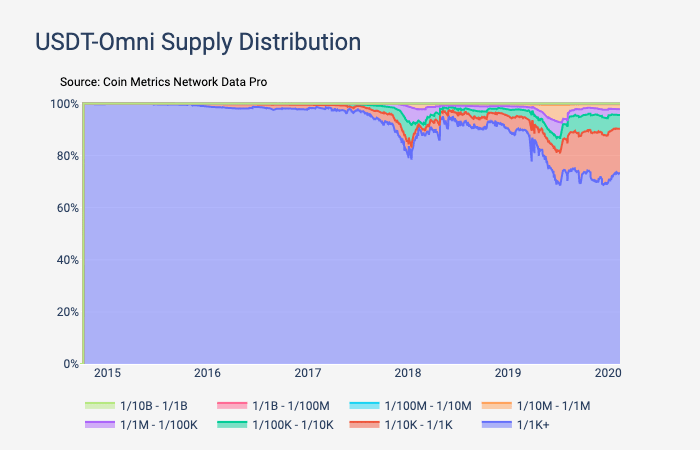
Tether, by most criteria beingthe largest stablecoin, issued tokens on several blockchains. As part of this analysis, we reviewed the versions of Tether on the Omni (USDT-Omni), Ethereum (USDT-ETH), and Tron (USDT-TRX) networks.
All three versions of Tether come from the absoluteconcentration of assets. However, USDT-Omni and USDT-ETH have become more and more distributed over time. The reason for this can be explained by the demand for assets as a medium of exchange, as a result of which funds from large addresses flow to addresses with small balances.
The Tron version of Tether (USDT-TRX), however, is almostfully controlled by large addresses. This is a sign that USDT-TRX has not yet gained popularity as a medium of exchange. On the other hand, this version of Tether was introduced relatively recently - in the spring of 2019.
We also note that the jump in the concentration of USDT-Omni occurred in January 2018, against the backdrop of a peak in the price bubble in the market.
***
The on-chain analysis of the offer, which is impossible among traditional tools, gives a clear picture of the distribution of wealth, as well as insights related to trading activity.
Dispersing assets like BTC and Tether bydifferent categories of addresses is a positive sign. This indicates the real use of these assets, which ultimately settle among a large number of individual users.

