Glassnode specialists analyze the distribution of bitcoins between network participants and show that ownershipbitcoins are distributed over timeevenly and turns out to be much less concentrated than many believe. At the same time, the share of BTC supply controlled by "whales" has recently increased, which is confirmed by numerous data on the arrival of institutional investors on the market.
A recent Bloomberg report states that “2%accounts control 95% of the Bitcoin supply. " Bitinfocharts shows a similar distribution of BTC by address. Many others have also reported comparable statistics showing a huge concentration of wealth in the Bitcoin network.
The problem with these reports is that they analyze the distribution of BTC across the networkaddresses... The result is misleading statistics that form a misleading picture of BTC distribution among users.
In particular, this approach has two important drawbacks:
- Not all Bitcoin addresses should be treated the same.For example, a distinction must be made between exchange addresses, which hold funds for millions of users, and individual user addresses.
- A Bitcoin address is not the same as an “account”.One user can control several addresses and one address can store funds from many users.
In this work, we analyze the distributionbitcoins between entities of different sizes, taking into account also the addresses associated with exchanges and miners. We want to shed more light on the true underlying distribution of BTC among network participants and show that bitcoin ownership is much less concentrated than it is often reported. In addition, there has been a tendency for it to dissipate over the years. In addition, we will show that the share of BTC held by whales has increased significantly over the past year, which is further evidence of an influx of institutional investors.
About the subjects participating in the Bitcoin network: bitcoin addresses are base addresses recorded inblockchain public addresses from which BTC is sent and received. Thanks to the application of various heuristic rules and advanced clustering algorithms, it is possible to determine with a very high degree of confidence which cluster of addresses is controlled by one network entity. This sets an upper bound for the actual number of network participants, which means that the subsequent analysis is based on data close to the true number of its participants. For a more detailed description of the method, refer to this translation of one of the previous Glassnode articles.
Bitcoin supply distribution
We have divided the actors of the network according to the amount of bitcoins they hold into the following categories of marine animals:
- shrimp (<1 BTC),
- crabs (1-10 BTC),
- octopuses (10-50 BTC),
- fish (50-100 BTC),
- dolphins (100-500 BTC),
- sharks (500-1000 BTC),
- whales (1000-5000 BTC),
- megawhales (not to add more “humpback whales”) (>5000 BTC).
We do not include well-known exchanges and miners in these categories and consider them separately.
As of January 2021, the distribution of Bitcoin supply between these categories of network entities is as follows:
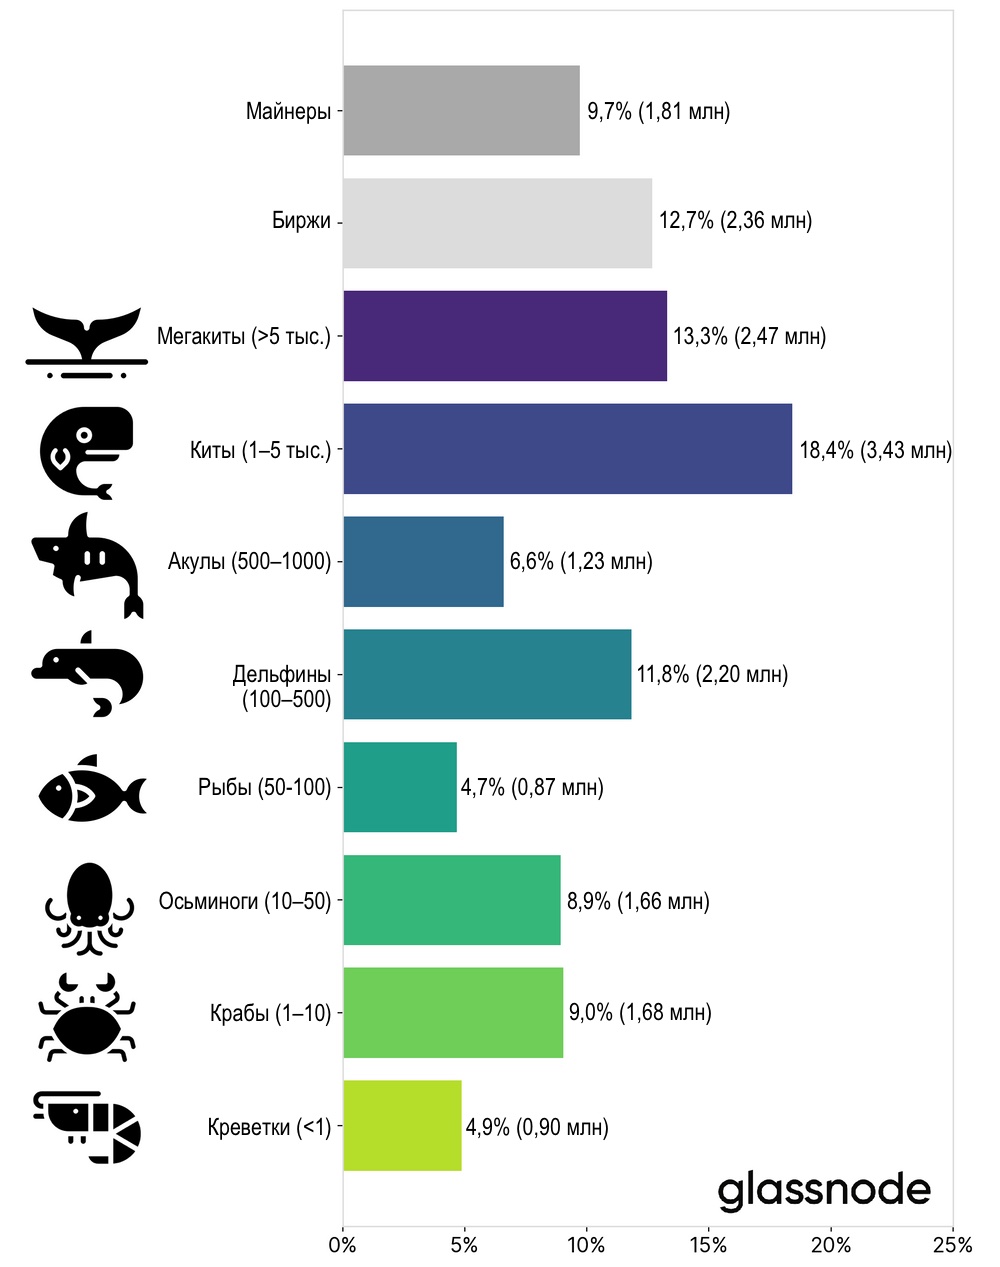
Figure 1 - Estimated distribution of Bitcoin supply among network entities as of January 2021.
At the high end of the spectrum, whales and megakitsrepresent the largest (besides exchanges) network entities, controlling a total of about 31% of Bitcoin supply. Most likely, these entities include companies, funds, custodians, OTC operators and other wealthy people.
At the other end of the spectrum, small entities owningno more than 50 BTC each (shrimp, crab and octopus). Together they control almost 23% of Bitcoin's supply. This shows that a significant amount of BTC is in the hands of retail investors.
Onpictures 2and3shows the distribution of supply between typesnetwork actors over time. In particular, it is clear from these charts that the (relative) amount of BTC held by small network entities has increased throughout Bitcoin's history.
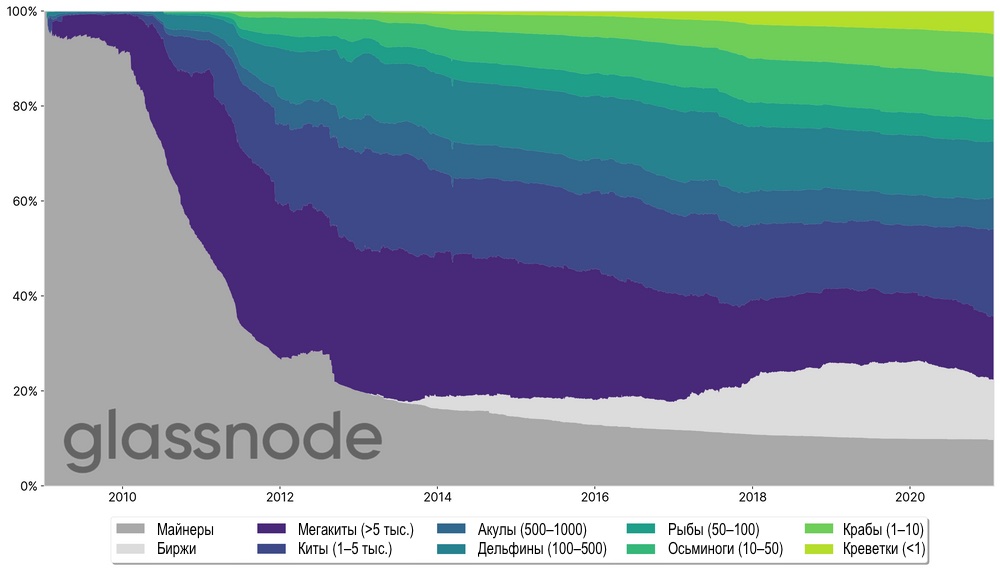
Figure 2 - Estimated distribution of bitcoins among network actors over time.
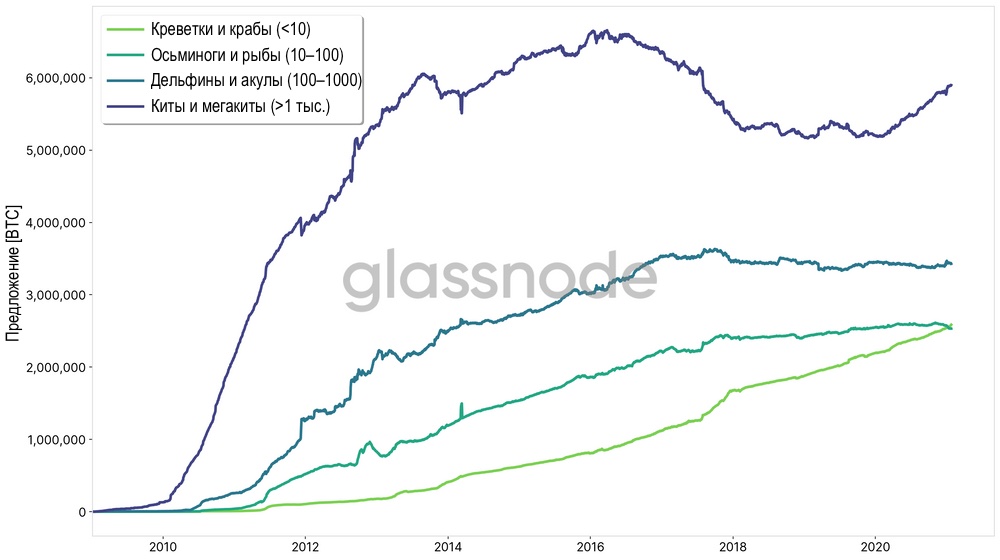
Figure 3 - Estimated distribution of bitcoins among network actors over time.
Note the uptrend in the relative proportion of whales that has formed in the past year. Below we will consider this issue in more detail.
The shift towards more dispersed ownership of BTC supply over recent years becomes more apparent when looking at the relative change in supply across these entity types. OnFigure 4it is shown that the smallest players (shrimps andcrabs) have increased their BTC holdings by 130% since 2017. The second largest participants (fish and octopus) also increased the volume of controlled BTC by 14% over the same period.
On the other hand, the ownership share of large players (dolphins and sharks, as well as whales and megakits) declined by 3% and 7%, respectively.
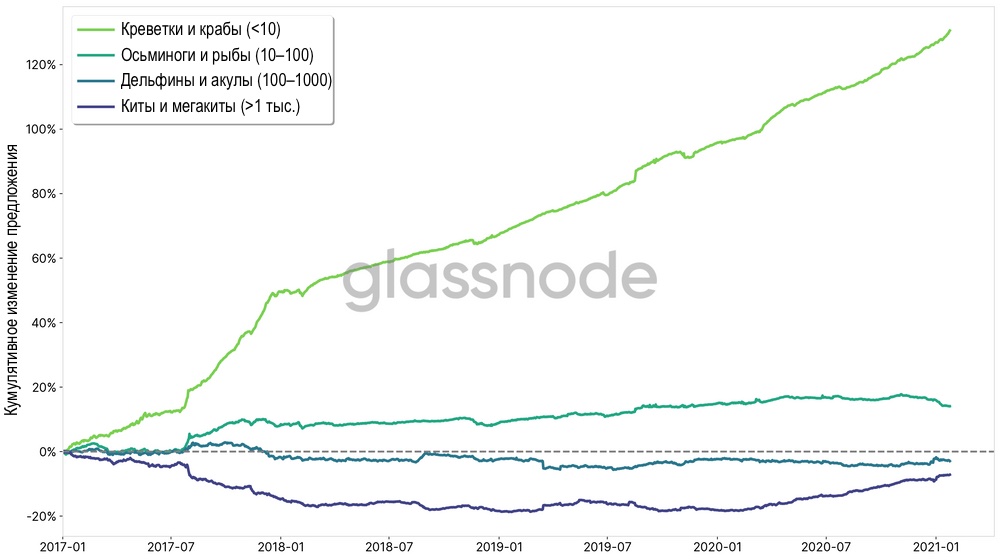
Figure 4 - Cumulative change in the share of ownership of the BTC supply by entities of various sizes since 2017.
Number of subjects
Now let's take a look at the number of subjects in each of the categories mentioned above. OnFigure 5shows the estimated number of participants in each category of BTC owners.
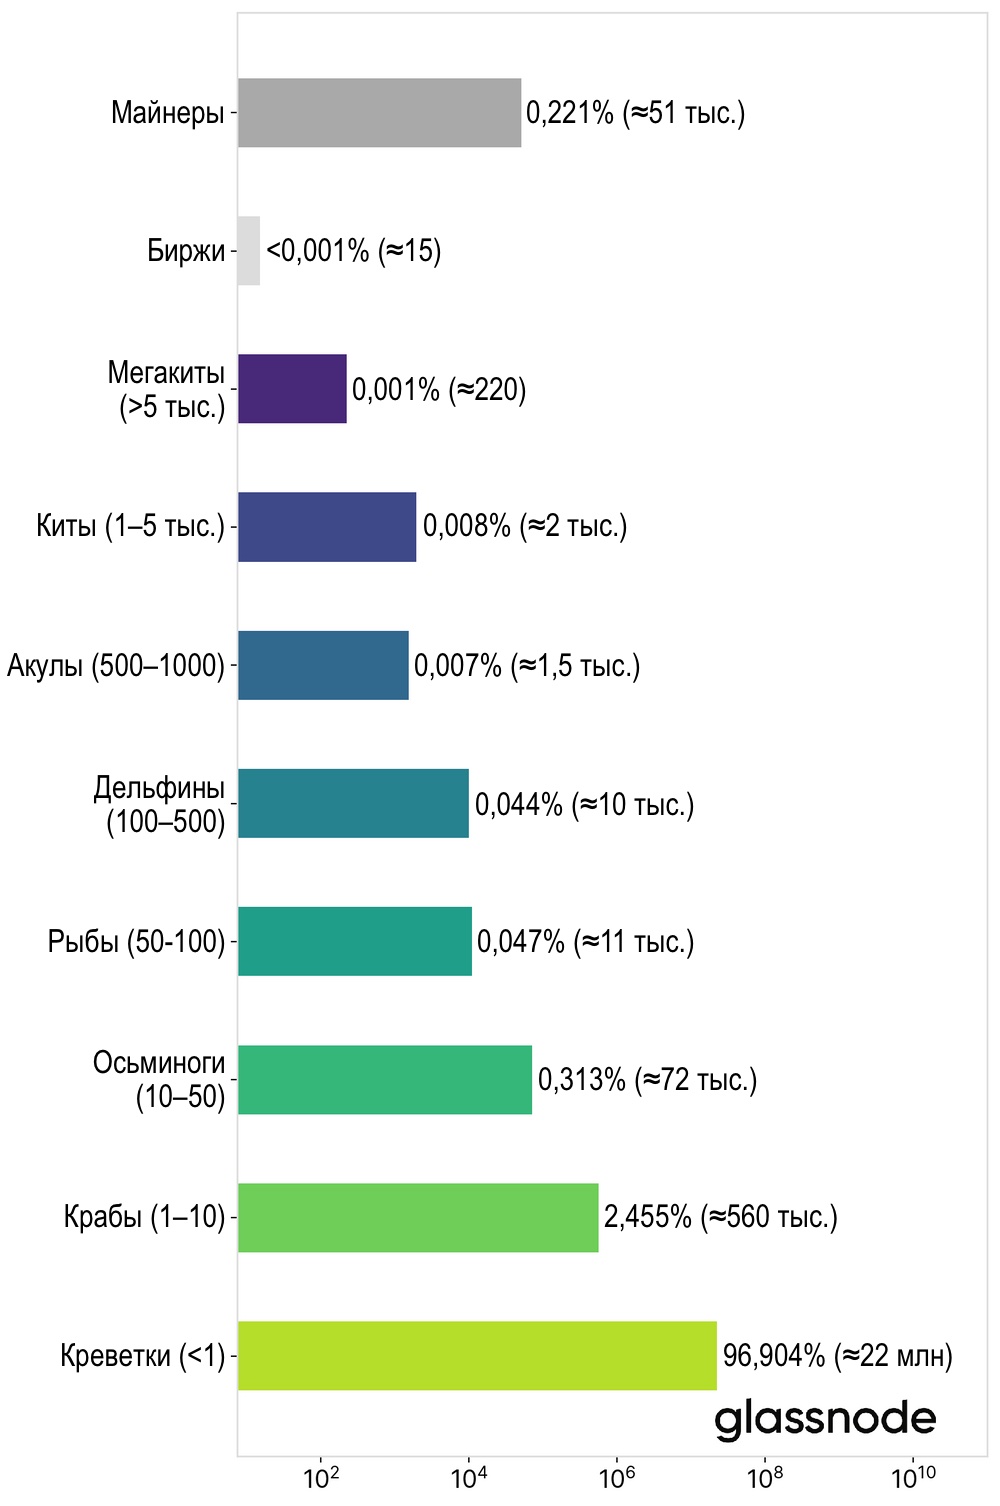
Figure 5 - Estimated number of network entities by the number of BTC they hold (as of January 2021, log scale).
As expected, the number of subjects assessedstrongly biased towards small owners. Combining these numbers with the supply distribution data above, we get the following graph, which gives some insight into the true distribution of wealth in the Bitcoin network:
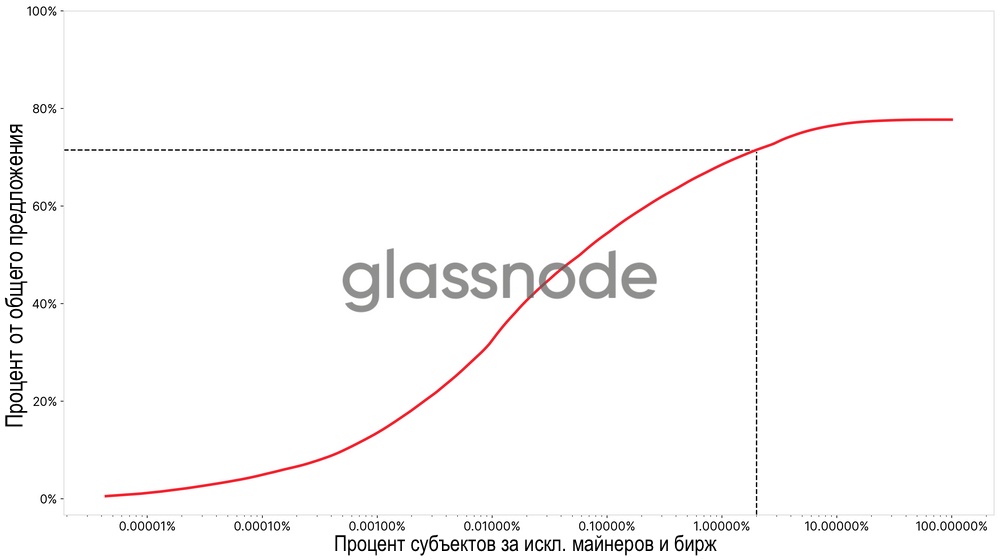
Figure 6 - Estimated percentage of Bitcoin supply controlled by network entities (log and lin. Scales).
From this we can conclude that about 2% of the network entities control 71.5% of the total Bitcoin supply.Note that this figure differs significantly from the common statement that “2% control 95% of supply.”
Discussion
The above figures represent an estimateupper boundthe true distribution of Bitcoin ownership. We expect the actual distribution to be more evenly dispersed across subjects of different sizes.
Here are some points to keep in mind:
- Custodians.This analysis does not take into account Grayscale and othersproviders of custodial services for institutional investors. However, their BTC is most likely in the “whale” and “megawhale” baskets. Given that their assets (Grayscale controls ~650,000 BTC at the time of writing) are owned by multiple participants, this would shift some of the whale supply towards smaller players.
- Lost coins.The origin of many of the lost coins dates back toback to the early days of Bitcoin, when best practices for storing Bitcoins were not yet widely accepted. Additionally, given the low value of Bitcoin in the early stages, large amounts of BTC were more often held in a single address and wallet. Taking into account lost coins would potentially shift the distribution towards wider dispersion.
- Wrapped BTC.At the time of writing, about 119 million BTClocked in the ERC20 token WBTC. The custodian stores these coins in addresses with a balance of at least 1000 BTC each. Again, given that these bitcoins are owned by many investors, more detailed accounting of them would also shift the distribution of supply toward greater dispersion.
- Estimated number of small network entities.The total number of network entities is likelymuch lower. Our methodology is very conservative in the sense that we have optimized it to avoid false positives. However, many addresses still cannot be grouped into one cluster, into one subject. Finally, not all heuristics and clustering algorithms will always work immediately, especially if coins do not move on-chain. For example, the current supply of addresses that have never been spent is 2.6 million BTC. This is especially true for small entities (e.g., from the “shrimp” category), which means that the actual number of network participants in these ranges is most likely significantly lower.
- Offer on exchanges.Exchange users can have a lot of influenceto the distribution described here. It is estimated that the number of exchange users is approximately 130 million (link in English PDF). It is reasonable to assume that the vast majority of them are retail investors classified as small entities. Including analysis of stock addresses would have two effects: the number of small entities would greatly increase, further skewing the distribution. On the other hand, distributing the exchange supply (2.3 million BTC) into baskets of smaller network entities would smooth out the distribution in favor of retail investors. However, the precise interaction of these two factors requires further assessment.
Whale Growth: Institutional Investors Come Into the Game
As mentioned above, in the last fewmonths, there has been a significant increase in the number of bitcoin whales and the share of BTC supply they control. This can be seen both in the increase in the supply they control and in the growth in the absolute number of subjects in this category.
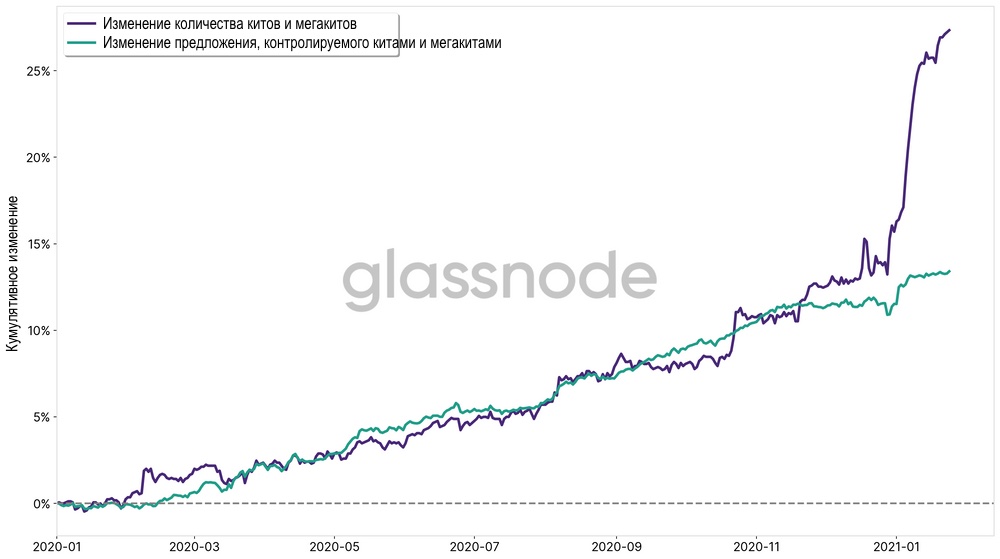
Figure 7 - Cumulative change (since 2020) in the number of subjects from the categories of whales and megakits, as well as the BTC supply controlled by them.
Since the beginning of 2020, the share of supply,controlled by large network entities (whales and megakits) increased by 13.4%, and the number of entities of these categories increased by more than 27% and amounted to 2,160 units. Notice, in particular, the sharp rise in 2021 - this is confirmed by the current narrative about the influx of wealthy people and institutional investors into the crypto sphere.
I believe that this is a strong bullish factor that plays in favor of the rise in the price of bitcoin in the coming months.
The article does not contain investment recommendations,all the opinions expressed express exclusively the personal opinions of the author and the respondents. Any activity related to investing and trading in the markets carries risks. Make your own decisions responsibly and independently.
</p>
Read this:
 Whales actively buy BTC ahead of halving in May
 Buying on a decline: investors accumulate bitcoin ahead of halving
 Bitcoin price is NOT "too damn high"
 Bitcoin whales have increased their assets during the depreciation of BTC
 Large investors began to actively buy bitcoin
 Types of monetary policy of cryptocurrency projects – supply and issue