The global reduction in liquidity has led to a decline in assets to new lows and continues todestroymarkets. From central bank balance sheets to the M2 money supply, how does this all affect bitcoin?
One of the most important factors in any marketis liquidity, which can be defined in different ways. In this article, we will talk about some ways to think about global liquidity and its impact on bitcoin.
One of the types of liquidity at a high levelare the balance sheets of central banks. When central banks acted as marginal buyers of their own sovereign debt, mortgage-backed securities and other financial instruments, this provided the market with more liquidity to buy assets further down the risk curve. A seller of government bonds is also a buyer of another asset. When more reserves, money, capital, etc. appear in the system. (however one describes it), they have to go somewhere.
In many ways, this has led to one of the mostsignificant waves of asset appreciation in the world over the past 12 years, coinciding with a new era of quantitative easing and experiments in debt monetization. The balance sheets of the central banks of the US, China, Japan and the European Union reached more than $31 trillion earlier this year, nearly 10 times their 2003 levels. The upward trend has been in place for decades, but the fiscal and monetary policies of 2020 during the global crisis have driven balance sheets to record levels.
Since the beginning of this year we have seen a peak in assetscentral banks and global attempts to somehow reduce these balance sheets. The S&P500 peaked just two months before all the "quantitative tightening" efforts we see today. Although it is not the only factor that determines prices and valuations in the market, it has affected the price and market cycle of Bitcoin in the same way. The yearly peak in the rate of change in the holdings of leading central banks occurred just weeks before Bitcoin's first surge to new all-time highs at $60K in March 2021. Whether it was the direct impact of central banks or the market's perception of that impact, this was an obvious driving force for everyone markets in the last 18 months.
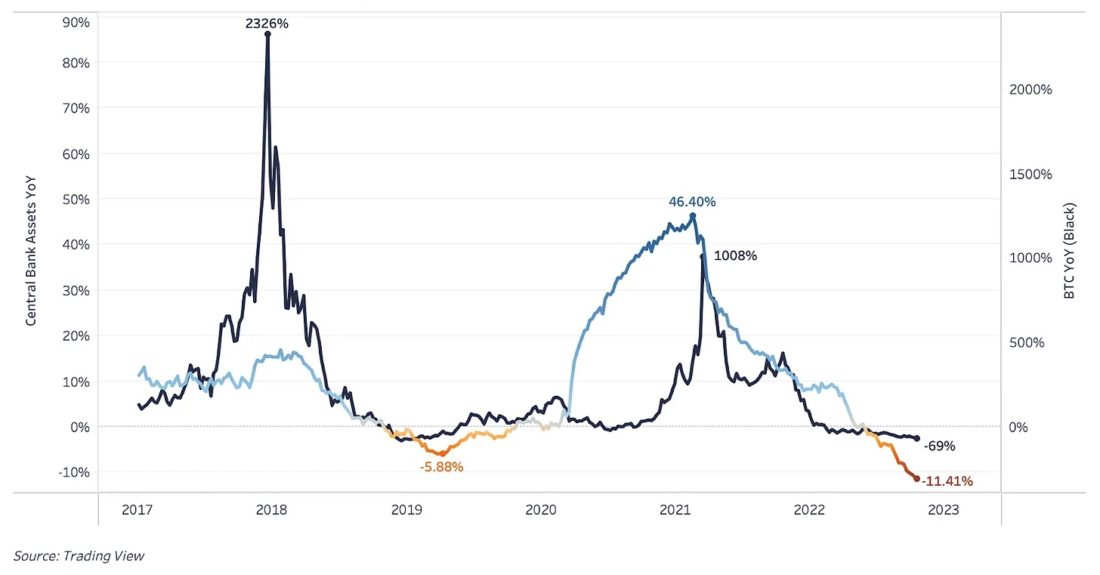
Combined Balance Sheets of Major Central Banks and BTC - YoY Growth (US, China, Japan, EU)
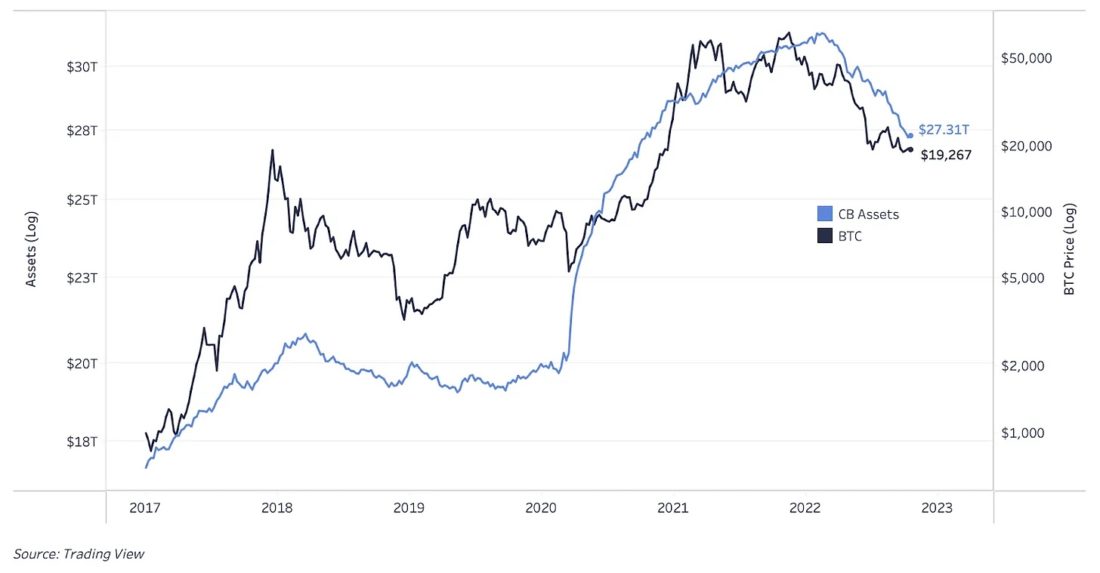
Combined balances of the largest central banks and BTC - in USD (USA, China, Japan, EU)

Combined Balance Sheets of Major Central Banks and BTC - YoY Growth (US, China, Japan, EU)
One of the macroeconomic experts onglobal liquidity - CrossBorder Capital, founded by Michael Howell. They take the definition of liquidity far beyond central bank balance sheets, showing deep, complex data and flow relationships that show just how heavily market valuations depend on global liquidity. The vacuum sucking liquidity out of the system is devastating to global wealth across all financial assets and housing markets, not just bitcoin. And that is not all.
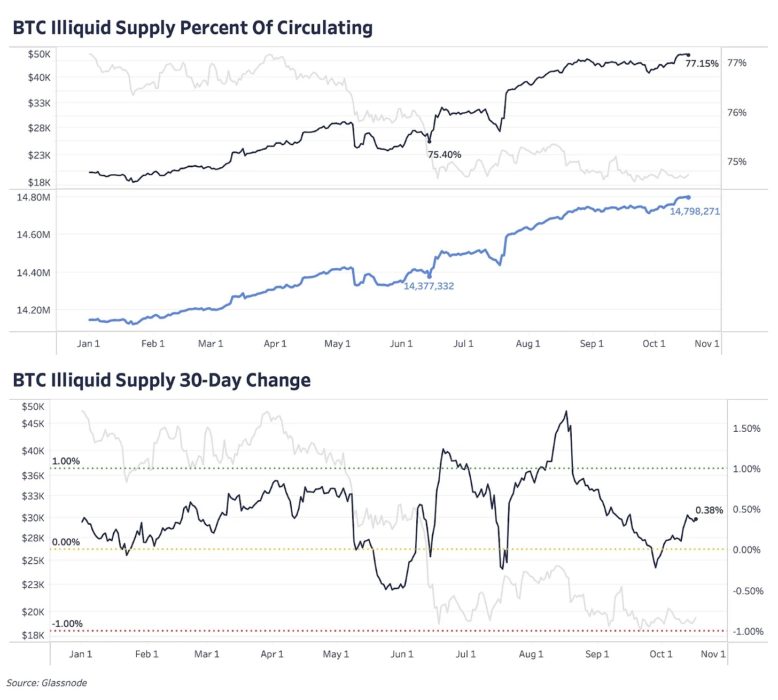
With capitalization constituting only a small partFrom the volume of global markets, bitcoin fell under the liquidity rink along with all other markets in the world. If we think that bitcoin acts like a liquidity sponge (more so than other assets), soaking up all the excess money supply and liquidity in the system during the anti-crisis expansion, then a significant reduction in liquidity will act in the opposite way. Combined with bitcoin's inelastic, illiquid supply profile of 77.15% with a huge number of principle hodlers, the negative impact on the price is much stronger than on other assets.
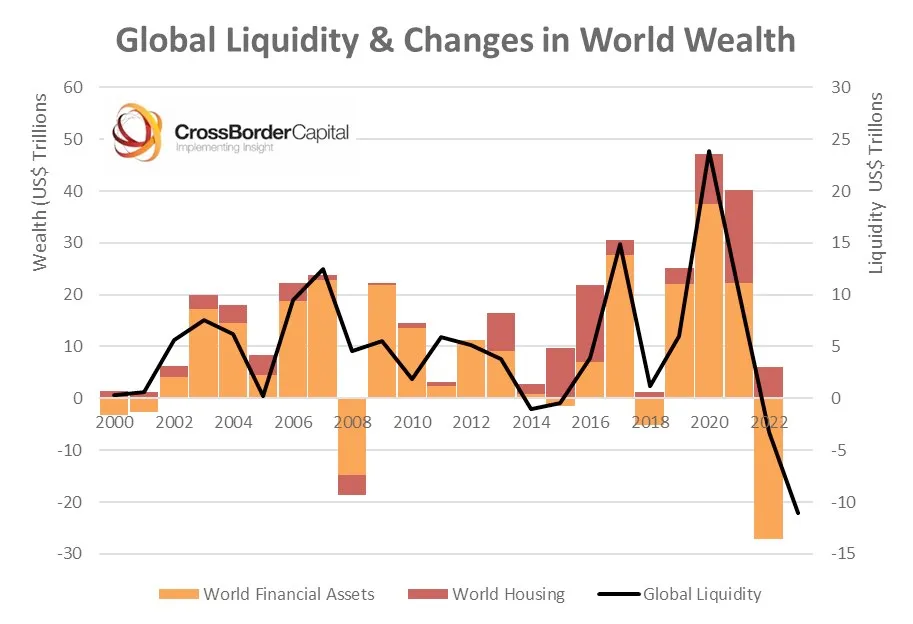
Global liquidity and changes in world welfare. :CrossBorder Capital
One of the potential liquidity factors formarket is the amount of money in the system, measured below by the global aggregate M2 in dollar terms. The M2 money supply includes cash, checkable deposits, savings deposits, and other liquid forms of currency. Both cyclical expansions in global M2 supply occurred during periods of expanding global central bank balance sheets and «bullish» Bitcoin cycles.
This graph is the key reasontreat bitcoin as a hedge against monetary inflation (or a liquidity hedge), not as a hedge against CPI (price) inflation. The depreciation of the money supply with the increase in the number of units in the system has led to the relative growth of many asset classes. Nevertheless, bitcoin, in our opinion, is the most optimal and one of the most effective assets in countering the future trend of constant depreciation of the money supply against the backdrop of expanding money supply and central bank balance sheets.
The chart below shows the significantthe reduction in supply that we have seen in the last five years. The colored line is the difference between the M2 annual growth rate and the five-year average annual growth rate.
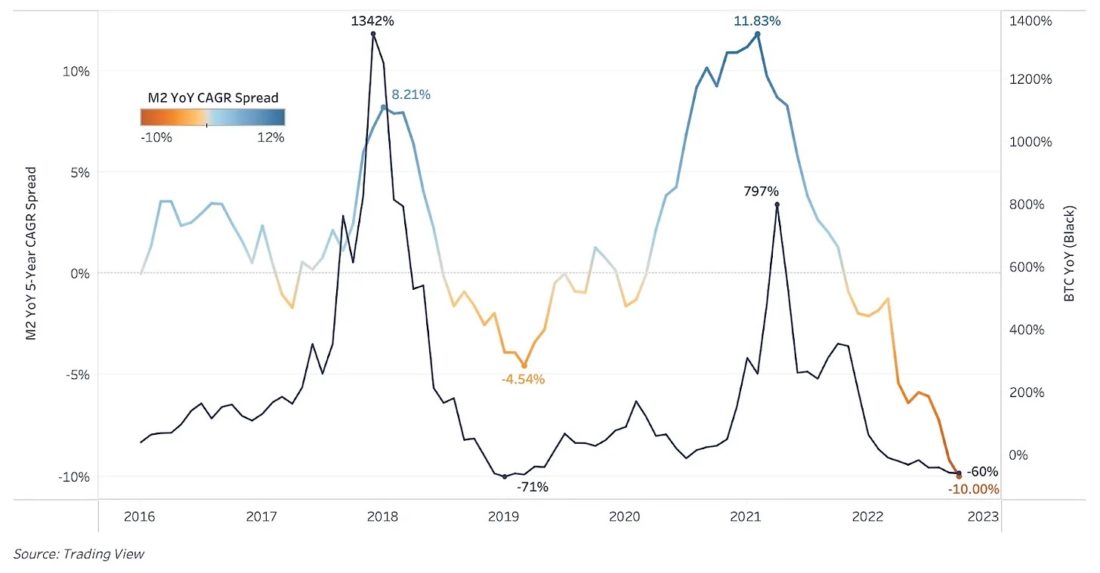
Global monetary aggregate M2 (USA, EU, Japan, China) and average annual growth of BTC
If we expand the definition of liquidity somewhatTo make it more practical, it may be useful to look at a metric called “net liquidity,” which tracks the Federal Reserve's balance sheet minus the combination of the U.S. Treasury general account and the reverse repurchase facility. Leaving aside the Fed's balance sheet, both of these variables have changed significantly since 2020 and have had a much greater impact on system liquidity (the amount of money available to circulate in the economy) than before.
I won't go into all the details, but I wanthighlight the enormous importance of liquidity on rising asset prices in this cycle. This has been the main driver of asset growth for decades. The chart below shows how correlated net liquidity and the S&P500 have been over the past year, and as we know, Bitcoin has followed the stock market in almost every move. Unless there are major changes to the operation of the Treasury general account and reverse repurchase facility in the coming months, further contraction of the Fed's balance sheets will only further reduce liquidity in the markets for the rest of the year.
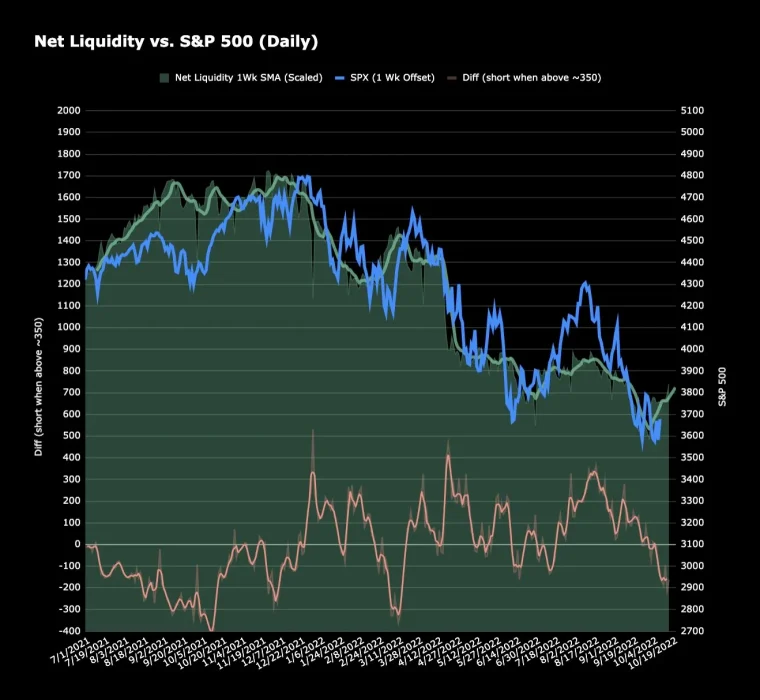
Net liquidity and S&P500 rate (daily chart). :Max Anderson
With all this, how long can it last?a significant reduction in the Fed's balance sheet is unclear. So far, we've only seen about a 2% reduction from the peak of $8.96 trillion. Ultimately, we see that expanding balance sheets is the only option to keep the entire monetary system afloat, but until now the market has underestimated how far the Fed is willing to go.
Lack of viable optionsmonetary policy and the inevitability of this eternal expansion of balance sheets is one of the strongest arguments for the long-term success of bitcoin. What else can central banks and fiscal policymakers do in the future during recessions and crises? However, in the short term, we are in uncharted territory and would prefer to first let the liquidity momentum and the trend reach its logical conclusion, or at least a major turning point.
BitNews disclaim responsibility for anyinvestment recommendations that may be contained in this article. All the opinions expressed express exclusively the personal opinions of the author and the respondents. Any actions related to investments and trading on crypto markets involve the risk of losing the invested funds. Based on the data provided, you make investment decisions in a balanced, responsible manner and at your own risk.
Read this:
 Bank of Denmark Governor Calls Bitcoin a "Speculative Fad"
 Sweden tests central bank digital currency
 WEF releases central bank digital currency adaptation guide
 Central Bank Digital Currency: The Basics
 The ECB is actively studying the central bank's digital currencies (CBDC)
 Growth of the dollar index and exchange balances