As I write this, Bitcoin is once again hitting the $50K level. Of course, this is not the first time this has happened.For the first time, the BTC rate crossed the $50 thousand mark in February, then in March, then in April. We know what happened next. So won't the same thing happen again now? Or is it different this time?
I must confess that in February I did not payspecial attention to on-chain metrics. In hindsight, it seems that it was a mistake, albeit not that big, if you just accumulate satoshi on the sly and play for a long time.
However, it must be admitted that on-chain data does carry valuable information. For example, some pretty clear signs that Bitcoin's upward momentum is slowing emerged back in February.
At a high level we can refer to what I callindicator of participationin the total accumulation.
The participation indicator takes into account groups of addresses, fromsmall players (with a balance of less than 1 BTC) to “whales” (with a balance of 1,000 to 10,000 BTC), and determines whether they have accumulated, on average, “coins” over the past 30 days. Low participation rates (blue in the chart below) indicate that, on average, over the past 30 days, accumulation has occurred mainly in groups with less capital. In contrast, high values (red in the diagram below) indicate that accumulation occurs across all groups of addresses, from small fish to whales.
Although the level of accumulation of bitcoins by network addressesis not immediately reflected in the price, it is easy to guess that from the point of view of both supply constraints and general market sentiment, it is better when the majority of market participants accumulate BTC.
Now, with that in mind, take a look at evolutionparticipation rateyear to date.
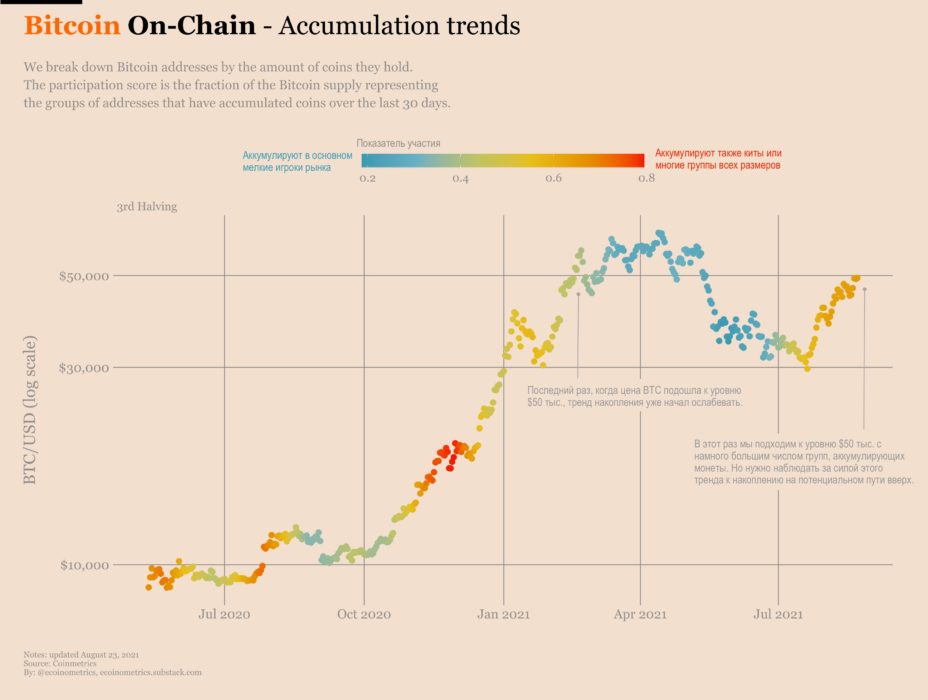
Bitcoin: Accumulation Trends
When did the Bitcoin rate cross the level for the first time?$50 thousand, the metric has already begun to show signs of a decline in demand levels. And subsequent crossings of this mark occurred against the background of an ever smaller volume of accumulation.
Now that we have seen this, it is not surprising that, against the backdrop of a weakening trend, any FUD or negative event is likely to drive the price down.
Again, I am not suggesting that this blue zone itself predicts a market decline. But it signals some of his weakness.
This time we are approaching $50 thousand.with the participation rate on the rise and already in the orange zone! So yes, this time is different. The market is heading towards its all-time highs with some positive on-chain momentum.
However, you can dig deeper.
The participation rate gives an average and very general idea. But what if we try to parse it into groups of addresses and get rid of the averaging? Take a look for yourself:

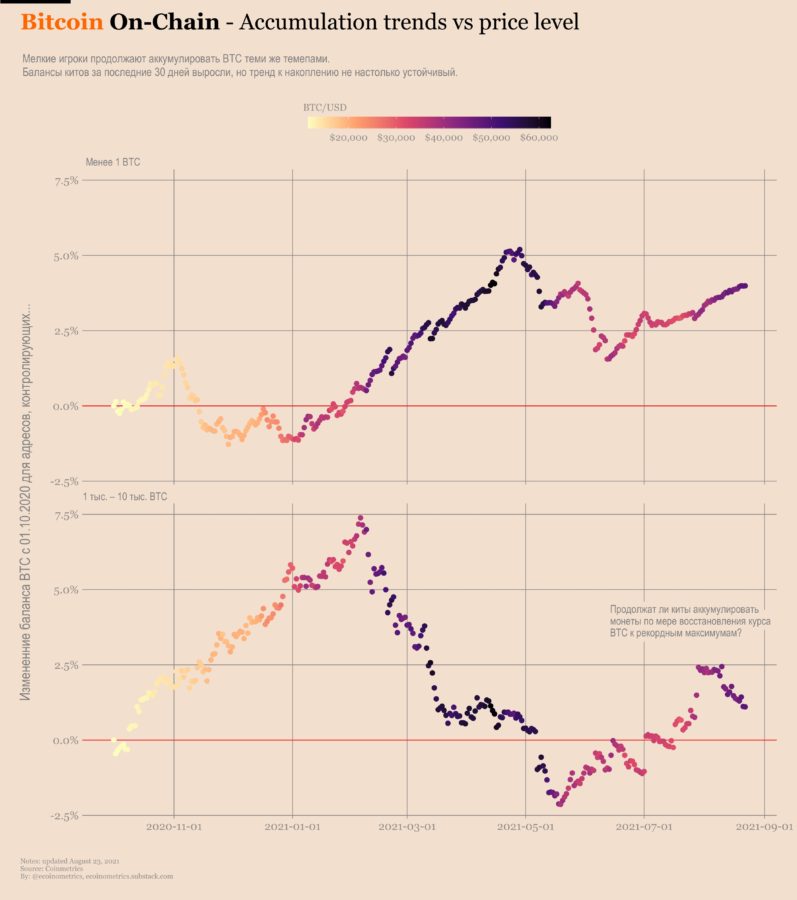
Whales, small players and the BTC / USD rate
In the last couple of weeks, we are starting to notice some contrast:
- addresses with a balance of less than 10 BTC consistently accumulate satoshi,
- the behavior of addresses with a balance from 10 to 1 thousand BTC has become more neutral,
- on the part of the whales, accumulation slowed down.
In other words, we are not in the same situationwhen accumulation occurs only among small players, while everyone else is unloading their reserves. And this is different from what happened in the bitcoin market at the beginning of the year. The market is clearly in a healthier state this time around.
However, the big question is whetherWill this state of affairs continue? After all, you wouldn’t want the party to stop at $50K! The real challenge now is for the market to gain enough momentum to move into the six-figure price range in the coming months.
For this to be possible, apparently, it should notthere may be a significant divergence in the accumulation tendency between small fish and whales. So let's keep an eye on this parameter as the price of BTC tends to its all-time highs.
Accumulation trends and BTC rate
Bitcoin exposure
It was reported last week that BlackRock, the giant asset allocator, has a significant stake in two stock-market-traded mining companies: Marathon and Riot.
Just in case:this does not mean that BlackRock is buying shares of bitcoin miners for itself. What they do is include stocks in the range of financial products they offer to their clients (mutual funds, ETFs, and others).
However, many investors are probably notguess they already have some indirect exposure to bitcoin. The reason is simple: more and more public companies participating in large indices are investing in bitcoin.
The easiest way to see this is to look atBitcoin treasury index. This fictional index, which I invented myself, consists of companies that are listed on major US exchanges and have exposure to BTC through their Treasury.
The current index includes MicroStrategy,Tesla, Coinbase, and mining companies like Marathon, Hut8, and Riot. All of them are not only part of my Bitcoin Treasury Index, but they are also part of the NASDAQ100. This means that anyone who bets on the tech sector through this index indirectly has some exposure on bitcoin as well.
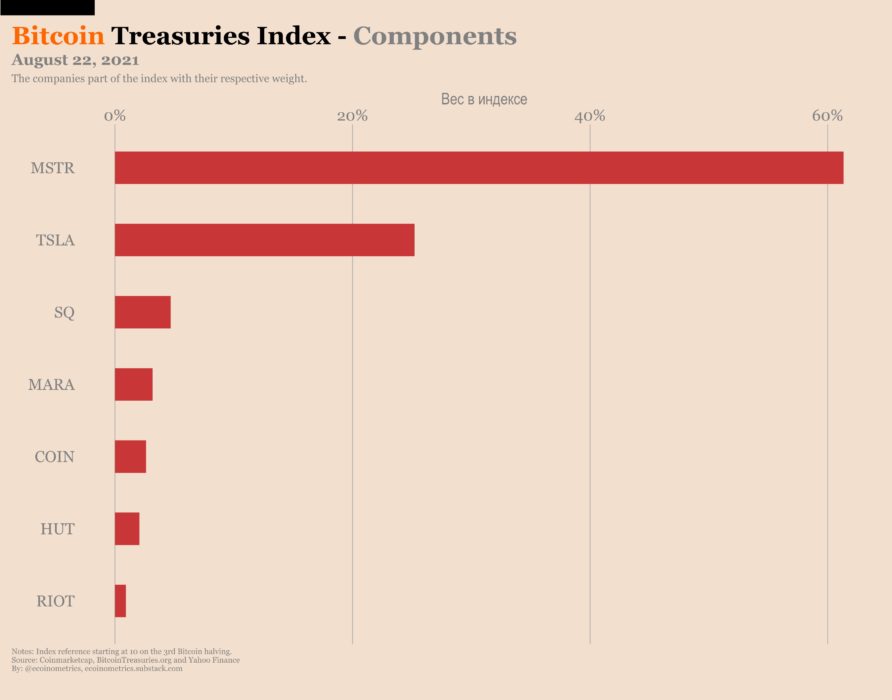
Bitcoin Treasury Index
Of course, there is a big difference between the NASDAQ and the Bitcoin Treasury Index: the latter is essentially a leveraged bitcoin bet!
Check it out:
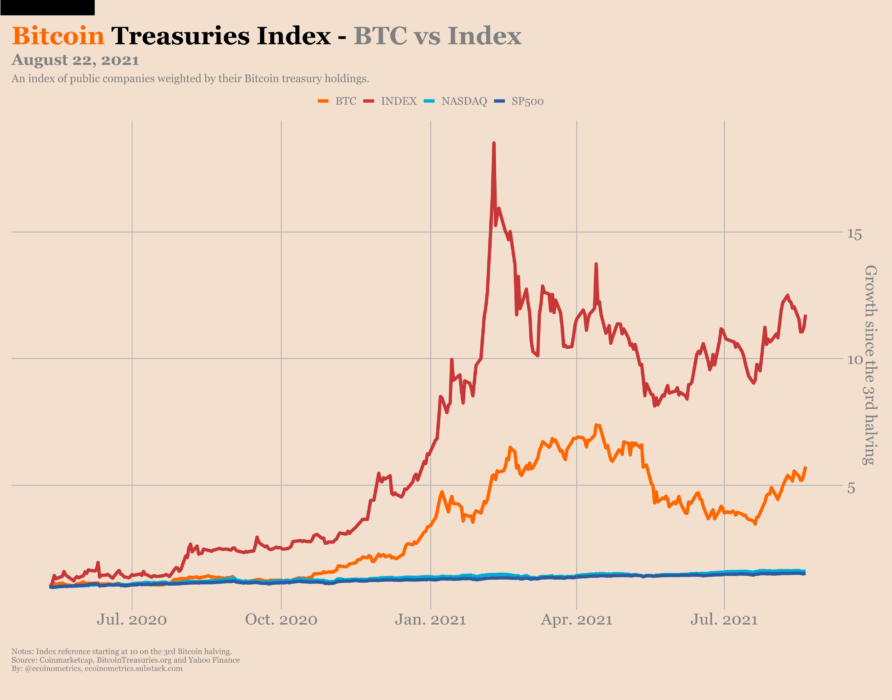
BTC rate and value of the Bitcoin Treasury Index (growth after the third halving of Bitcoin)
The NASDAQ chart from this perspective can easily be mistaken for the horizontal axis…
So for those who, for whatever reason, are deprived of direct access to BTC or GBTC, betting on a basket of securities correlated with the bitcoin rate may be the second best alternative.
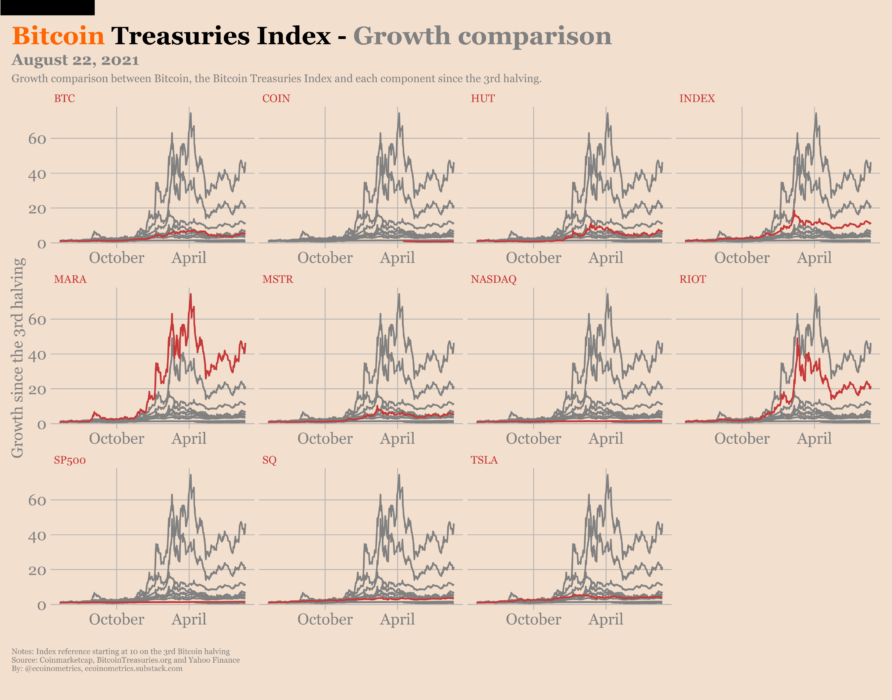
Comparison of post-third halving growth for Bitcoin, the Bitcoin Treasury Index, and each of its components
The article does not contain investment recommendations,all the opinions expressed express exclusively the personal opinions of the author and the respondents. Any activity related to investing and trading in the markets carries risks. Make your own decisions responsibly and independently.
</p>
Read this:
 This May was the worst month for the price of BTC in the last 10 years
 All about cryptocurrency for this day 01/22/2021
 Another most accurate forecast for VA, this time stellar
 Scott Melker: "BTC depreciation may continue"
 Bobby Lee: “By the end of 2021, the Bitcoin exchange rate will exceed $ 39,900”
Chamat Palihapitiya: “Bitcoin exchange rate will soar in the event of a major crisis”
Bobby Lee: “By the end of 2021, the Bitcoin exchange rate will exceed $ 39,900”
Chamat Palihapitiya: “Bitcoin exchange rate will soar in the event of a major crisis”