The bulls continued to update weekly highs. Can the price gain a foothold in the area of new highs?
BTC / USD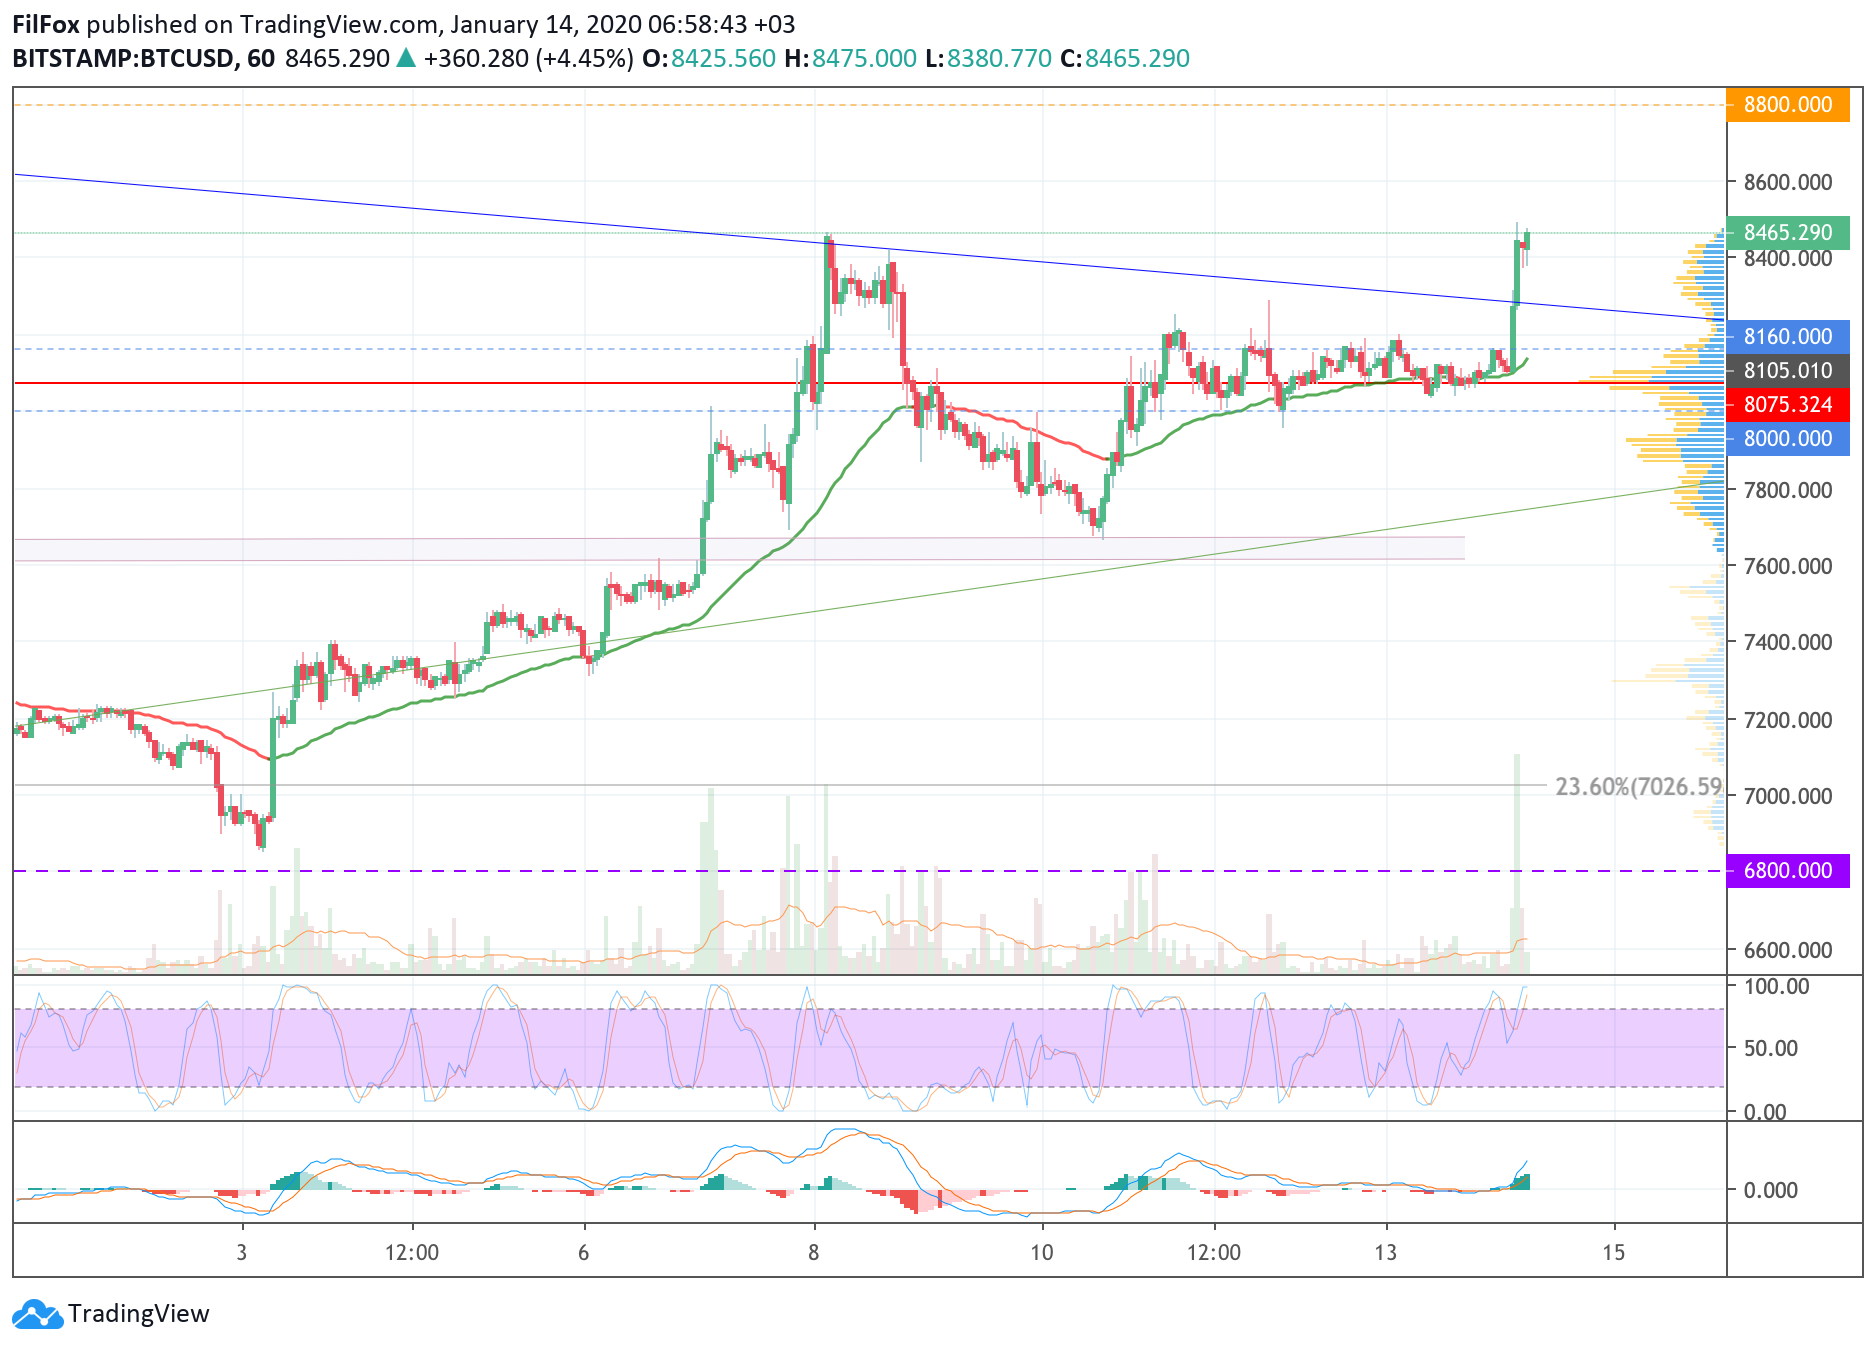
Yesterday, the hourly EMA55 kept the BTC price from fallingto the lower border of the side range (8000.00 USD). However, by the end of the day, buyers did not have time to increase volumes in order to break through the upper limit (8160.00 USD) of this sideways trend. Just tonight, a powerful bullish impulse tested the blue trend line in the area of 8200.00 USD.
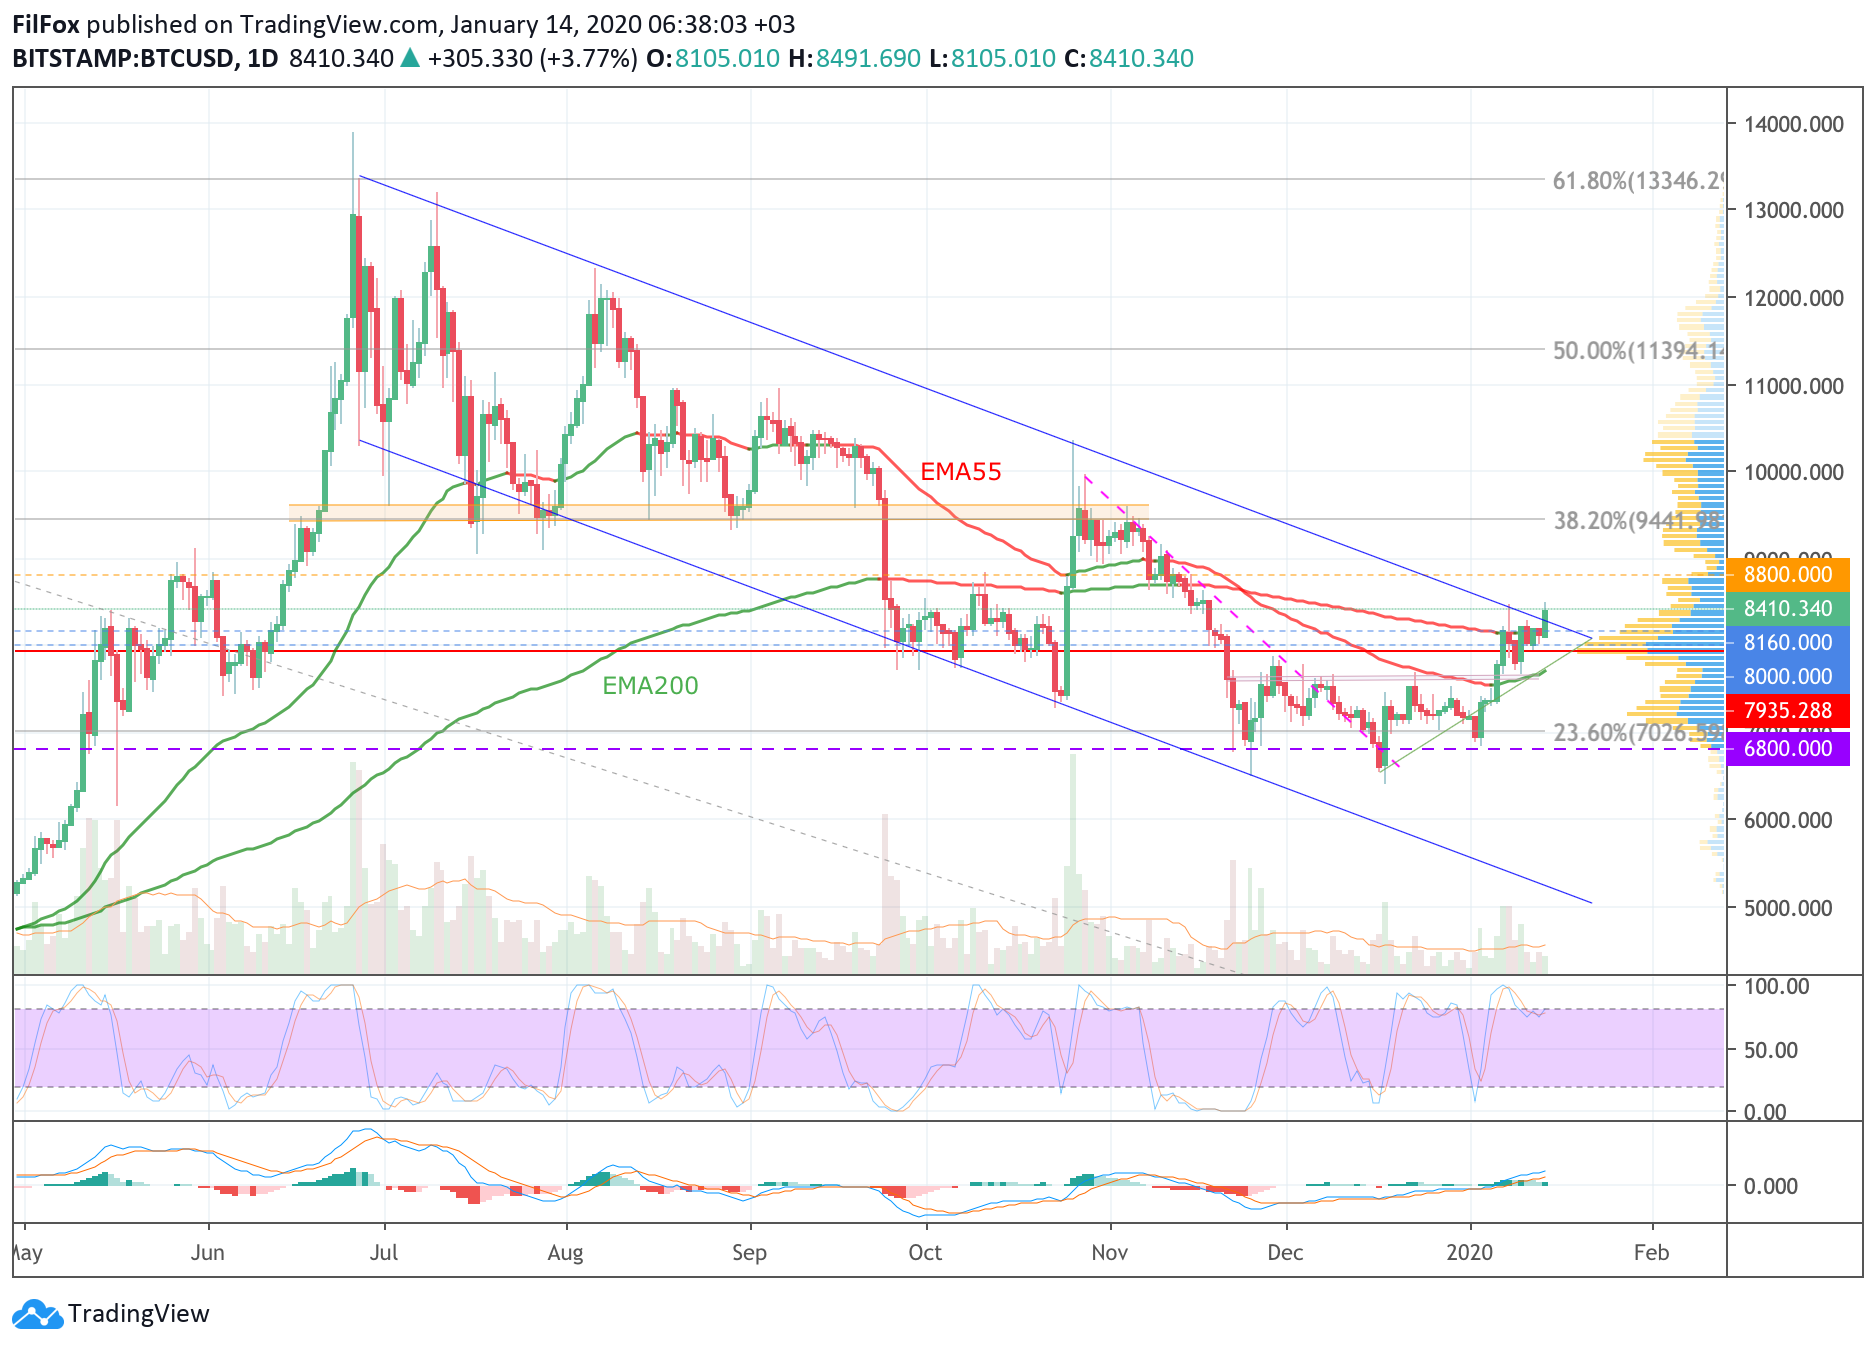
On the daily time frame you can see how in the morning there is a repeatthe impulse broke through the upper border of the descending blue channel. In this channel, the price of Bitcoin decreased for six months, after the annual high of 2019, which was set on June 26, around 14,000.00 USD.
Today we will have a re-test of orangeresistance 8800.00 USD. If, after a rollback from the maximum zone, the upper boundary of the blue channel provides support for the pair, then we will witness the price exiting the six-month downtrend.
If the price returns to the channel, then it is too early to talk about a change in trend.
ETH / USD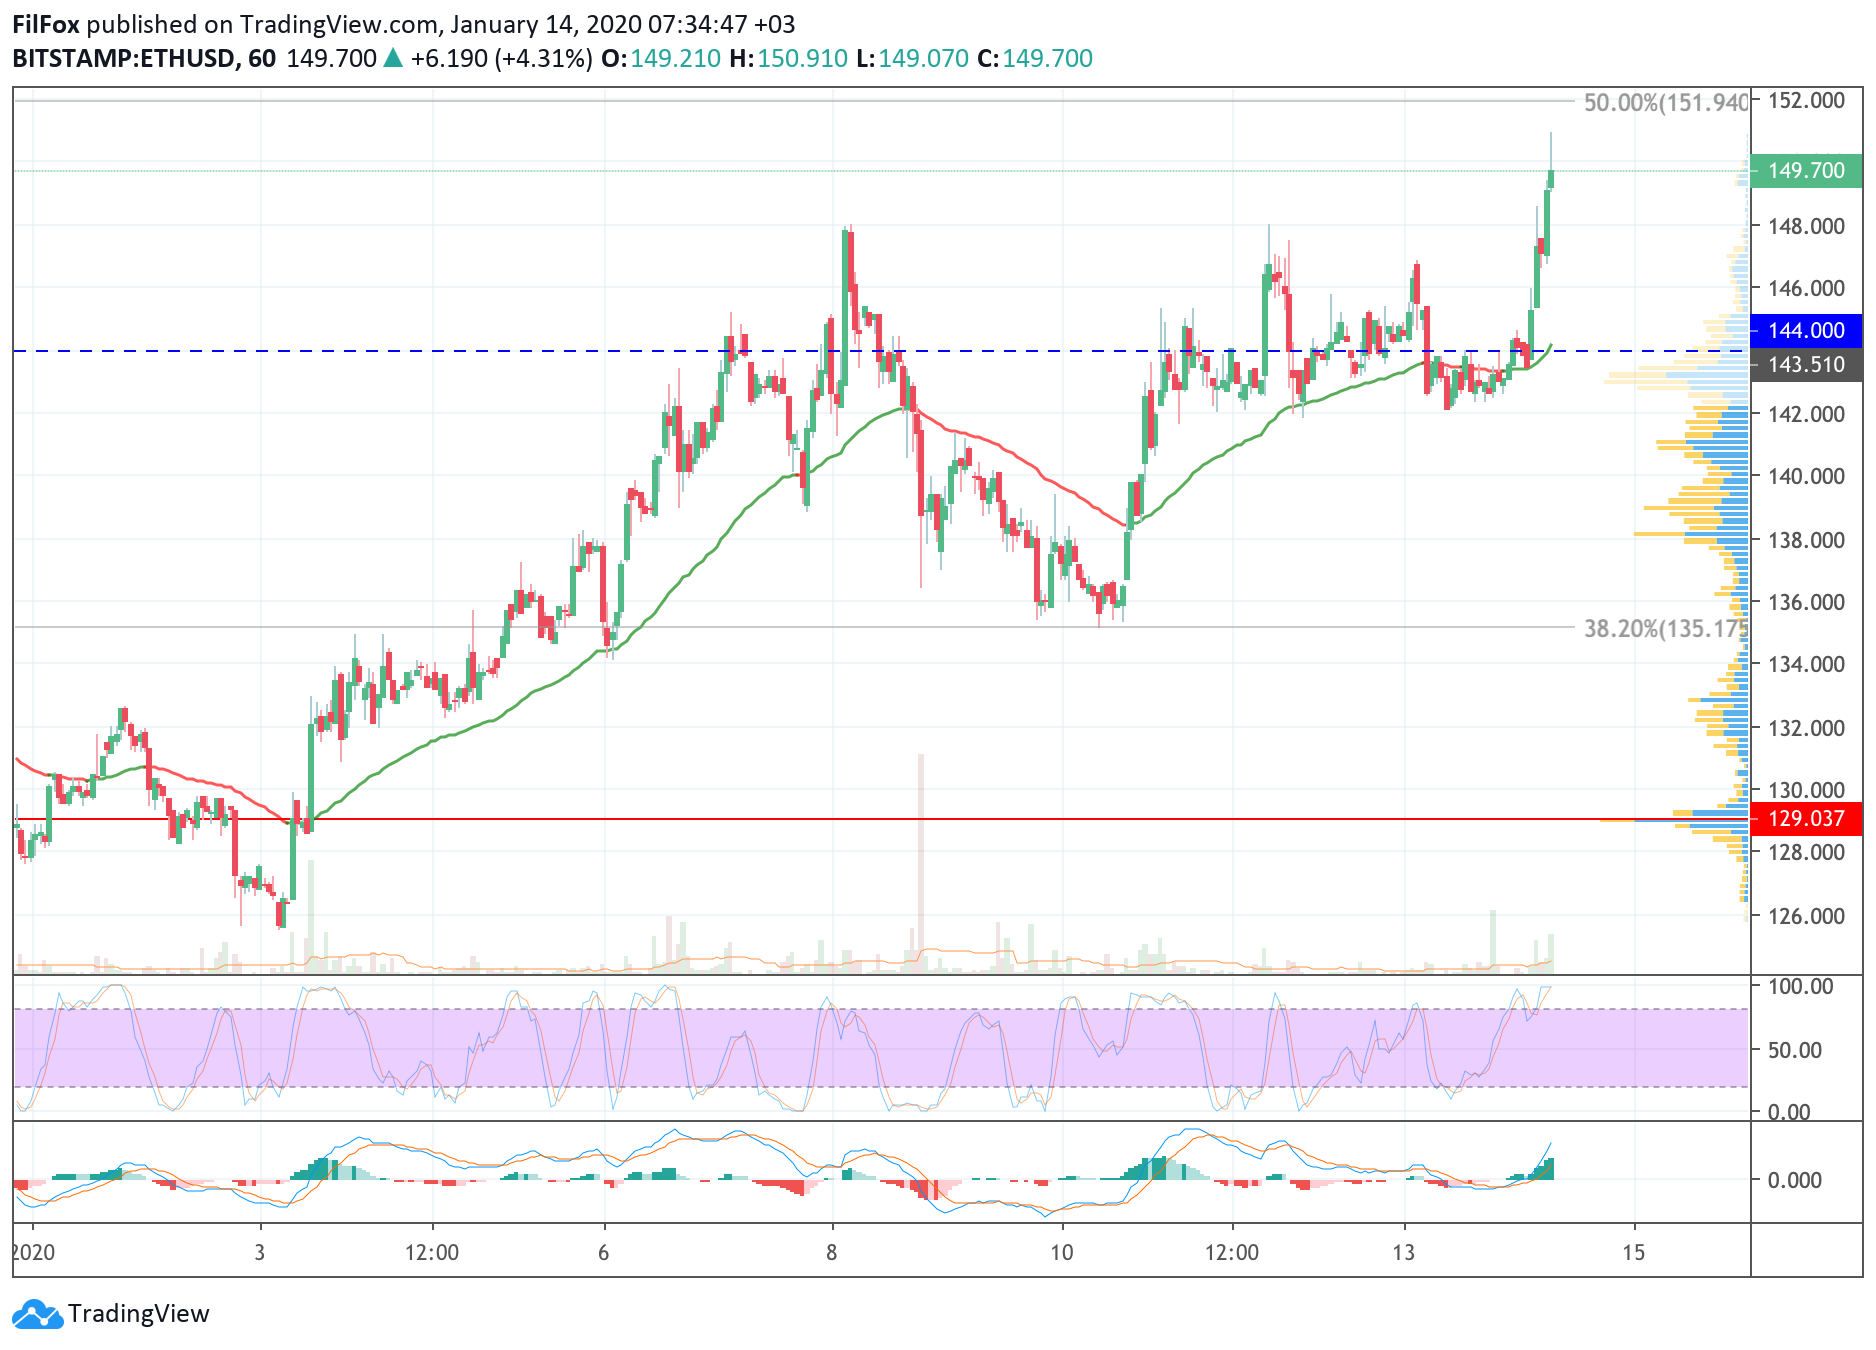
Yesterday the price of Ethereum remained around the hourly levelmoving average EMA55. At the end of the day, there was a weak attempt by buyers to overcome the resistance of 144.00 USD, but it ended with a rollback to the average price level.
Tonight, a strong bullish impulse knocked the price out of the sideways pattern and updated last week’s high near the 150.00 USD mark. During the day, you can count on a breakthrough of the 50% fibo level (151.94 USD),but will buyers be able to gain a foothold over it?
If the 50% Fibonacci retracement level reverses the pair, then the price of ETH will fall below the key support of 144.00 USD and a bullish break can be considered false.
XRP / USD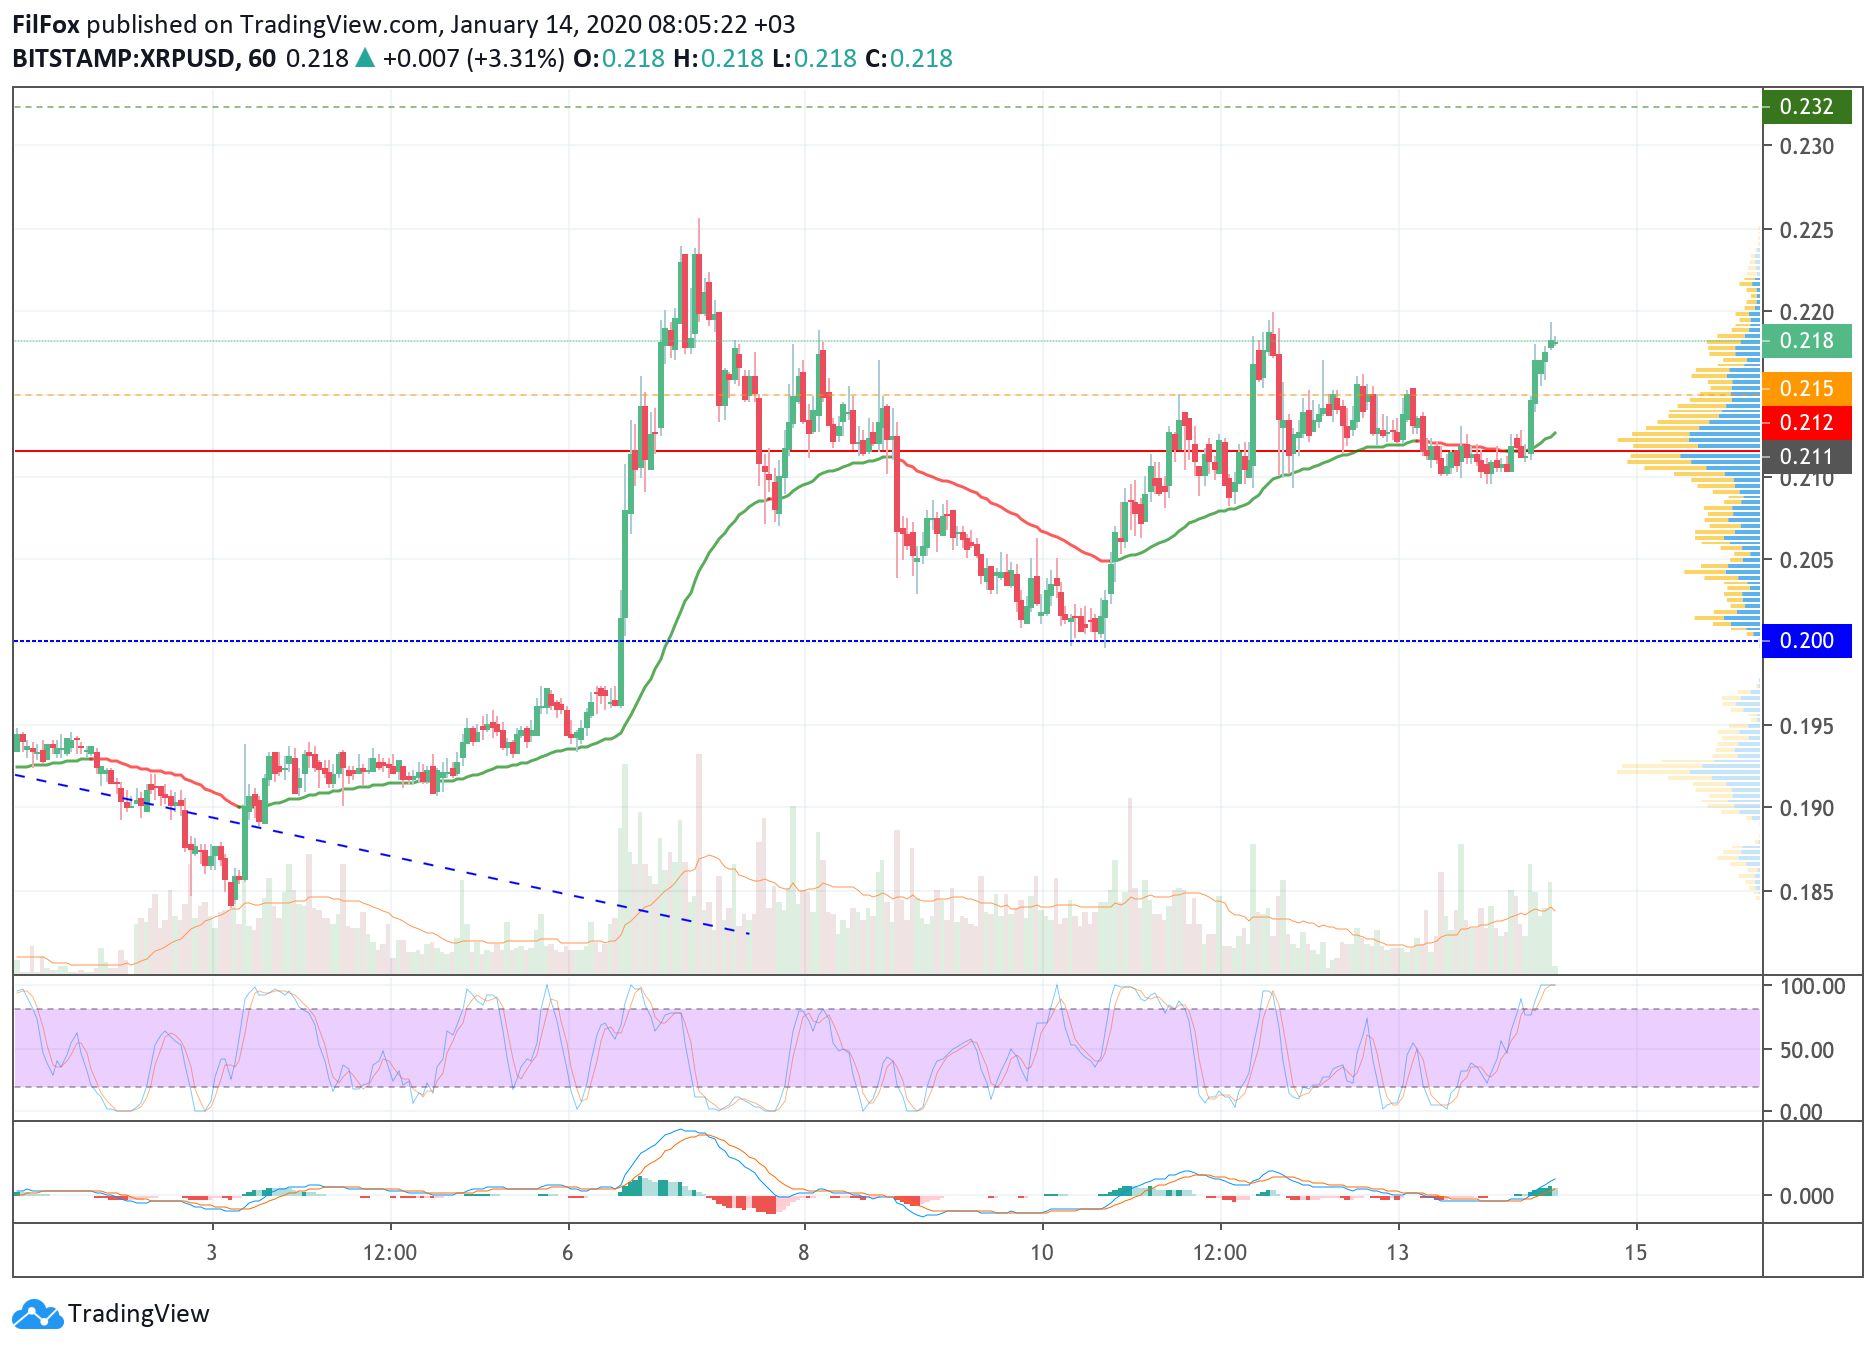
Yesterday, buyers were able to gain a foothold above the average price level and remained there until the end of the day.
Tonight the bullish impulse broke through resistance0.215 USD and set a maximum around 0.220 USD. The price of Ripple has not yet updated its annual maximum, which it had already recorded on January 7 at 0.226 USD. But today there is a high probability of continued growth.
If the bullish impulse repeats, then the new annualthe maximum is possible in the resistance area of 0.232 USD. If this level turns the pair downward, then you need to monitor the depth of the rollback. A decline below the POC line (0.212 USD) will cancel the local uptrend.
* All price values are based on data from the BitStamp exchange


