
Will the weekly highs continue to refresh or will the pair return to recent support levels?
BTC / USD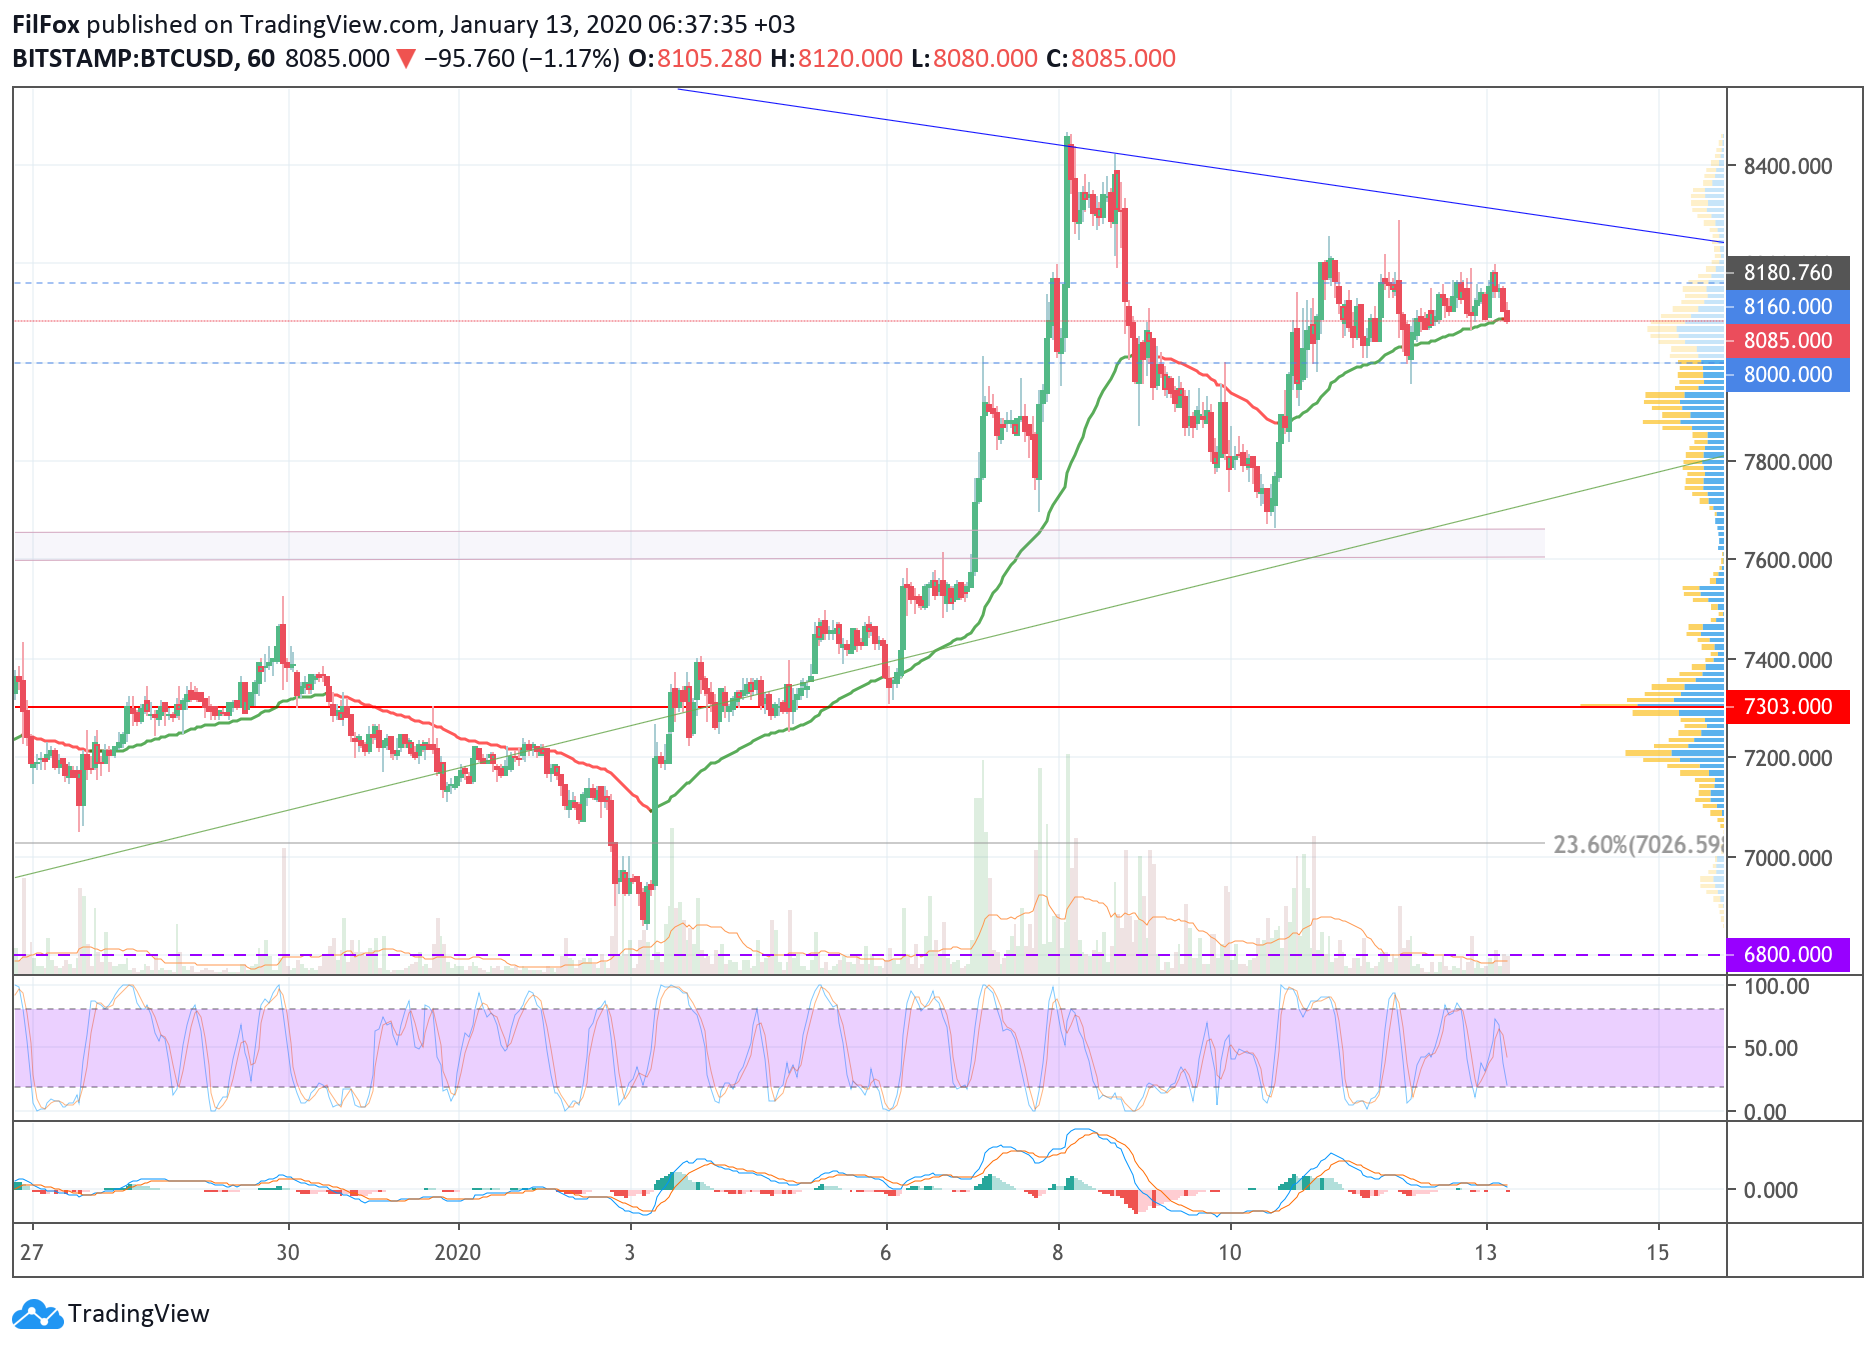
The pair was in a sideways range over the weekend$8000 – $8160. It should be noted that the hourly chart shows how the EMA55 moving average acted as support for the BTC price within the range.
If she keeps the couple from re-testing this morningthe lower limit of the range (8000.00 USD), then at the beginning of this week it is possible to exit this side corridor and re-test the blue trend line in the area of 8200.00 USD.
Current consolidation in dotted sidewaysrange occurs when market activity is low. If the bears become active near the psychological level of 8000.00 USD, then a rollback is possible to the green trend line, to the area around 7770.00 USD.
ETH / USD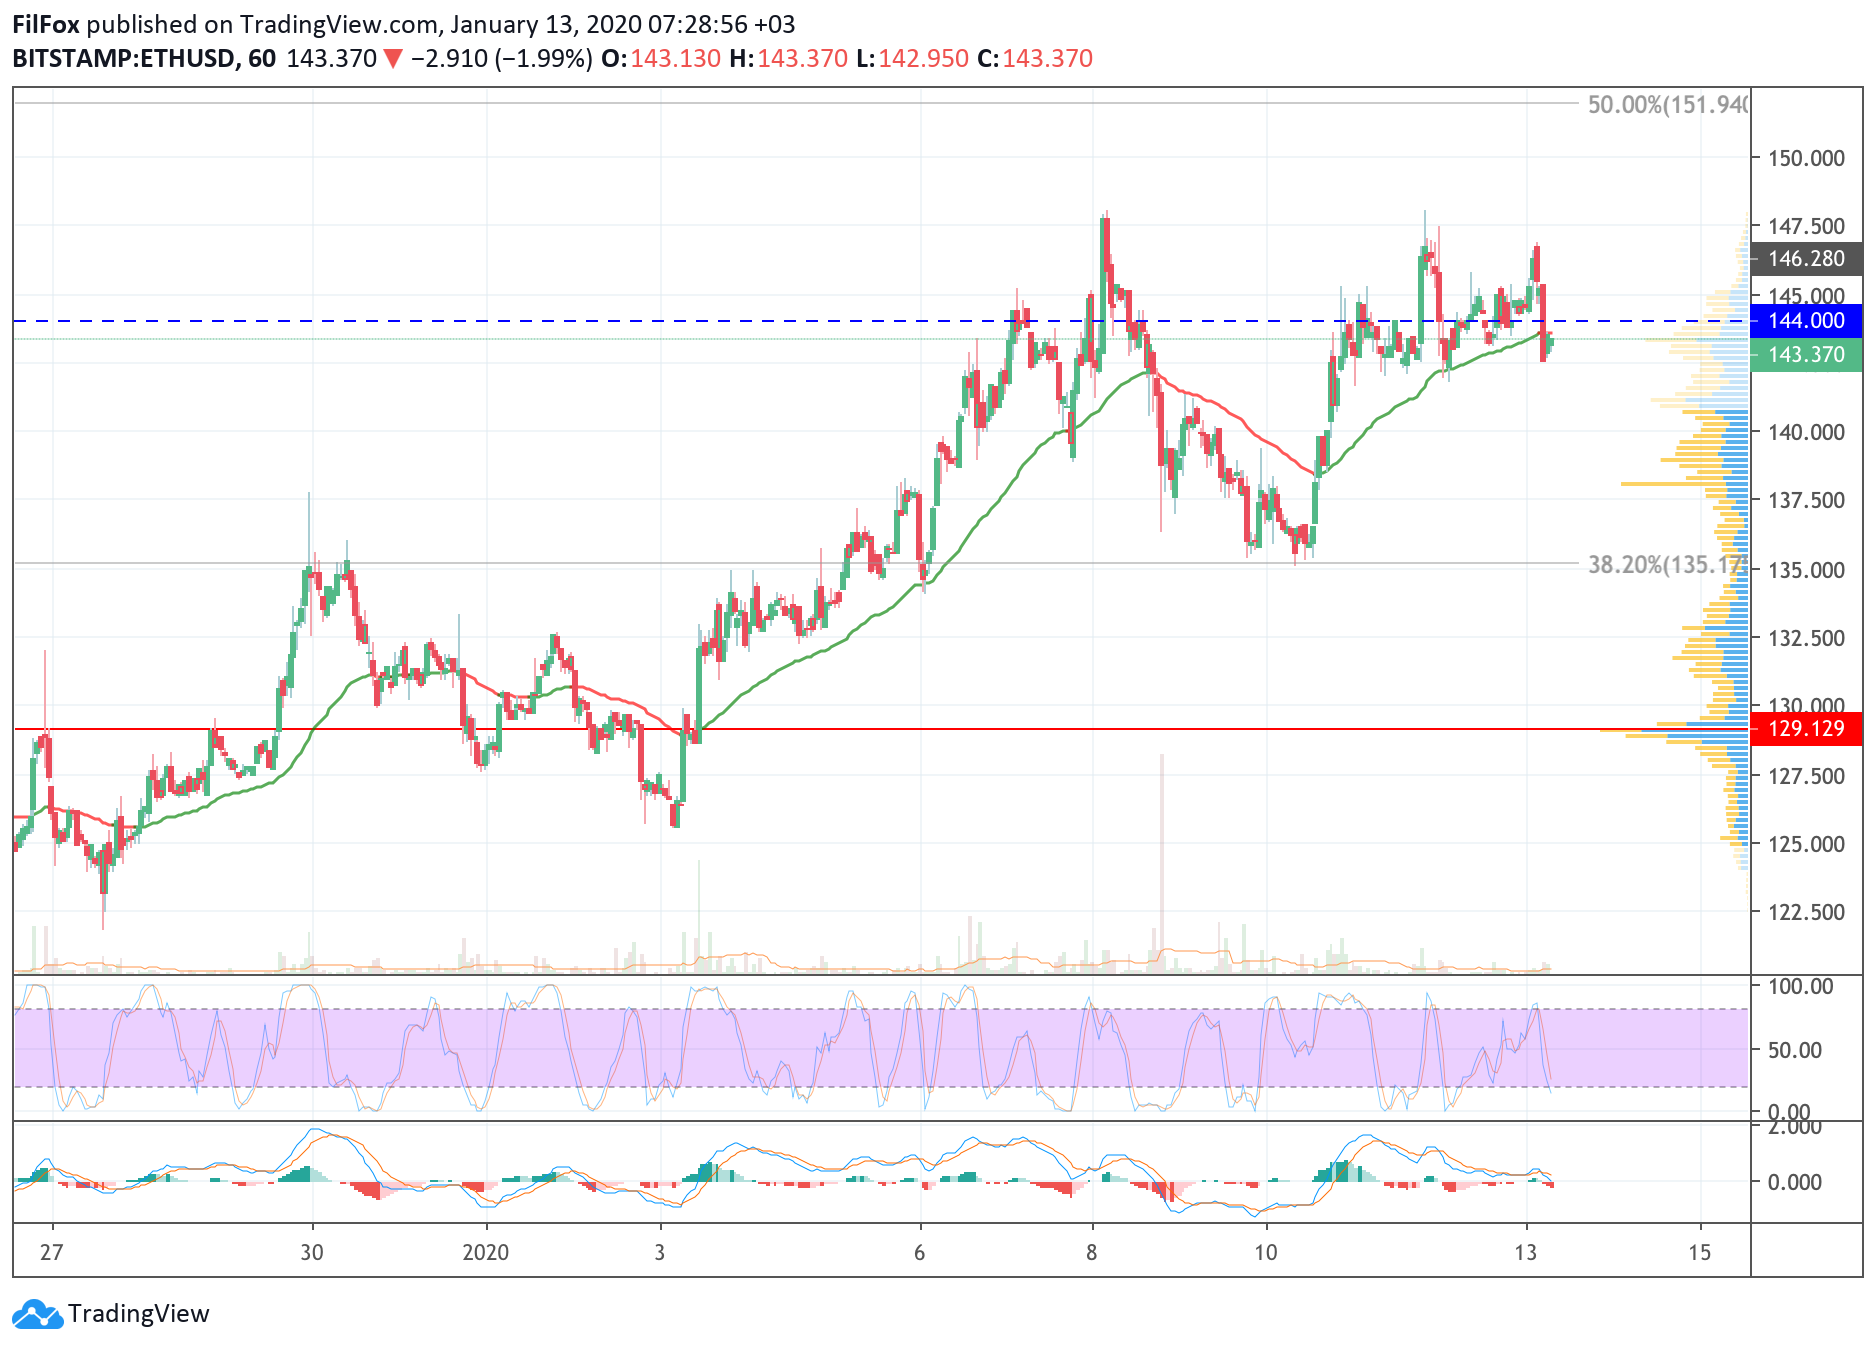
Ethereum trading took place over the weekend onlow volumes. The hourly moving average kept the pair in a sideways range and buyers managed to test the weekly high zone several times. In the morning, the pair rolled back below the hourly EMA55.Will the bulls be able to break out of the sideways trend at the beginning of the week and test the 50% Fibonacci level?
A short-term surge in bullish activity is, of course, possible.
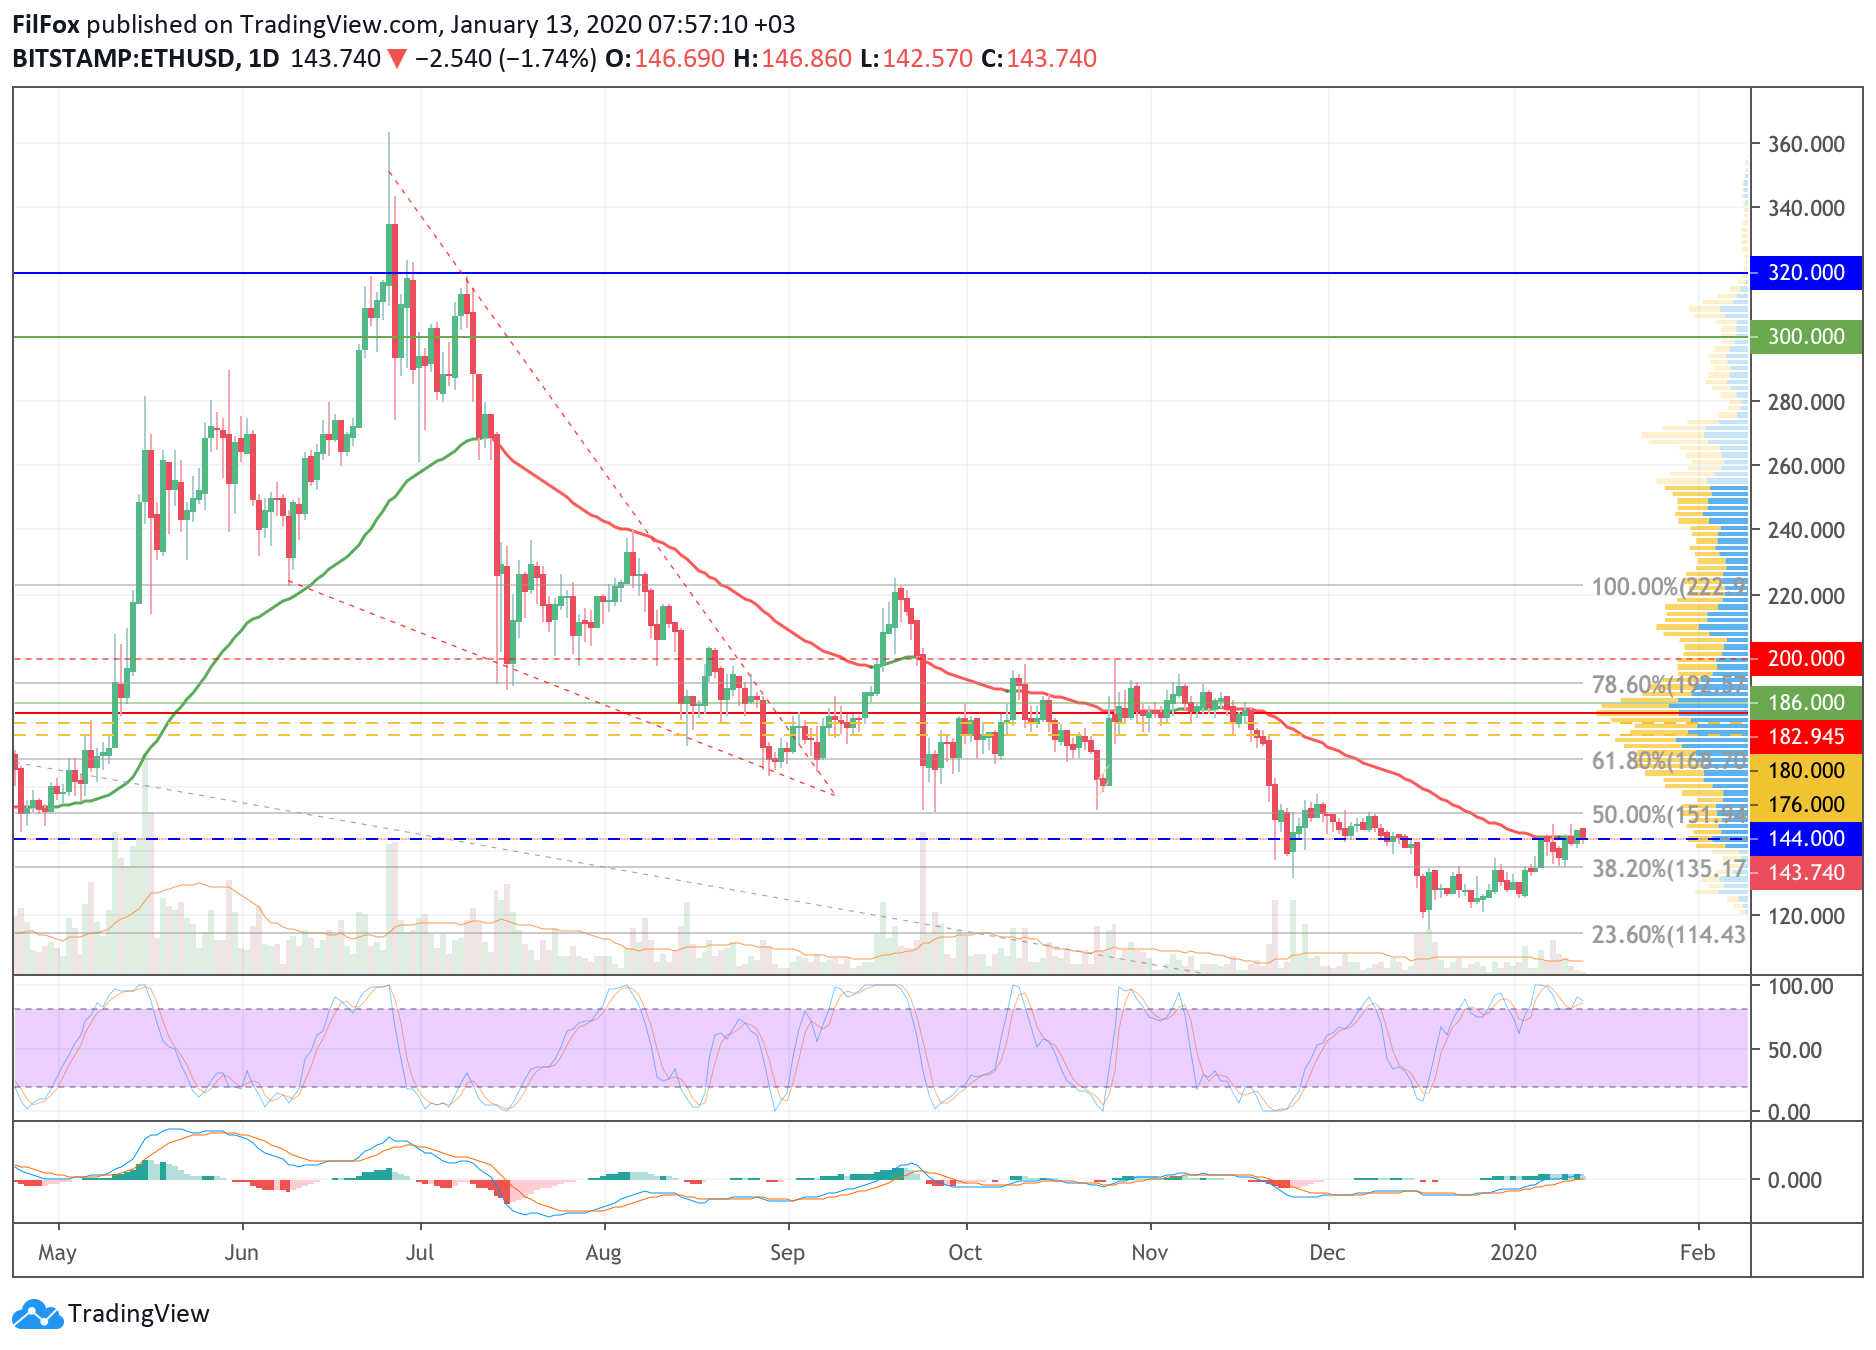
However, judging by the Stoch RSI indicator lines ondaily time frame, which have been in the overbought zone for a long time, we can assume that the week will begin with a rollback to the area of 140.00 USD. And with strong bearish pressure, the price can test the 38.2% fib level (135.17 USD).
XRP / USD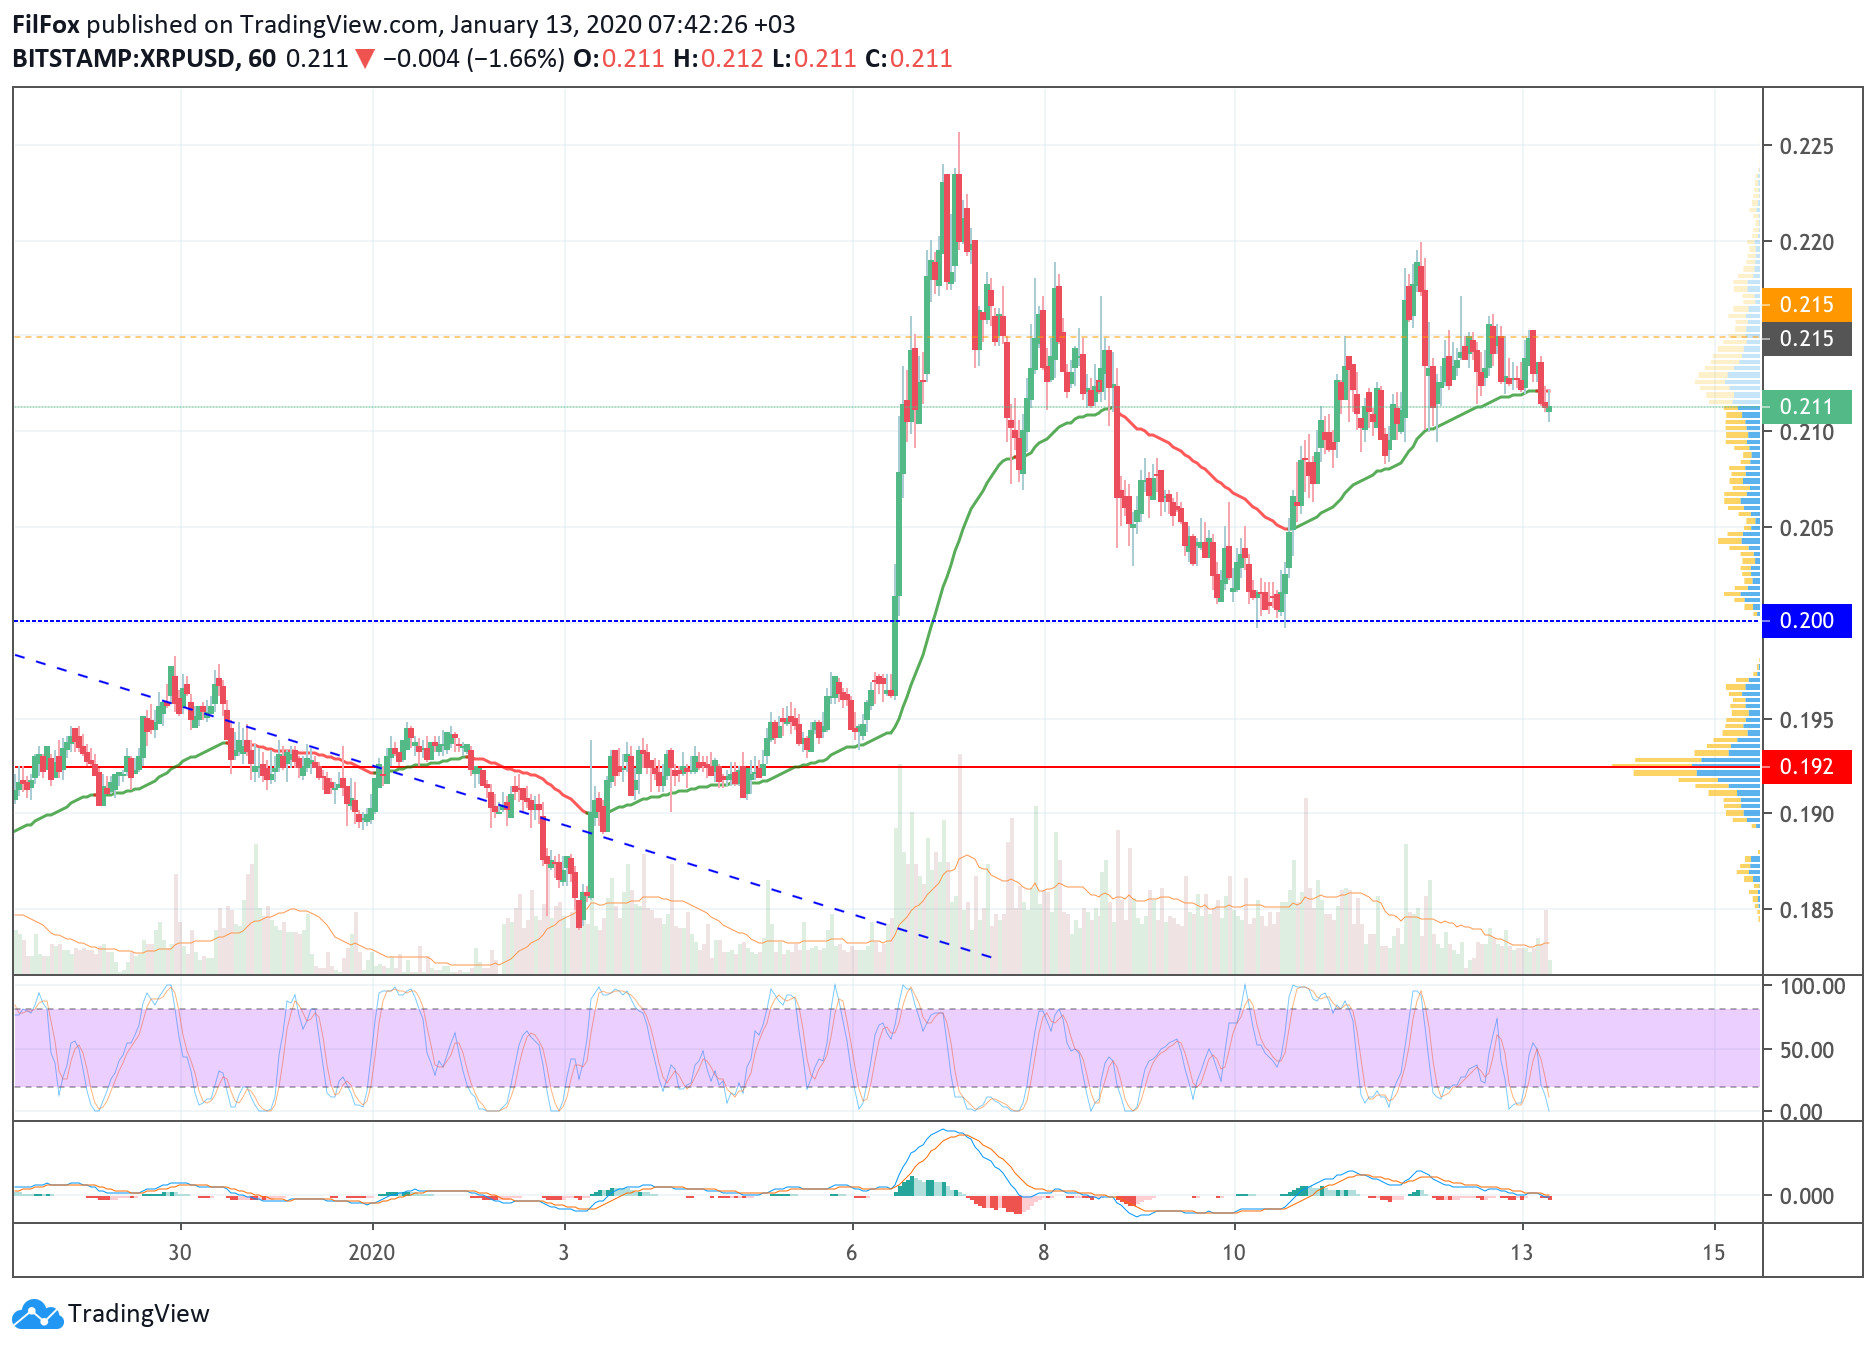
Last weekend, the price of Ripple was atsideways range between support from hourly EMA55 and resistance 0.215 USD. This morning, sales volumes exceeded the average level and the price rolled back slightly below the moving average EMA55.
If bearish pressure intensifies, then by the middle of the week the pair may return to the support of 0.200 USD, and at its end – to the POC line (0.192 USD).
* All price values are based on data from the BitStamp exchange


