Dollar-cost averaging (DCA) is one of the simplest ways to invest for the long term.time. But what if we change this simple strategy a bit during a bear market? What if you double down while the market is in free fall?
There are three ways to buy back a drawdown:
- Wait for the correction to get big enough and open the position in one go.
- Buy the same amount of coins for a dollar amount at a fixed time interval.
- Buy with a fixed interval, but in large quantities, as the depth of the correction grows.
Let's call the second option dollar cost averaging and the third option dollar cost adaptive averaging.
The first option is quite easy to analyze. You simply decide what is a good entry point and act accordingly. Nothing more to say.
Between the second and third options it is clear thatadaptive dollar cost averaging will give better returns. After all, since you are buying more than with regular DCA when the price drops, adaptive DCA ends up taking a position at a lower average price.
But how much better is adaptive DCA compared to DCA? How high is the return on DCA? And is there a catch in deploying an adaptive dollar cost averaging strategy?
Let's try to figure this out.
There is a parameter that is very important when it comes to DCA: purchase frequency. Personally, I like to do this weekly. Not too often for it to be burdensome.
Keep in mind that changing the frequency/dates you shop with will change the results. There shouldn't be any significant differences.
So, for this analysis, we will compare DCA with adaptive DCA, assuming a few points:
- we make a purchase for both DCA and adaptive DCA once a week, say every Monday;
- we use DCA only during drawdowns that exceed 10% (and occur on at least one Monday);
- we apply the adaptive DCA strategy by adding to the DCA the drawdown percentage for that day.
For example, if $100 is allocated for DCA every Monday and Bitcoin is currently 15% below its all-time high, then the purchase for adaptive DCA would be $115.
First things first, how good is the averagedollar value during drawdowns? By that I mean, what kind of return can you get from a DCA position when it's time for bitcoin to return to an all-time high?
The answer lies in the chart below.
The vertical axis shows all the drawdowns to which we have applied DCA, ranked by size. The horizontal axis shows the yield received on the DCA position when exiting the drawdown.
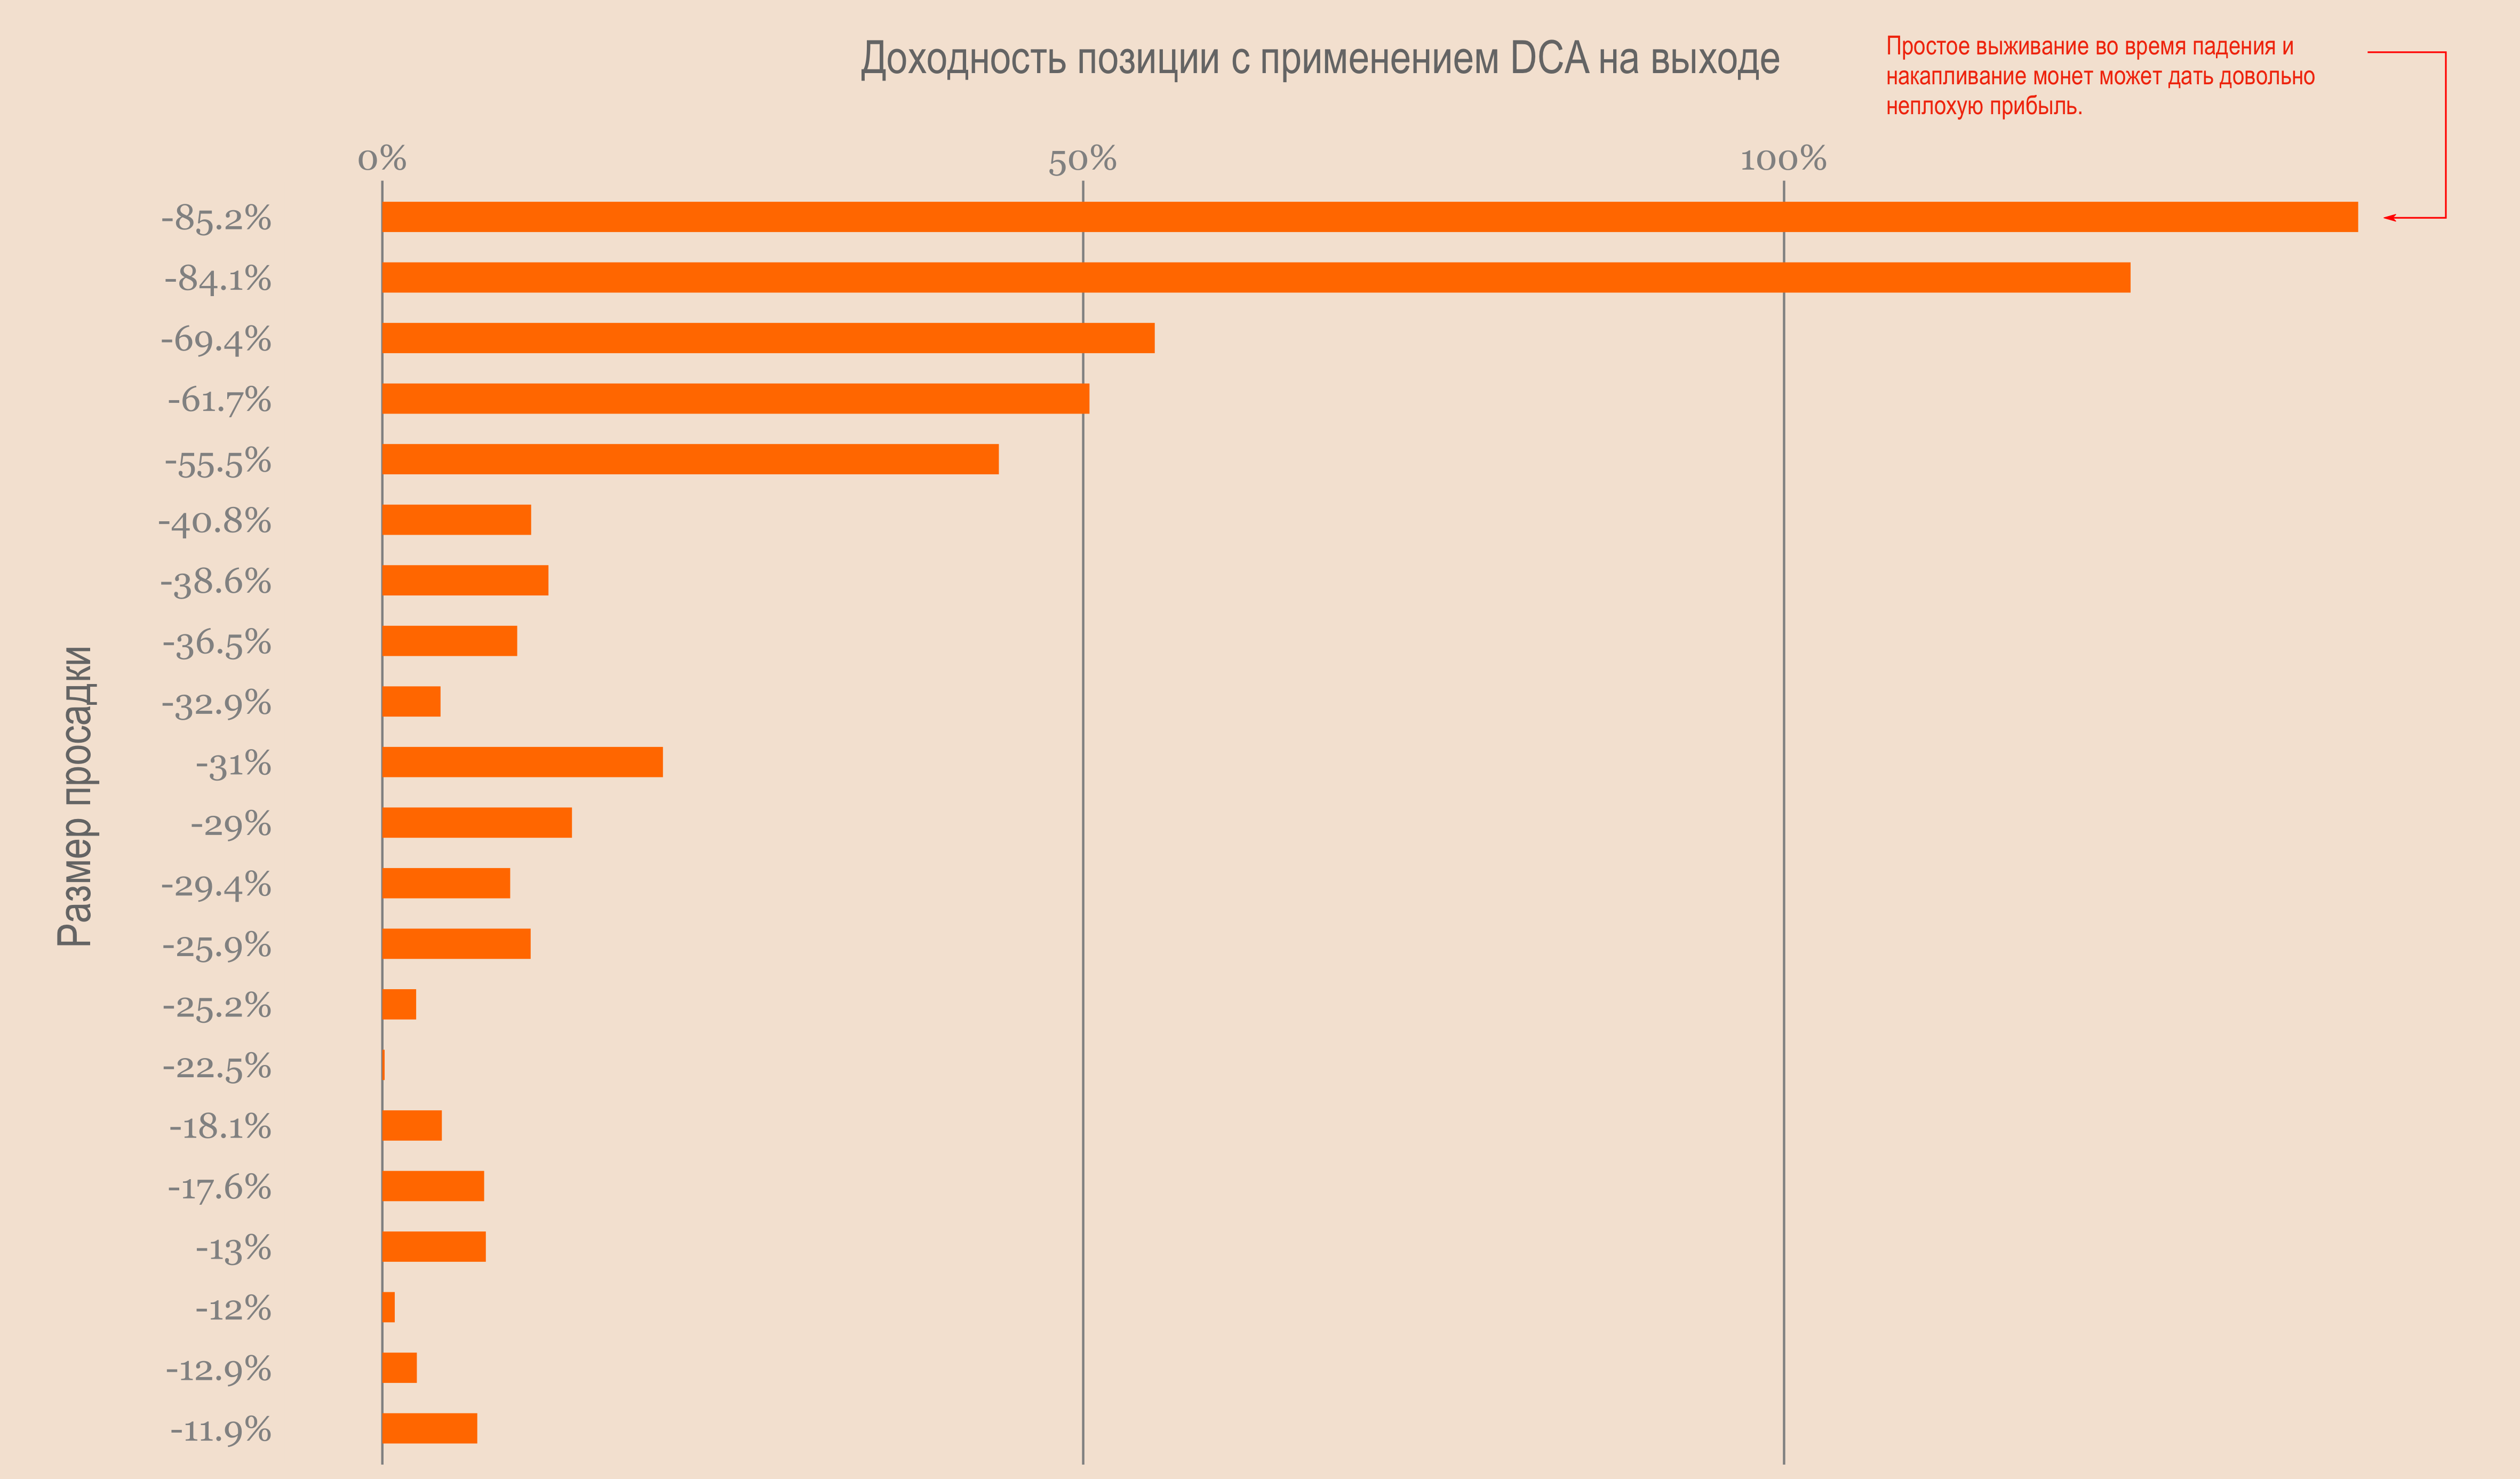
Dollar value averaging
Some remarks:
- One might expect that the larger the drawdown,the greater the yield. Obviously, looking at smaller drawdowns, this is not the case. What really matters is how many Mondays there were at a given drawdown level. The more Mondays in deep drawdowns, the higher the profit.
- Applying the DCA strategy throughoutbear market is quite useful. In the previous two drawdowns at the end of the cycle, you would have already risen over 100% as the next bull market was just beginning.
And without the use of adaptive DCA, the results are alreadypretty good. If you believe that bitcoin will eventually return to its previous values, continuing to average the dollar value during a bear market is not difficult.
Now, with some simple logic, we know that adaptive DCA is bound to generate more returns. But how big?
Let's look at the difference between returns on exiting adaptive DCA and DCA. This is what we call the Adaptive DCA Excess Return in the chart below.
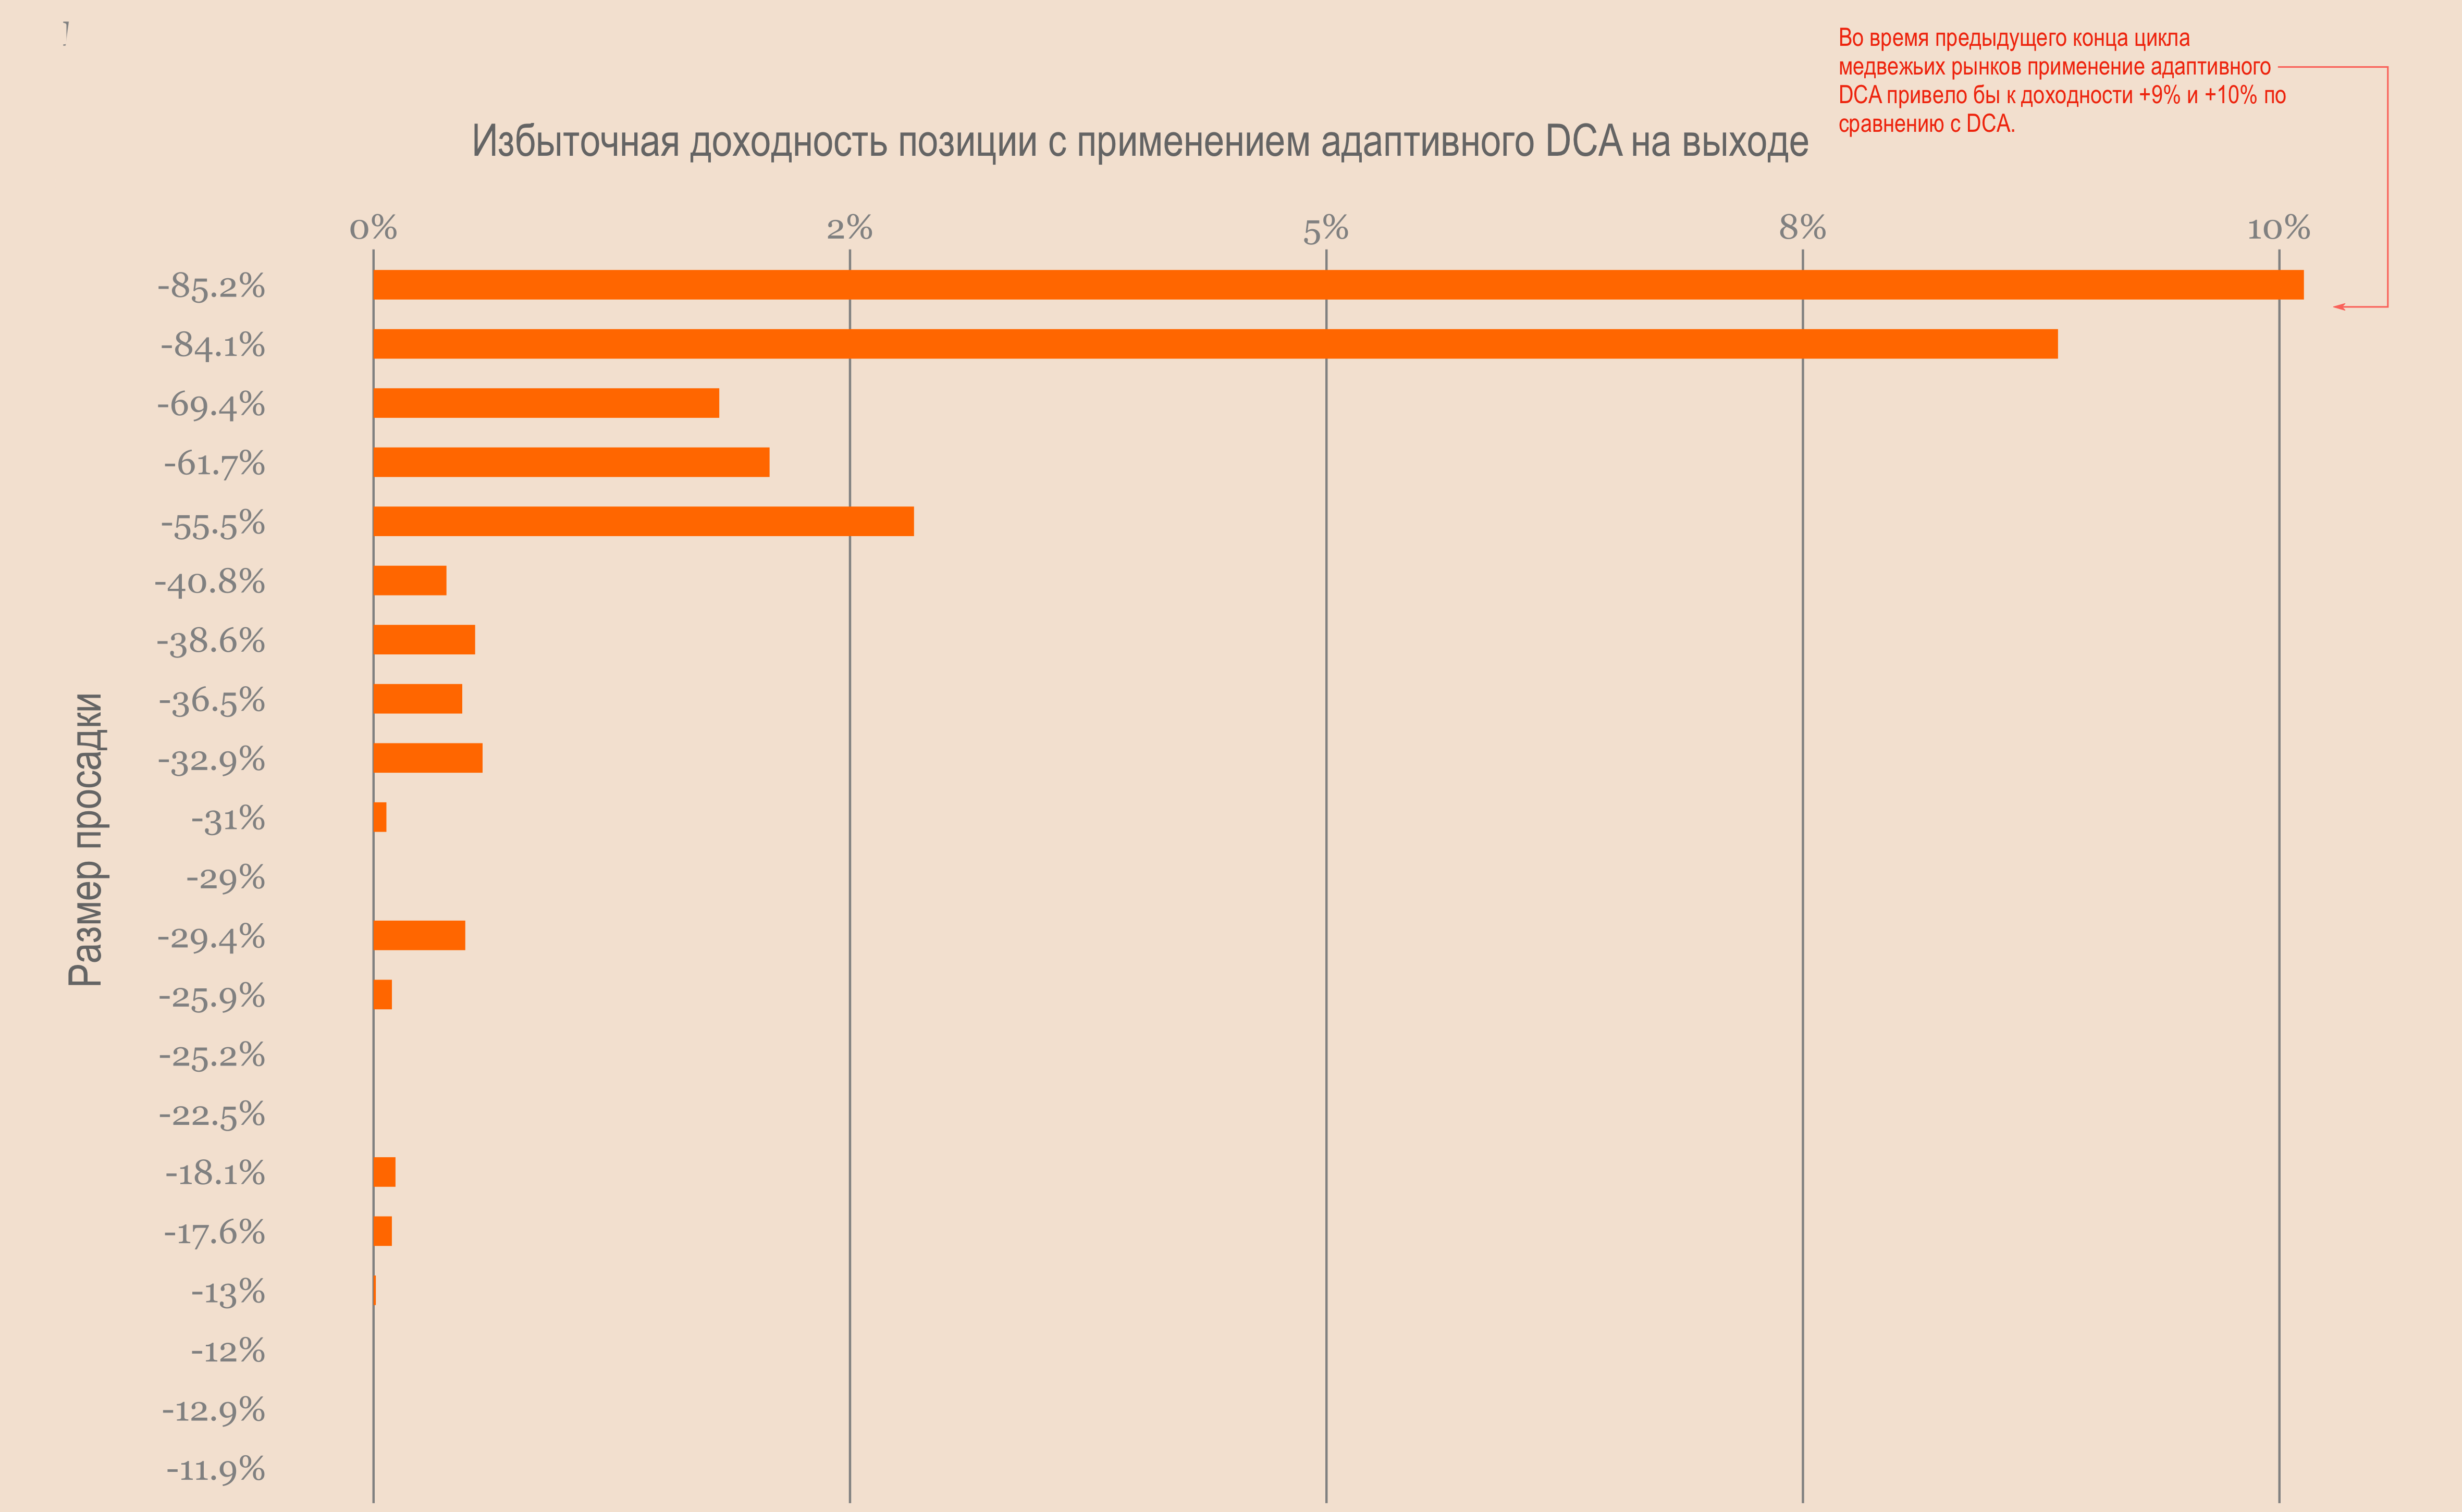
Adaptive Dollar Cost Averaging
True, in most cases additionalprofitability is low. As with a full bear market, you get an additional 10% on top of the 150% profit from DCA. Looking at the sample of drawdowns we have, it seems that in good scenarios, adaptive DCA is about 10% better than DCA.
If you're trying to optimize why not. But there is some trade-off when choosing between DCA and adaptive DCA.
With DCA, you deposit a fixed amount of equity every time you make a purchase. This means it's easy to budget and easy to stick to.
With adaptive DCA, you will have to commit more capital in order to generate excess returns. But how much more capital?
Check out the chart below.
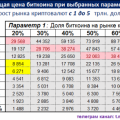
The vertical axis represents excess returns. On the horizontal axis, you can see how much more capital you would have invested by buying more when the drawdown increases.
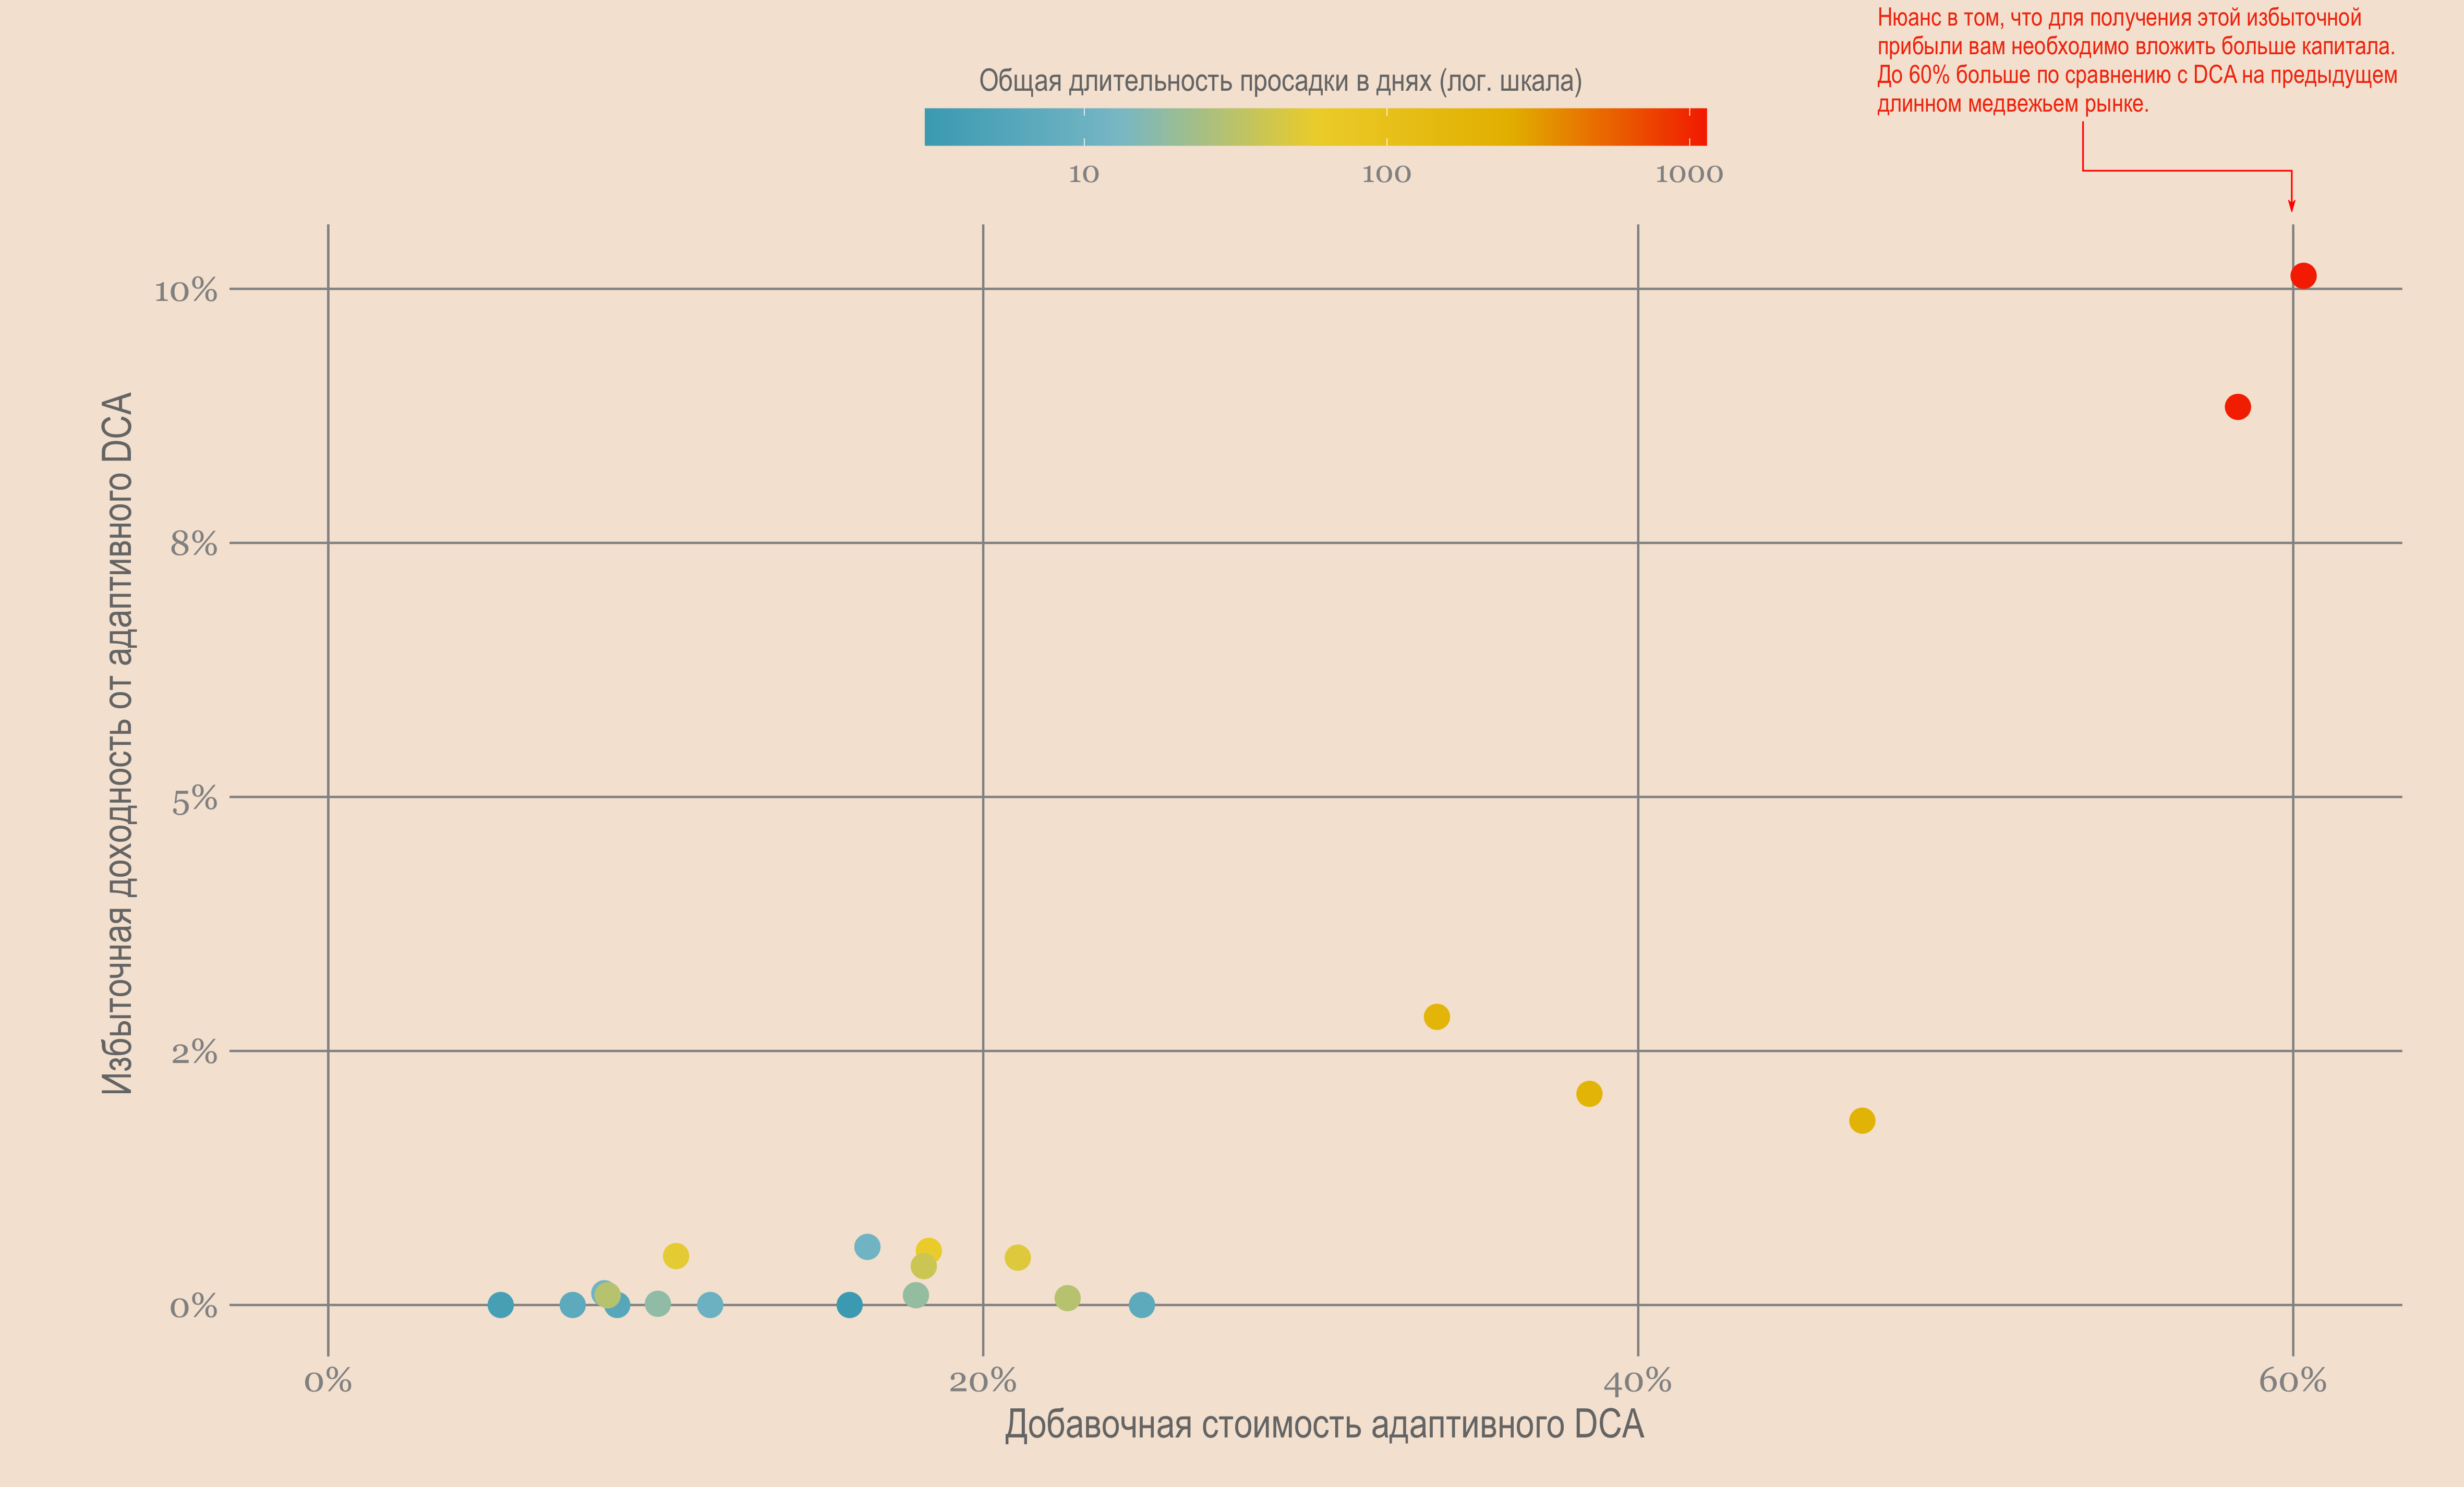
DCA vs adaptive DCA
So, based on these long bear markets, you would have invested 60% more capital in an adaptive DCA position than in a DCA position, resulting in an additional 10% return.
Is it worth it? Judge for yourself.
Note that if you don't want to place more money in assets while still maintaining excess returns, there is always a way.
You can set up a strategy like this:instead of a DCA of $100 every Monday, you can average the dollar value by an amount proportional to the fall, i.e. if bitcoin hits 15% of its all-time high, you can use $15 instead. In this situation, you risk less money than with DCA, while capturing excess returns. Of course, your absolute return (ie in dollars) will also be lower.
Make a choice.
Personally, I will stick to the usual strategydollar cost averaging because it is easy to implement. But if you're willing to raise more capital to get more out of a bear market, then adaptive DCA is a good solution.
Market conditions
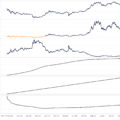
Starting from this post, we started tracking the dynamics of the model portfolio.
It's only been a week, so there's not much to analyze at the moment. But here's what it looks like.
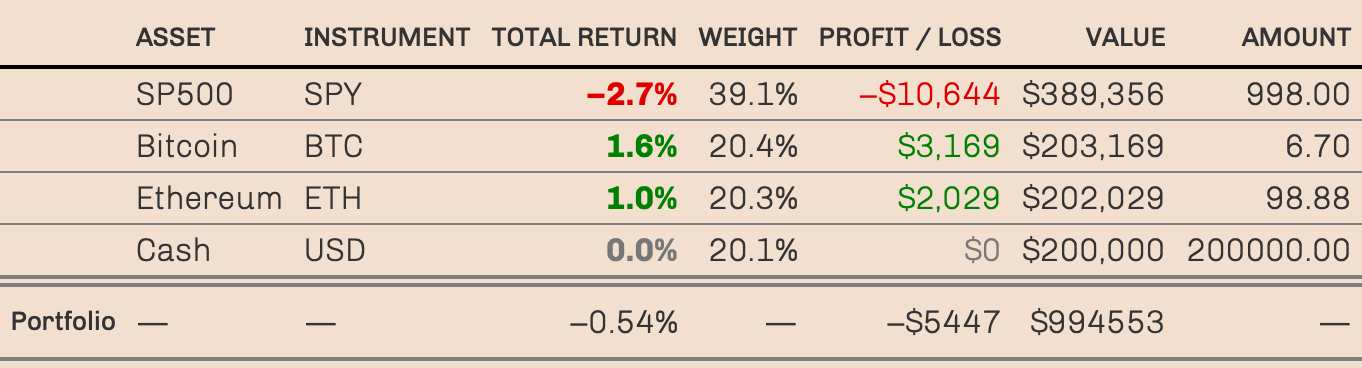
Basically, it's flat, given the volatility.
Remember, the goal of keeping 20% of assets in cash is that we expect things to get worse before they get better. And that means we'll buy more if there's a crash.
How likely is this to happen?
Well, the Fed has no reason to back down.They've already said they expect a "soft" landing, which is a soft way of saying it will end in recession. This also means that they are willing to push the stock market into bear market territory without doing anything.
Therefore, I would say that it is likely that we will see lower prices. Be that as it may, we are insured for all situations.
In fact, speaking of a bear market, the S&P 500 is entering the zone. This is pretty bad from a market psychology point of view.
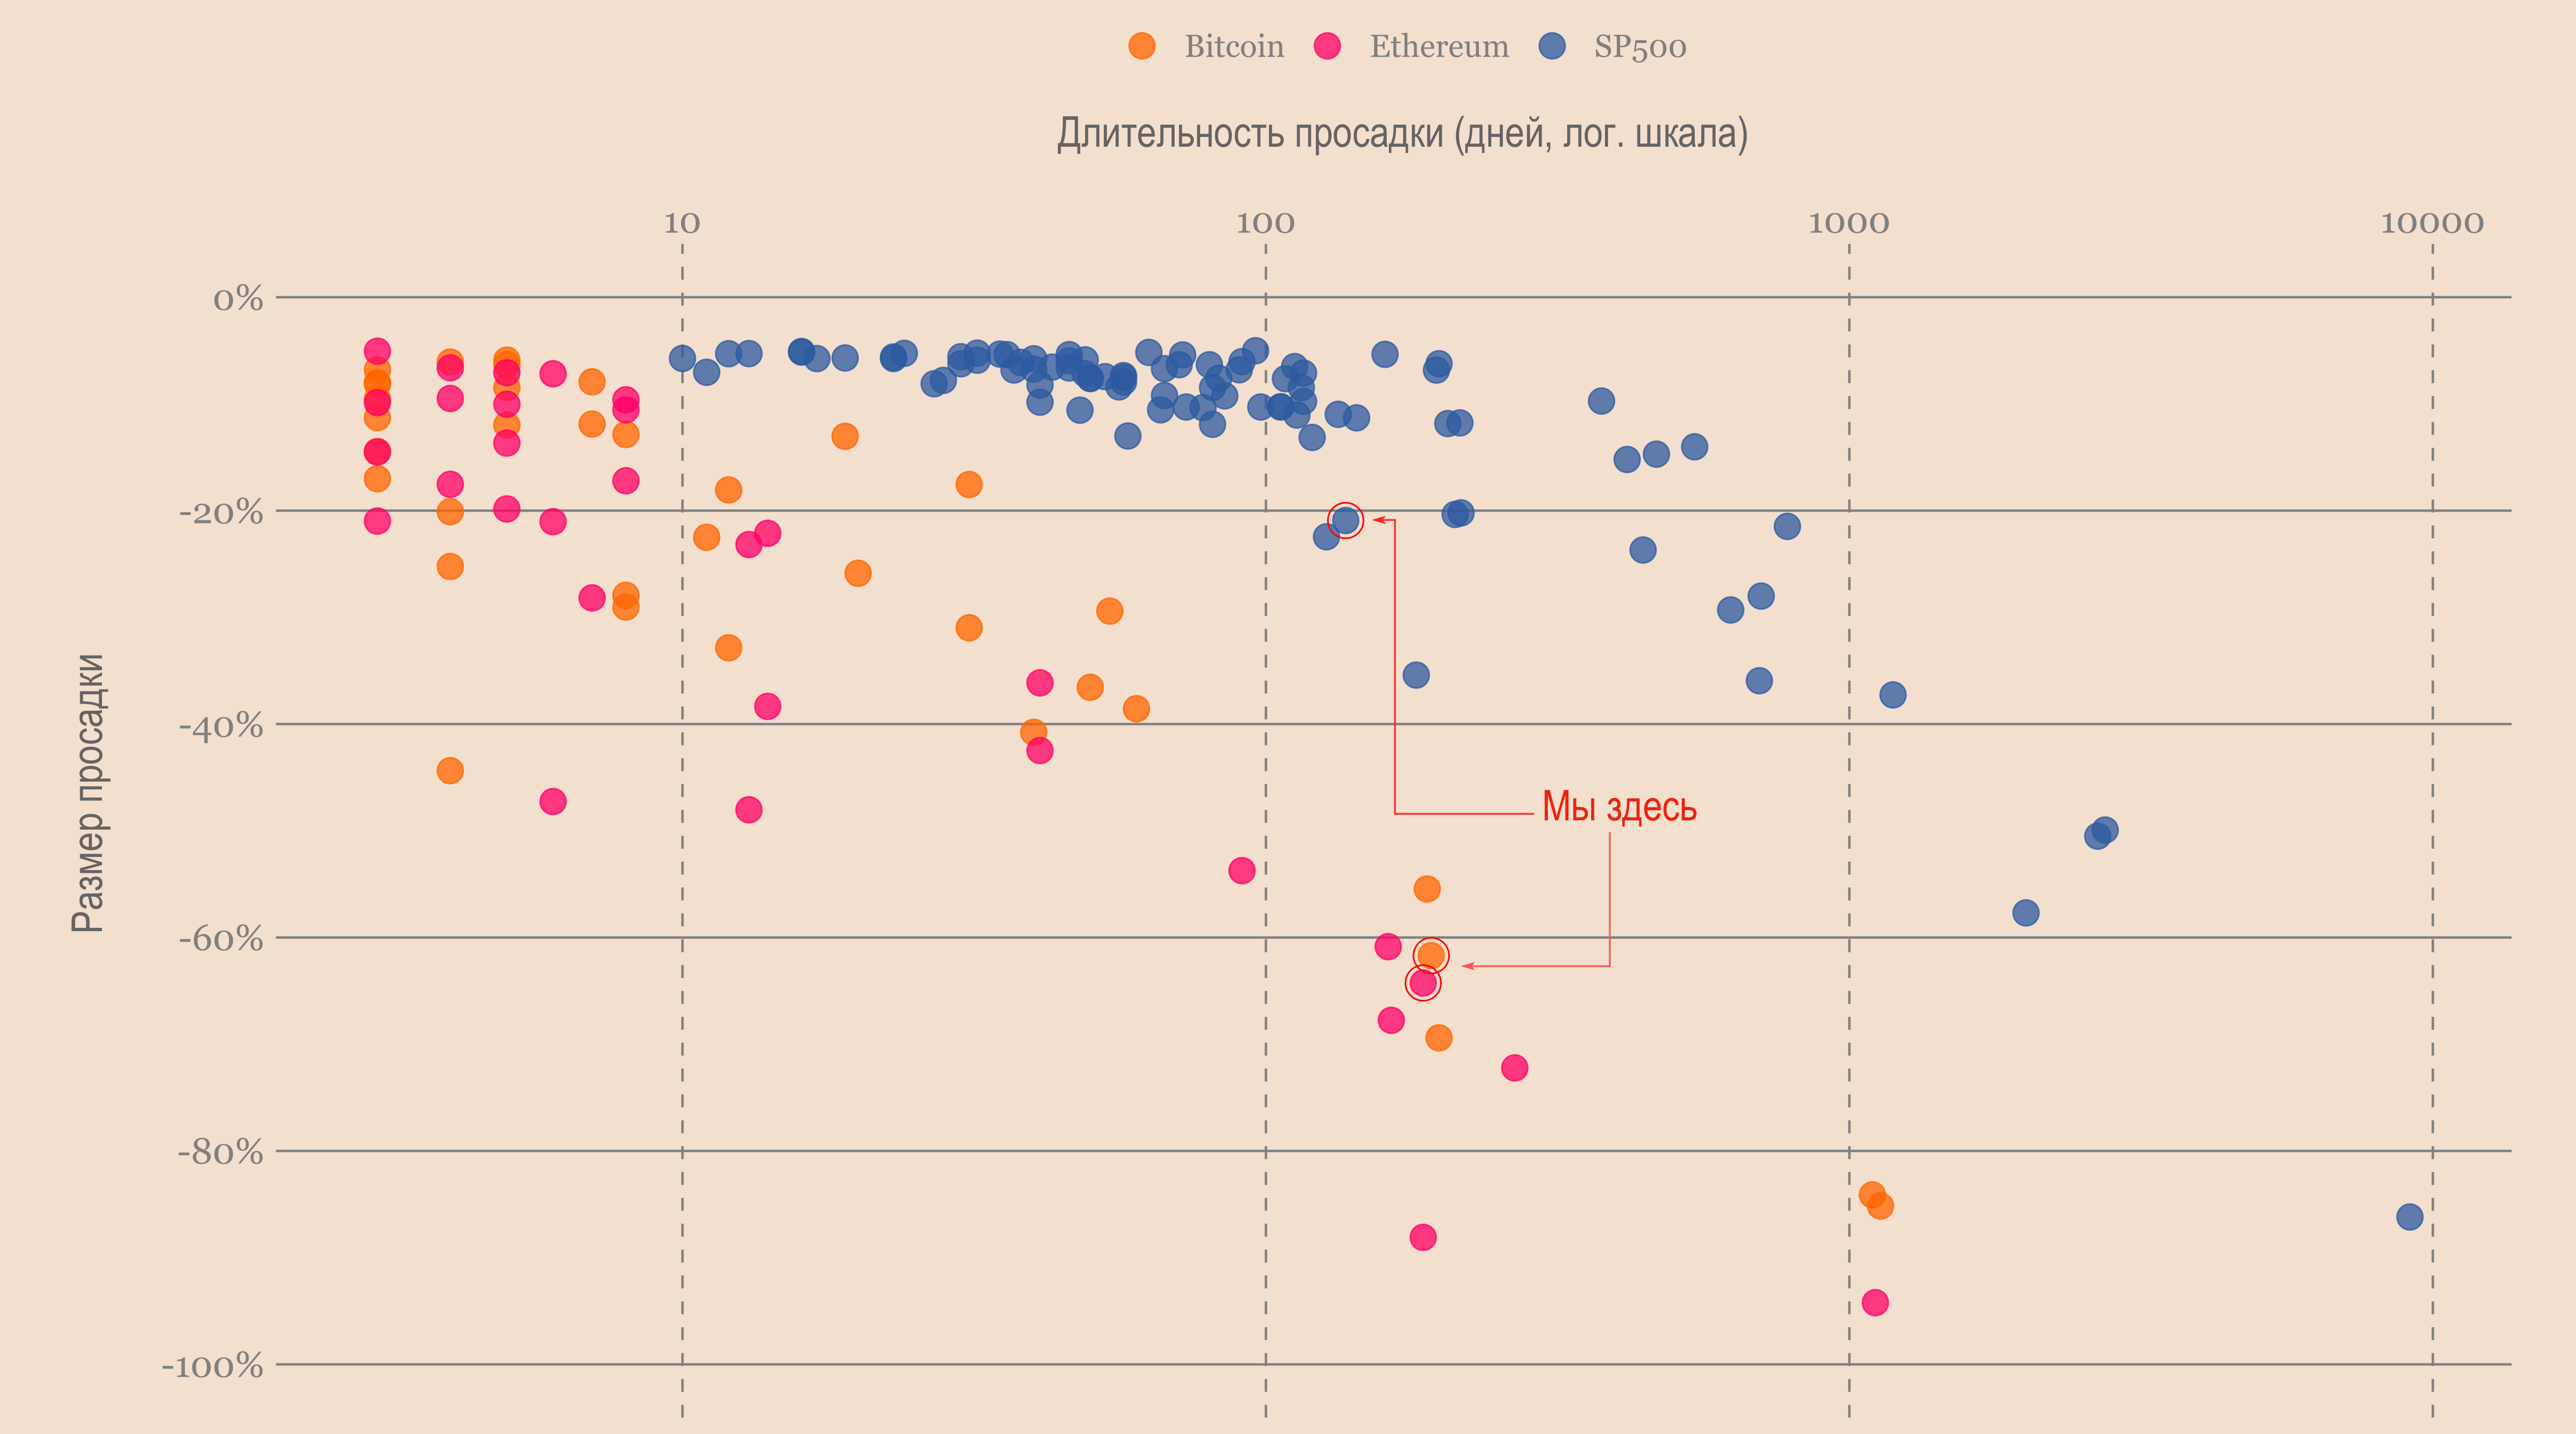
Dimensions and duration of drawdowns of BTC, ETH and S&P 500
I have read that there are early signs of a decoupling between bitcoin and the stock market. To be honest, 30 days of correlation data is very noisy, so I'm not sure if it means anything.
Better to focus on the long-term chartcorrelations, which is much easier to analyze. What this chart says is that the correlations are peaking. However, they lead at a very high level. So it's too early to announce victory.
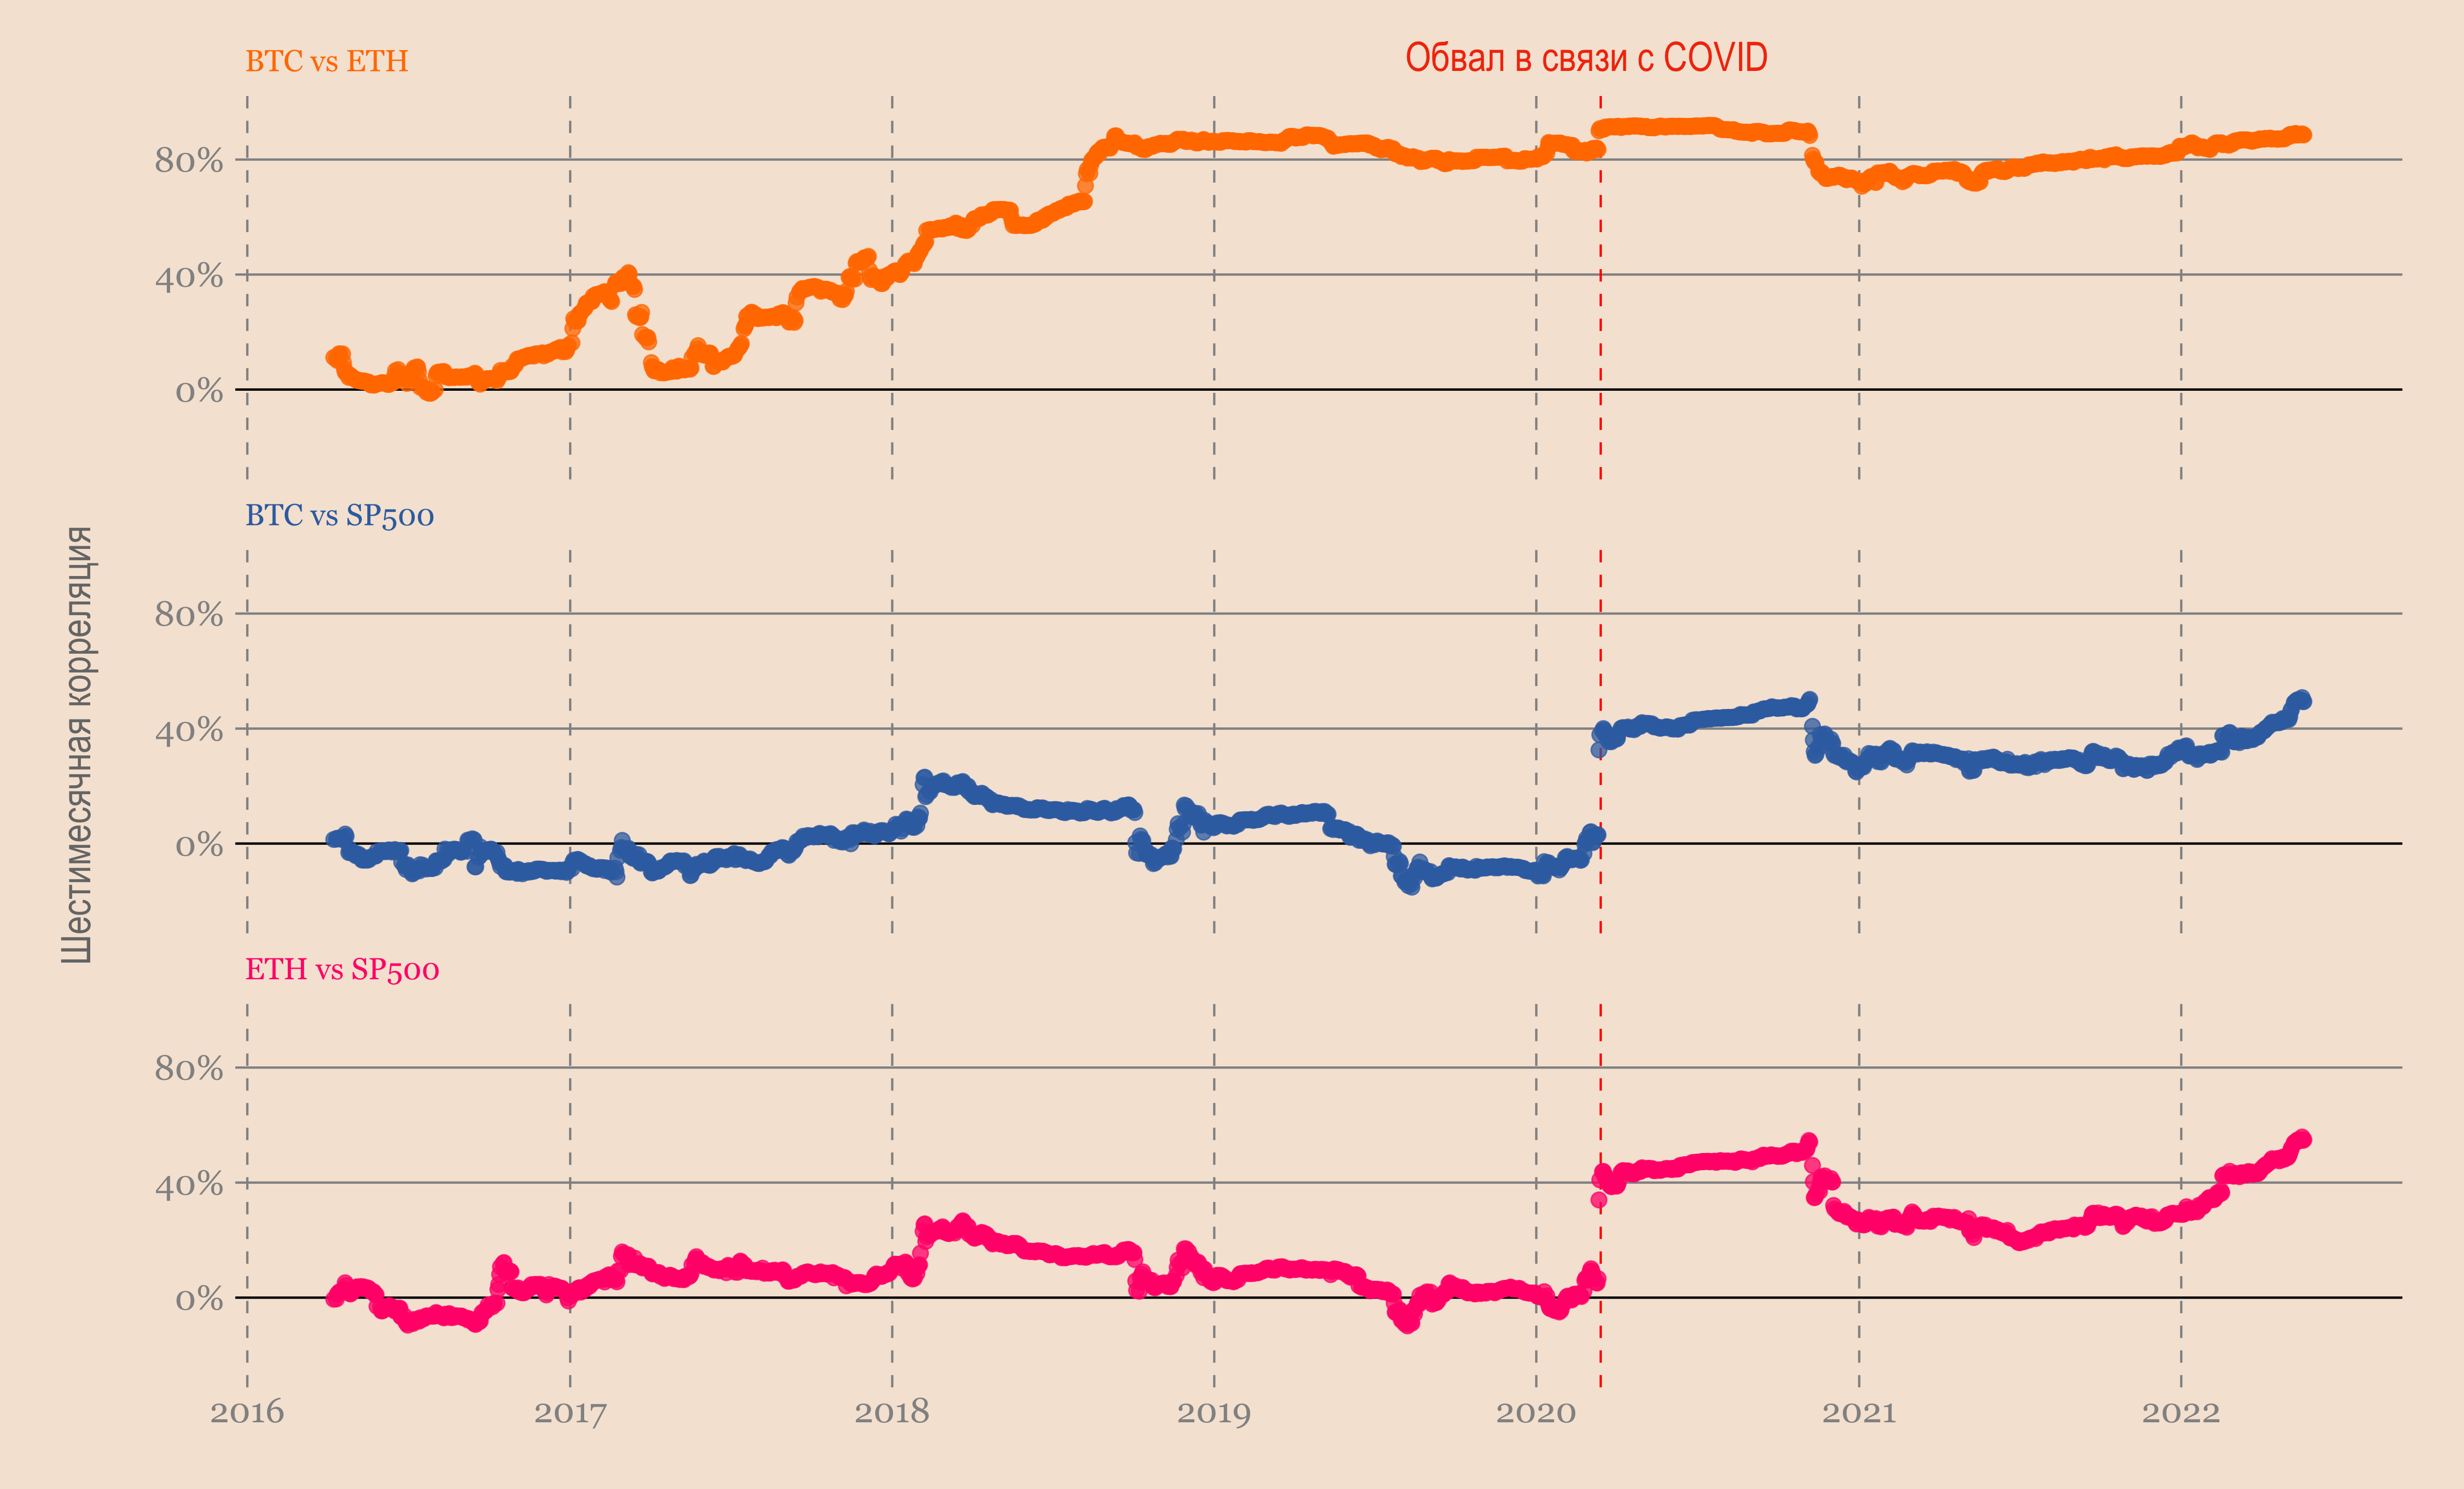
Correlations between BTC, ETH and S&P 500
There is very little on-chain activity, which is exactly what is expected in a bear market. The conclusion is that:
- small investors accumulate cheap coins;
- whales are consolidated with what looks like transfers/jumps between BTC addresses 1k to 10k and BTC addresses 10k to 100k.
Other than that, the market looks dead.
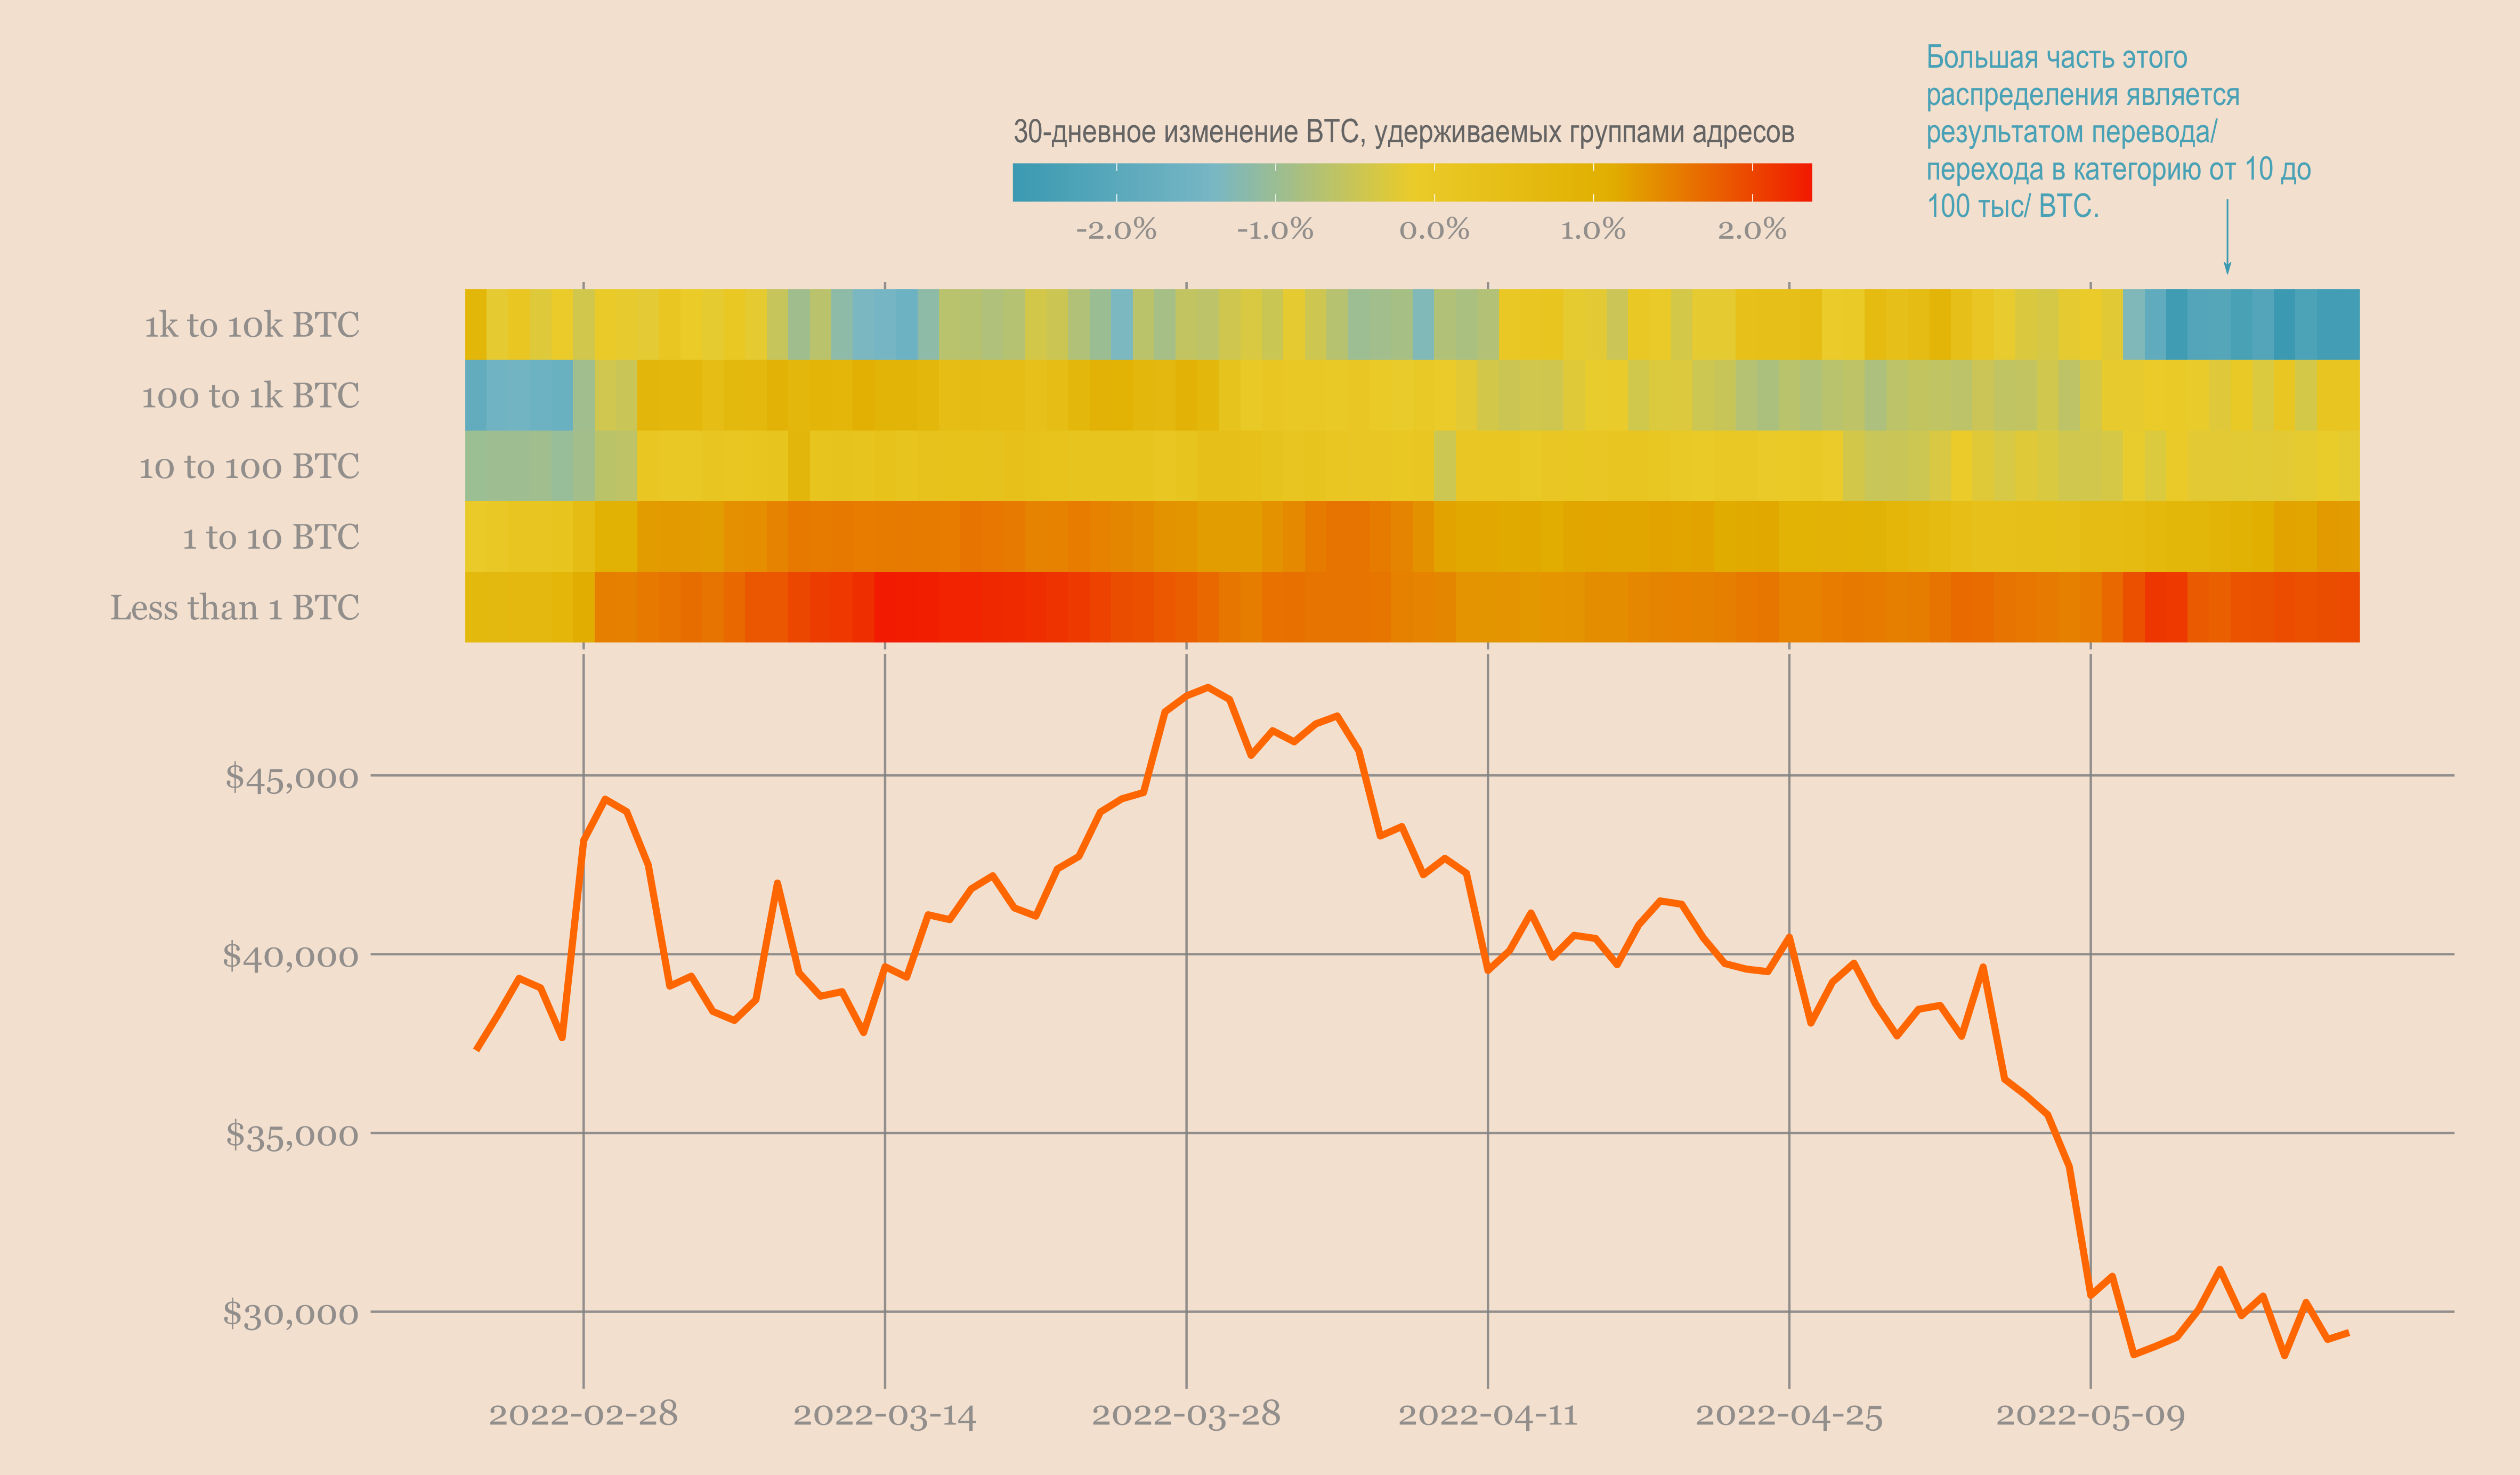
We have broken down bitcoin addresses by the number of coins they hold. For each group of addresses, we looked at the change in the total number of coins held in the last 30 days.
There is one interesting fact about the accumulation trend metric. If you remember, there are two versions of the metric:
- from Ecoinometrics based on address groups.
- a metric from Glassnode based on network subjects that includes some momentum components.
Right now these two metrics are opposite of each other.friend. The Glassnode version is stuck at level 1 (meaning a lot of accumulation is happening) while the Ecoinometrics version is at a very low level (0.27, meaning very little accumulation is happening).
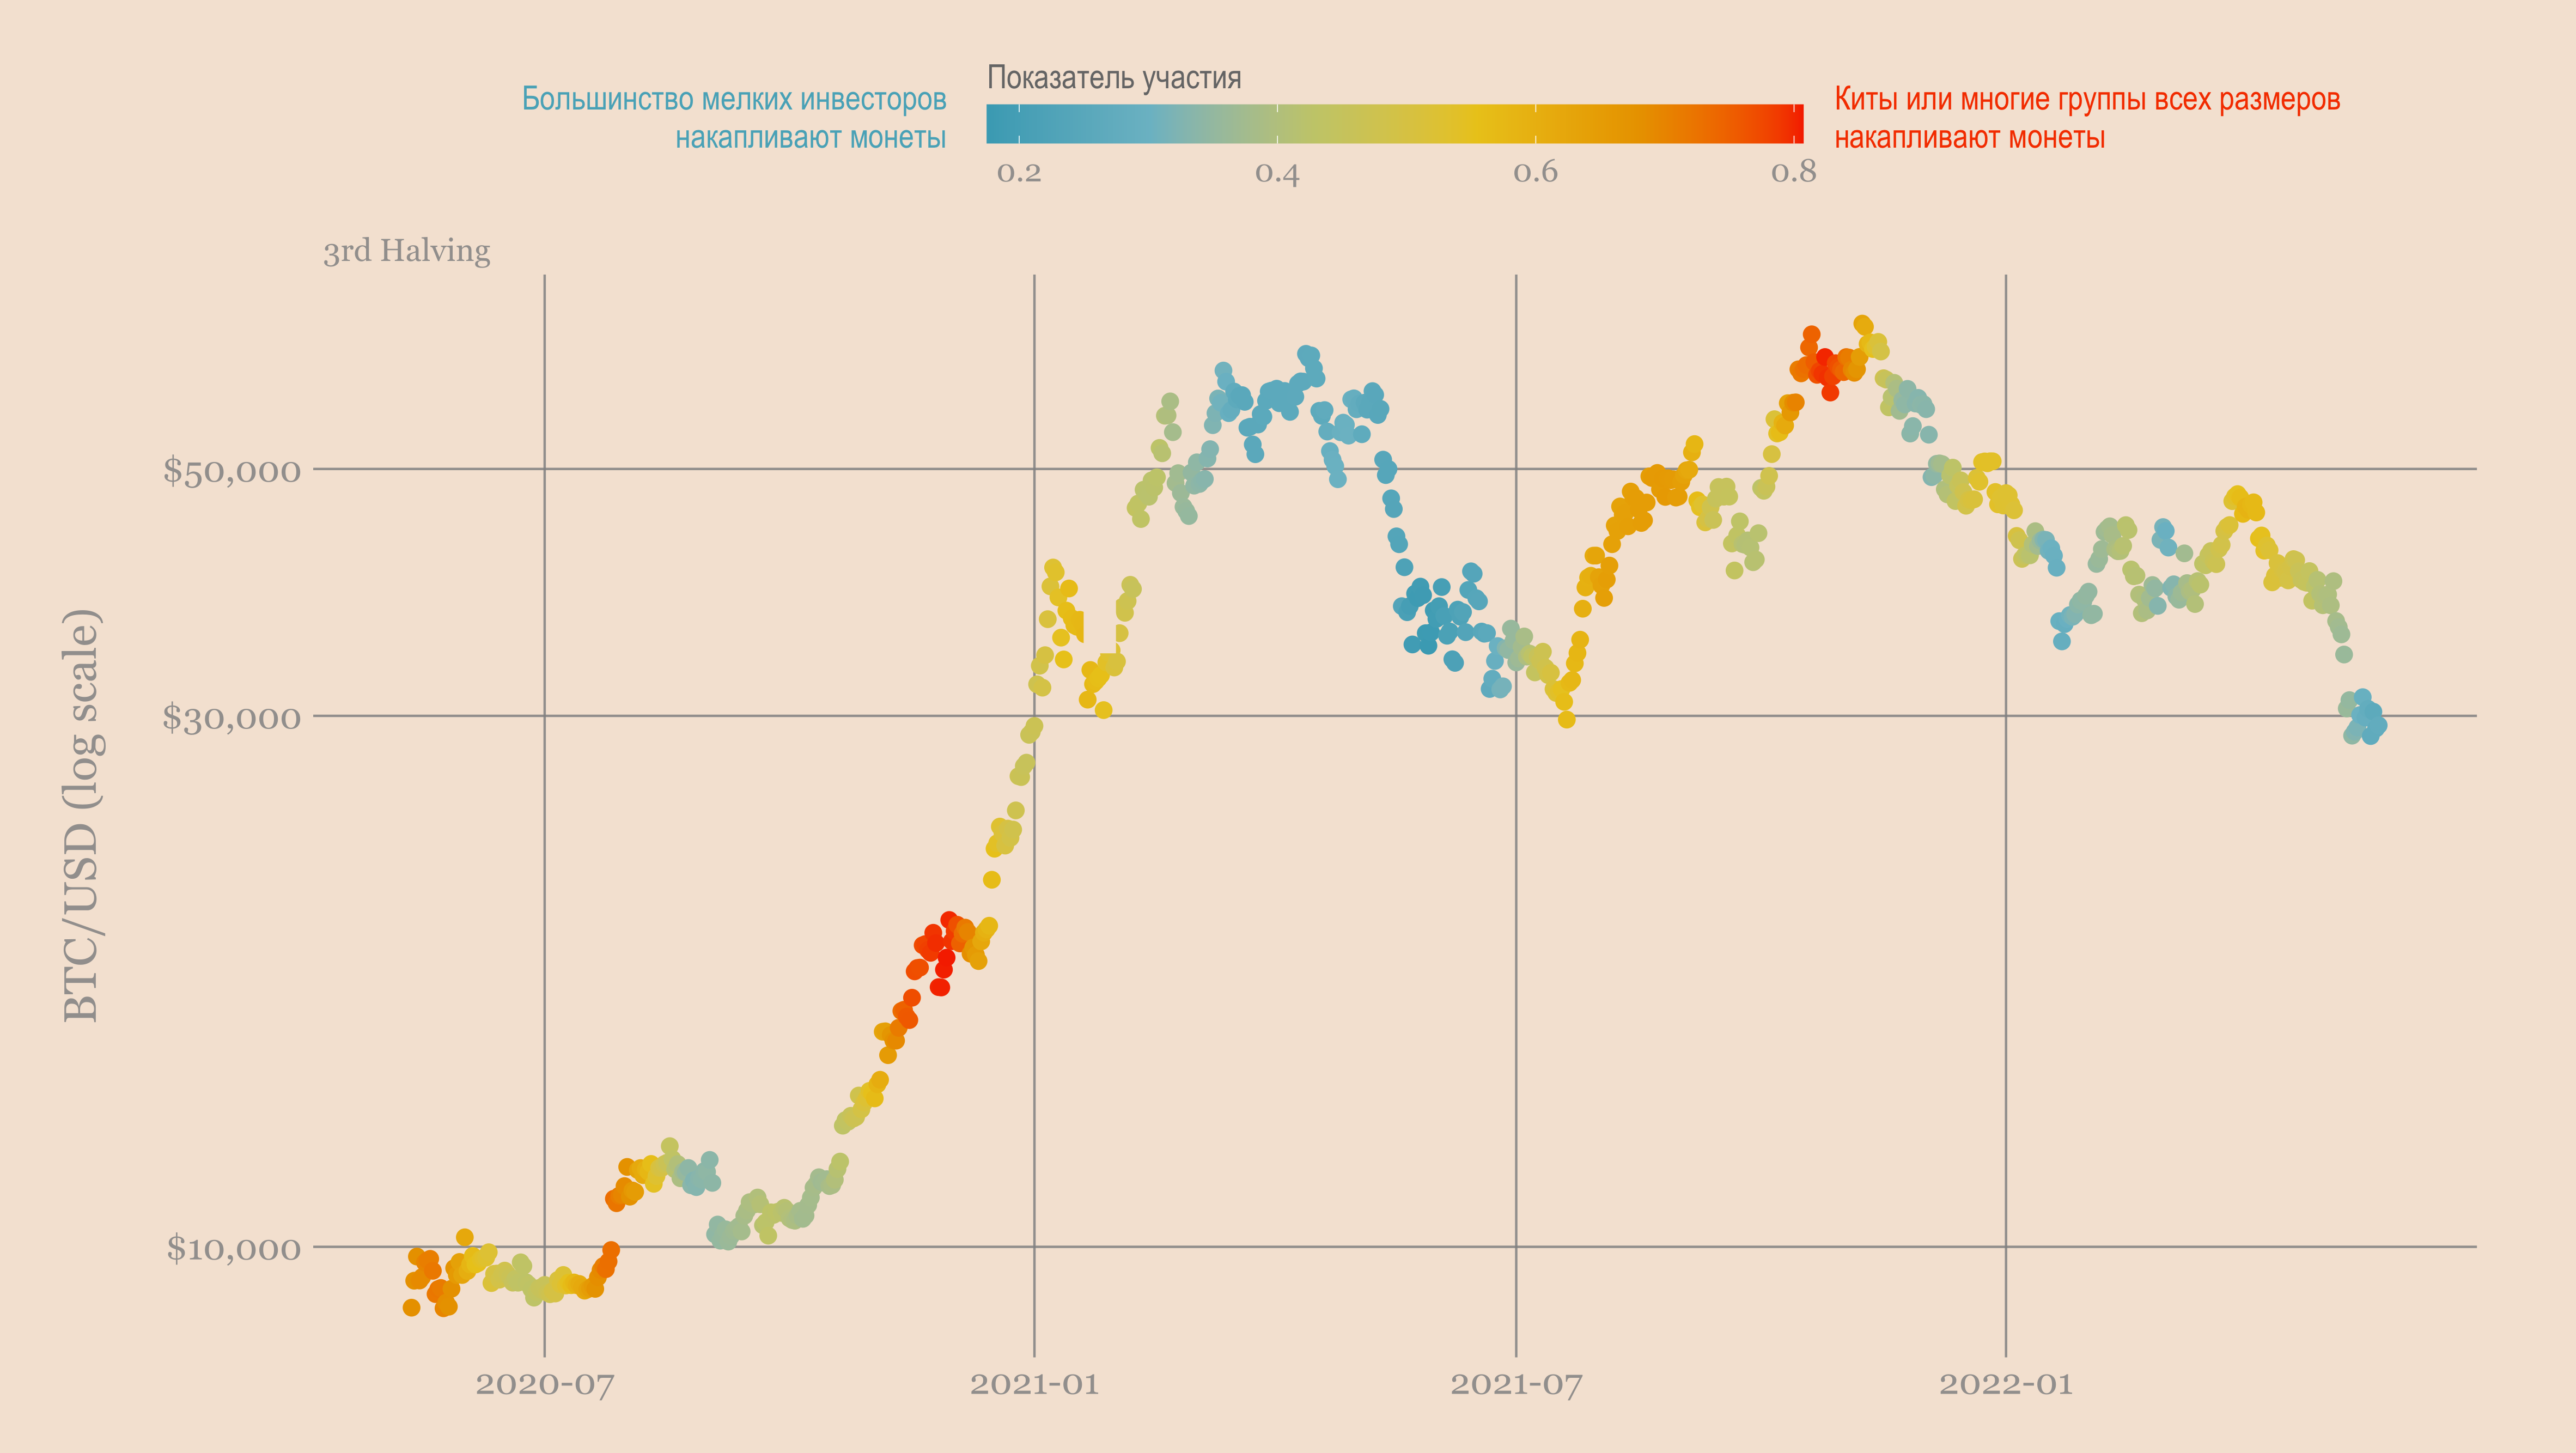
Accumulation trends
This is not the first time these two metrics have disagreed.
To be honest, I'm not sure what that means, and without access to the exact formula used to calculate both metrics, it's hard to interpret the difference.
That being said, if all you care about is what is being said about bitcoin forward returns, then using either version of the indicator will say the same thing 30 days later.
Take a look for yourself.
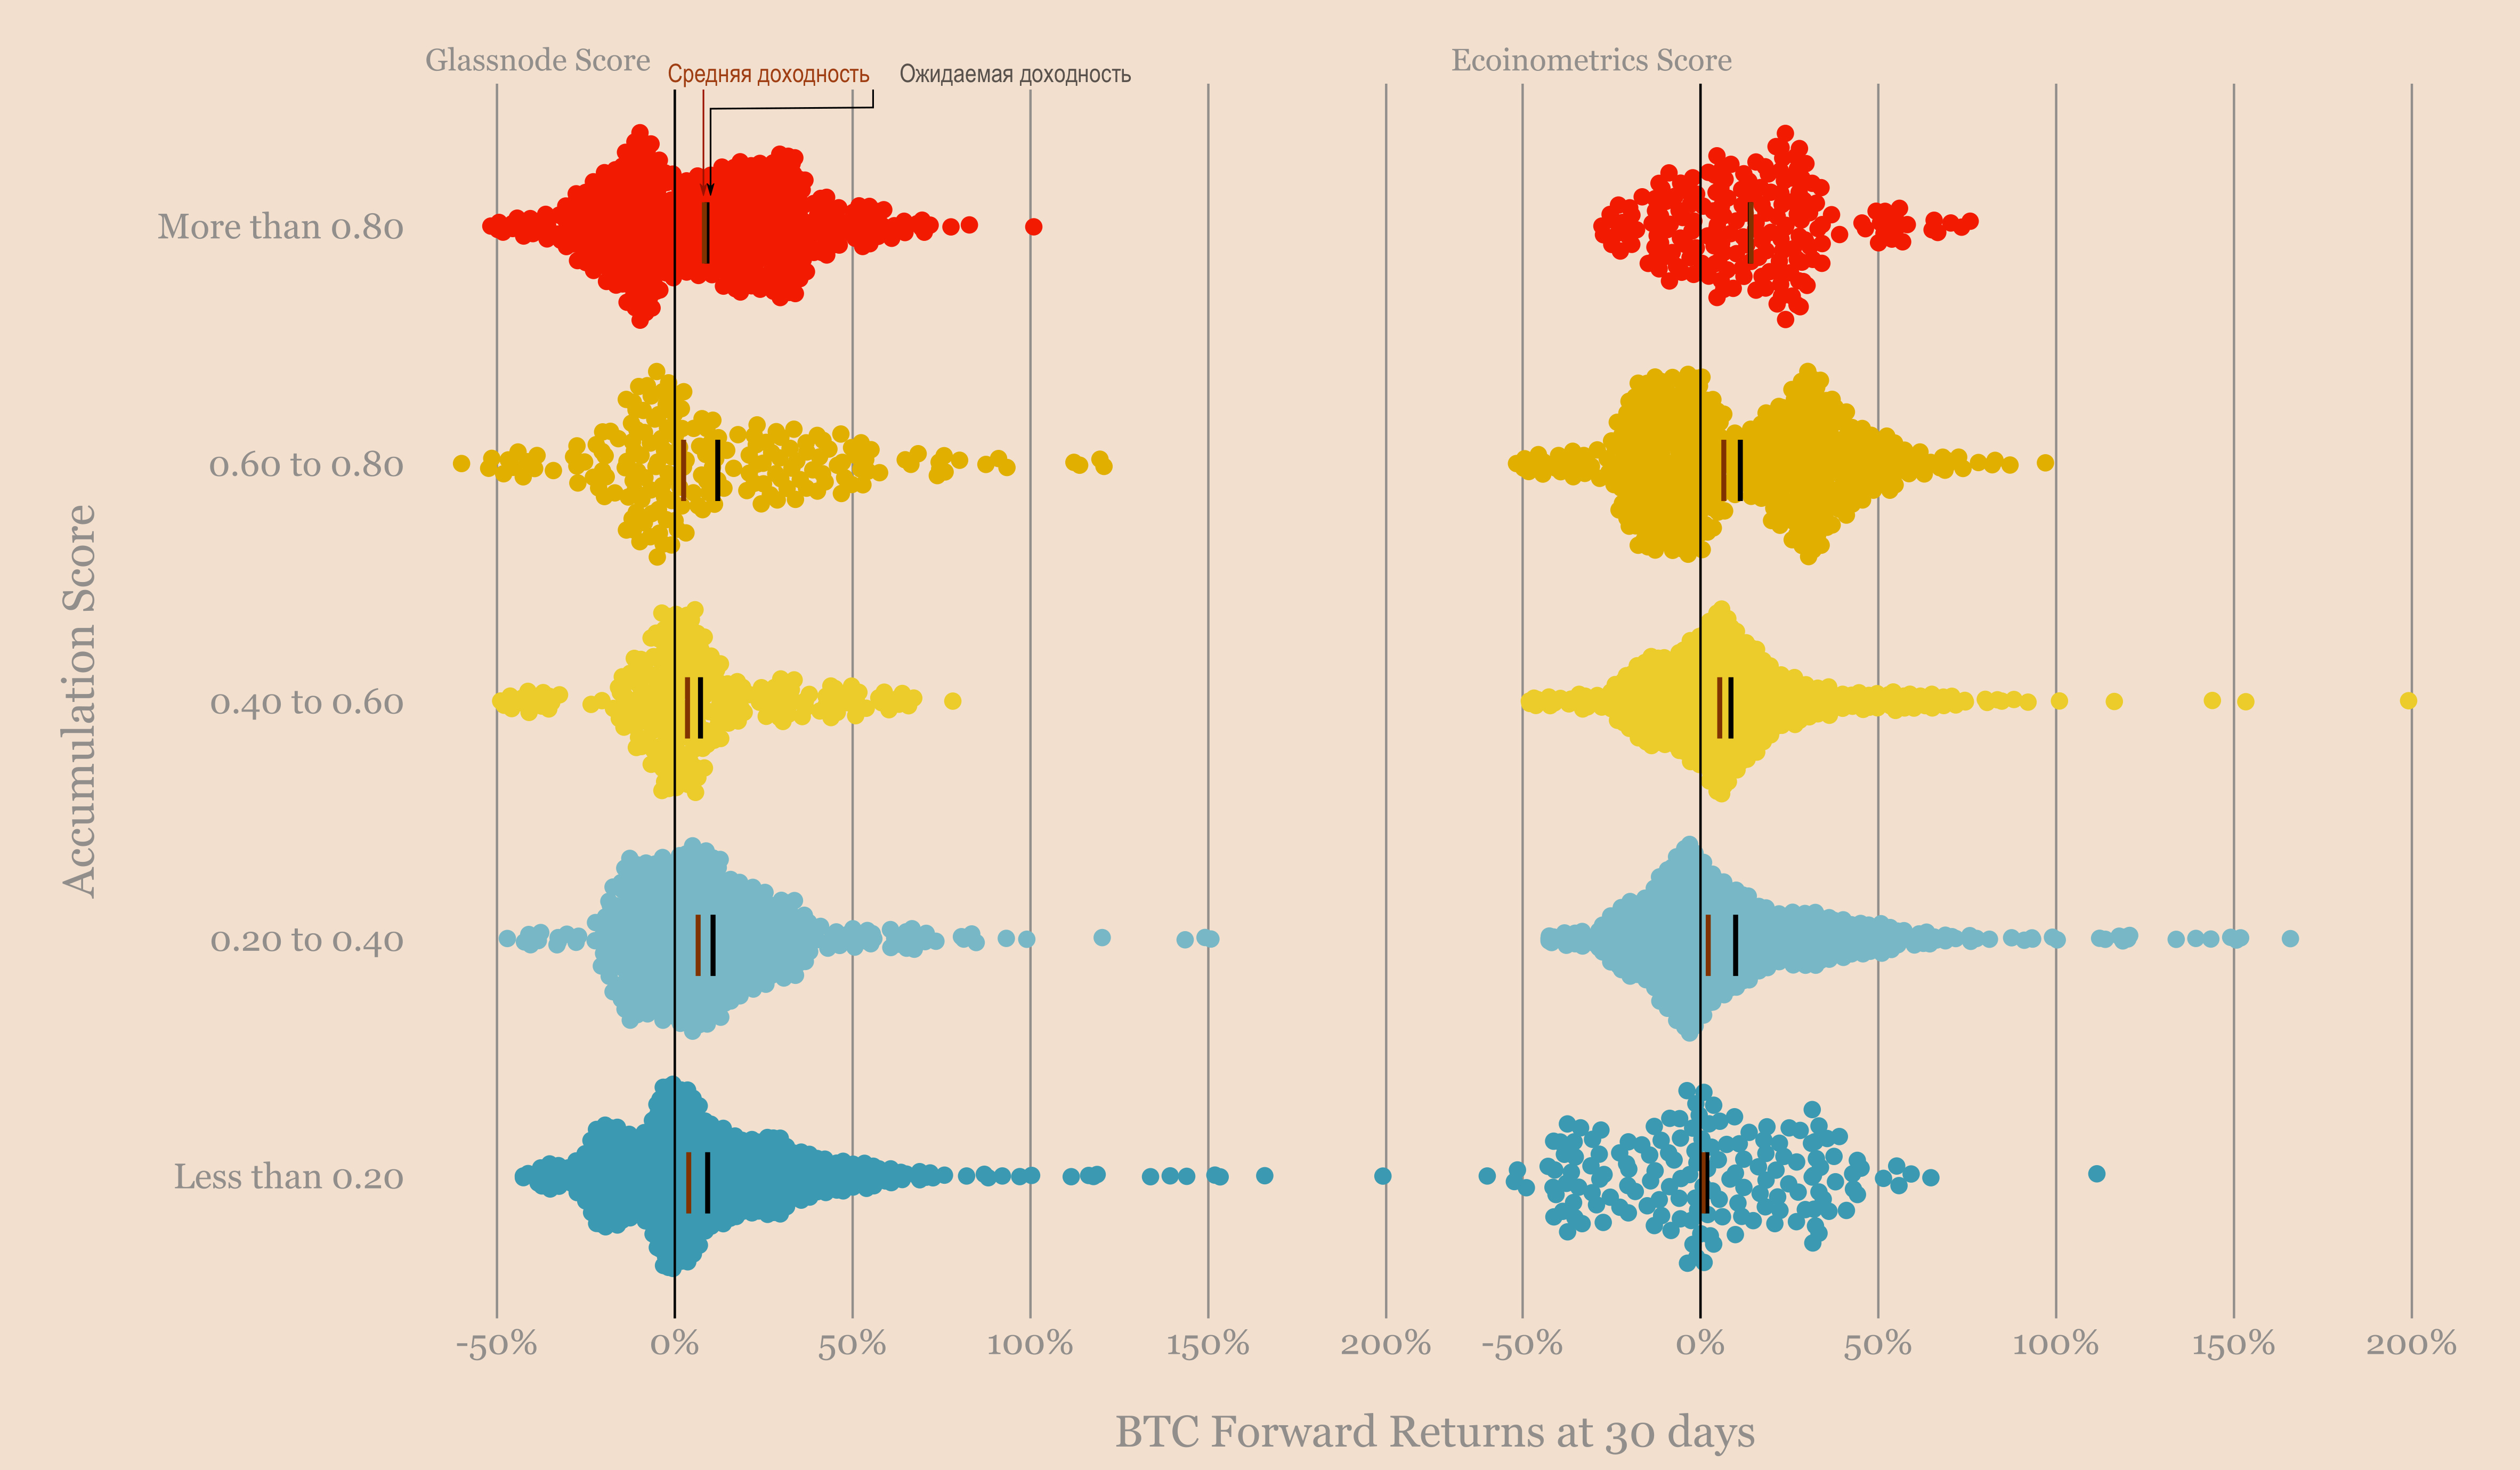
Accumulation trend metric from Ecoinometrics and from Glassnode
Low accumulation rate from Ecoinometricsusually implies low or negative one-month returns. But you can also see that the Glassnode valuation has most of the negative returns, even when its value is very high.
So historically the two are not in total conflict.
Let's see how this ends.
BitNews disclaim responsibility for anyinvestment recommendations that may be contained in this article. All the opinions expressed express exclusively the personal opinions of the author and the respondents. Any actions related to investments and trading on crypto markets involve the risk of losing the invested funds. Based on the data provided, you make investment decisions in a balanced, responsible manner and at your own risk.
Read this:
 What is dollar value averaging (DCA)?
 Results of the Dollar Cost Averaging Strategy Applied to Bitcoin
 Compound outperforms MakerDAO in value of locked assets
 Estimating the value of bitcoin (Part 2)
 Do you think the increase in the value of bitcoin is related to yesterday's increase in mining difficulty by 7.85%?
 The media disseminated an inaccurate statement about the cost of mining in the Russian Federation. Fact check ForkLog