Yesterday, buyers were able to continue their recovery, but will they have the strength to return prices to the July zone?maximum?
BTC / USD
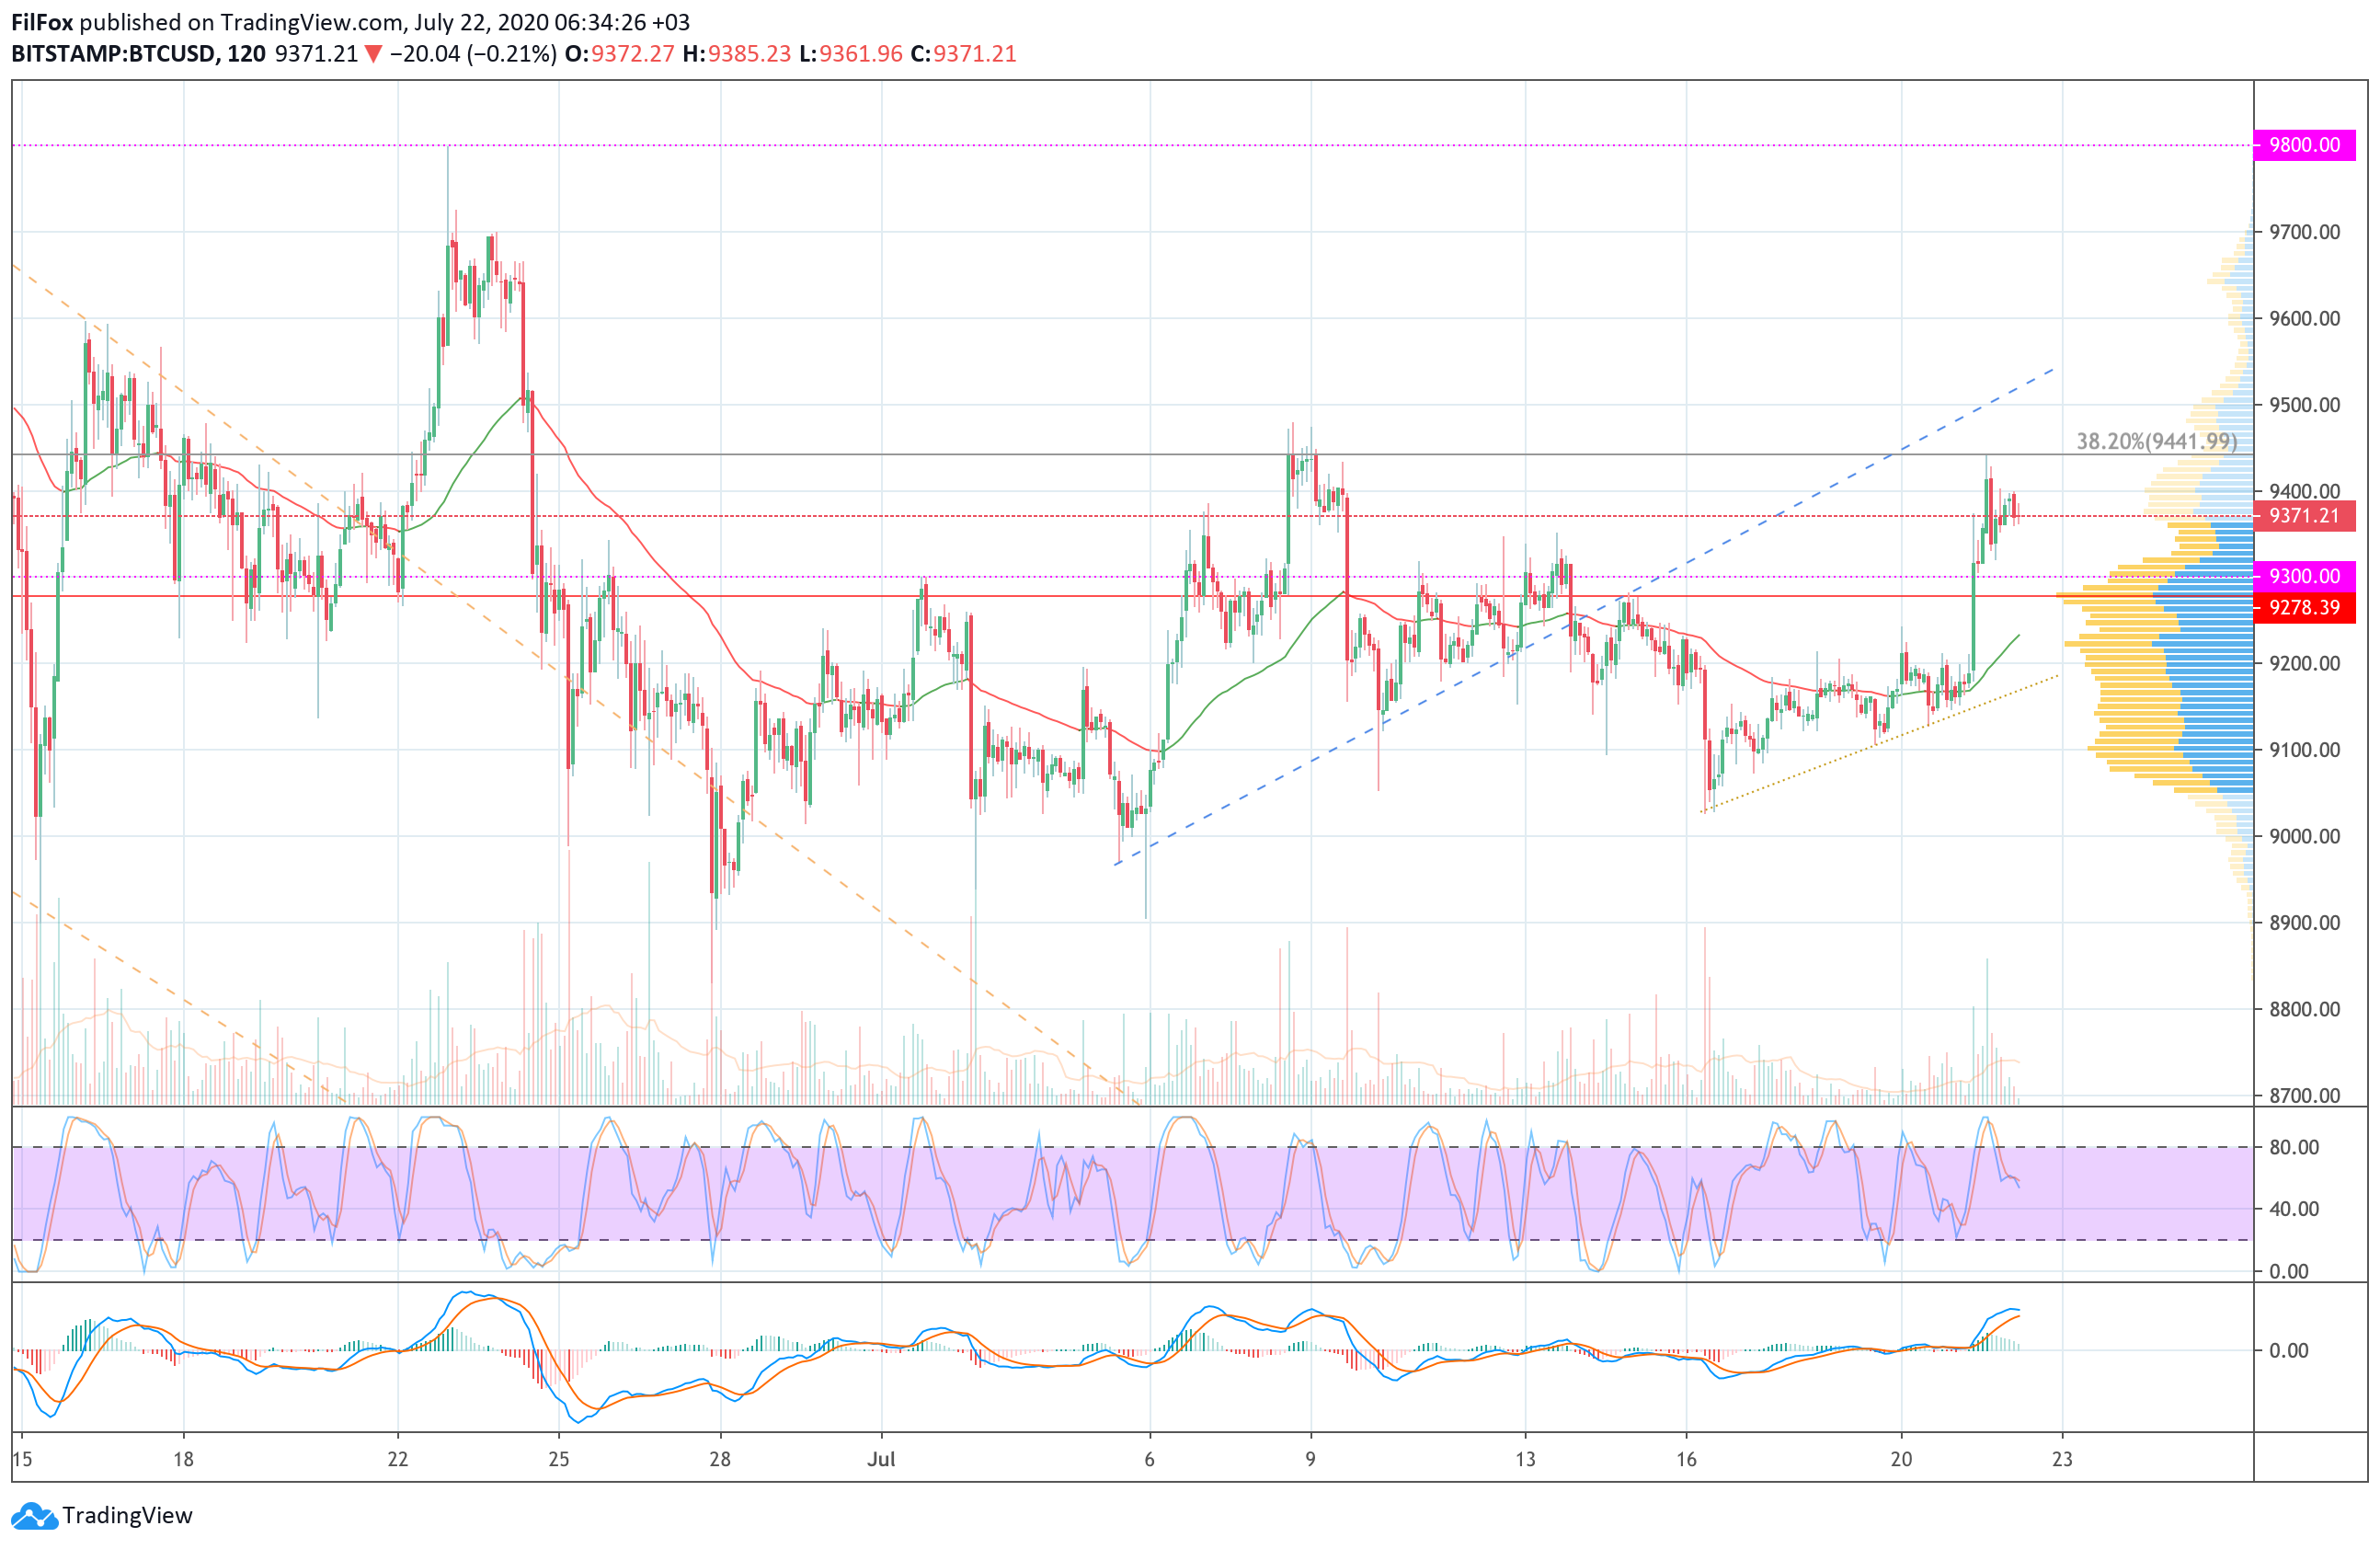
Yesterday, buyers were able to form a powerful bullishimpulse and broke through the key resistance of 9300.00 USD. During the day, the pair tested the 38.2% fib level (9441.98 USD), which pushed the BTC price back to the 9320.00 USD mark.
Over the past night, buyers triedrestore the pair, but on small volumes they were unable to return the price to the area of yesterday's high. If the level of 9300.00 USD acts as support today, then the bulls can continue to recover to the blue ascending trend line.
If the bears push the price of 9300.00 USD, then you can count on support from the two-hour moving average EMA55.
ETH / USD
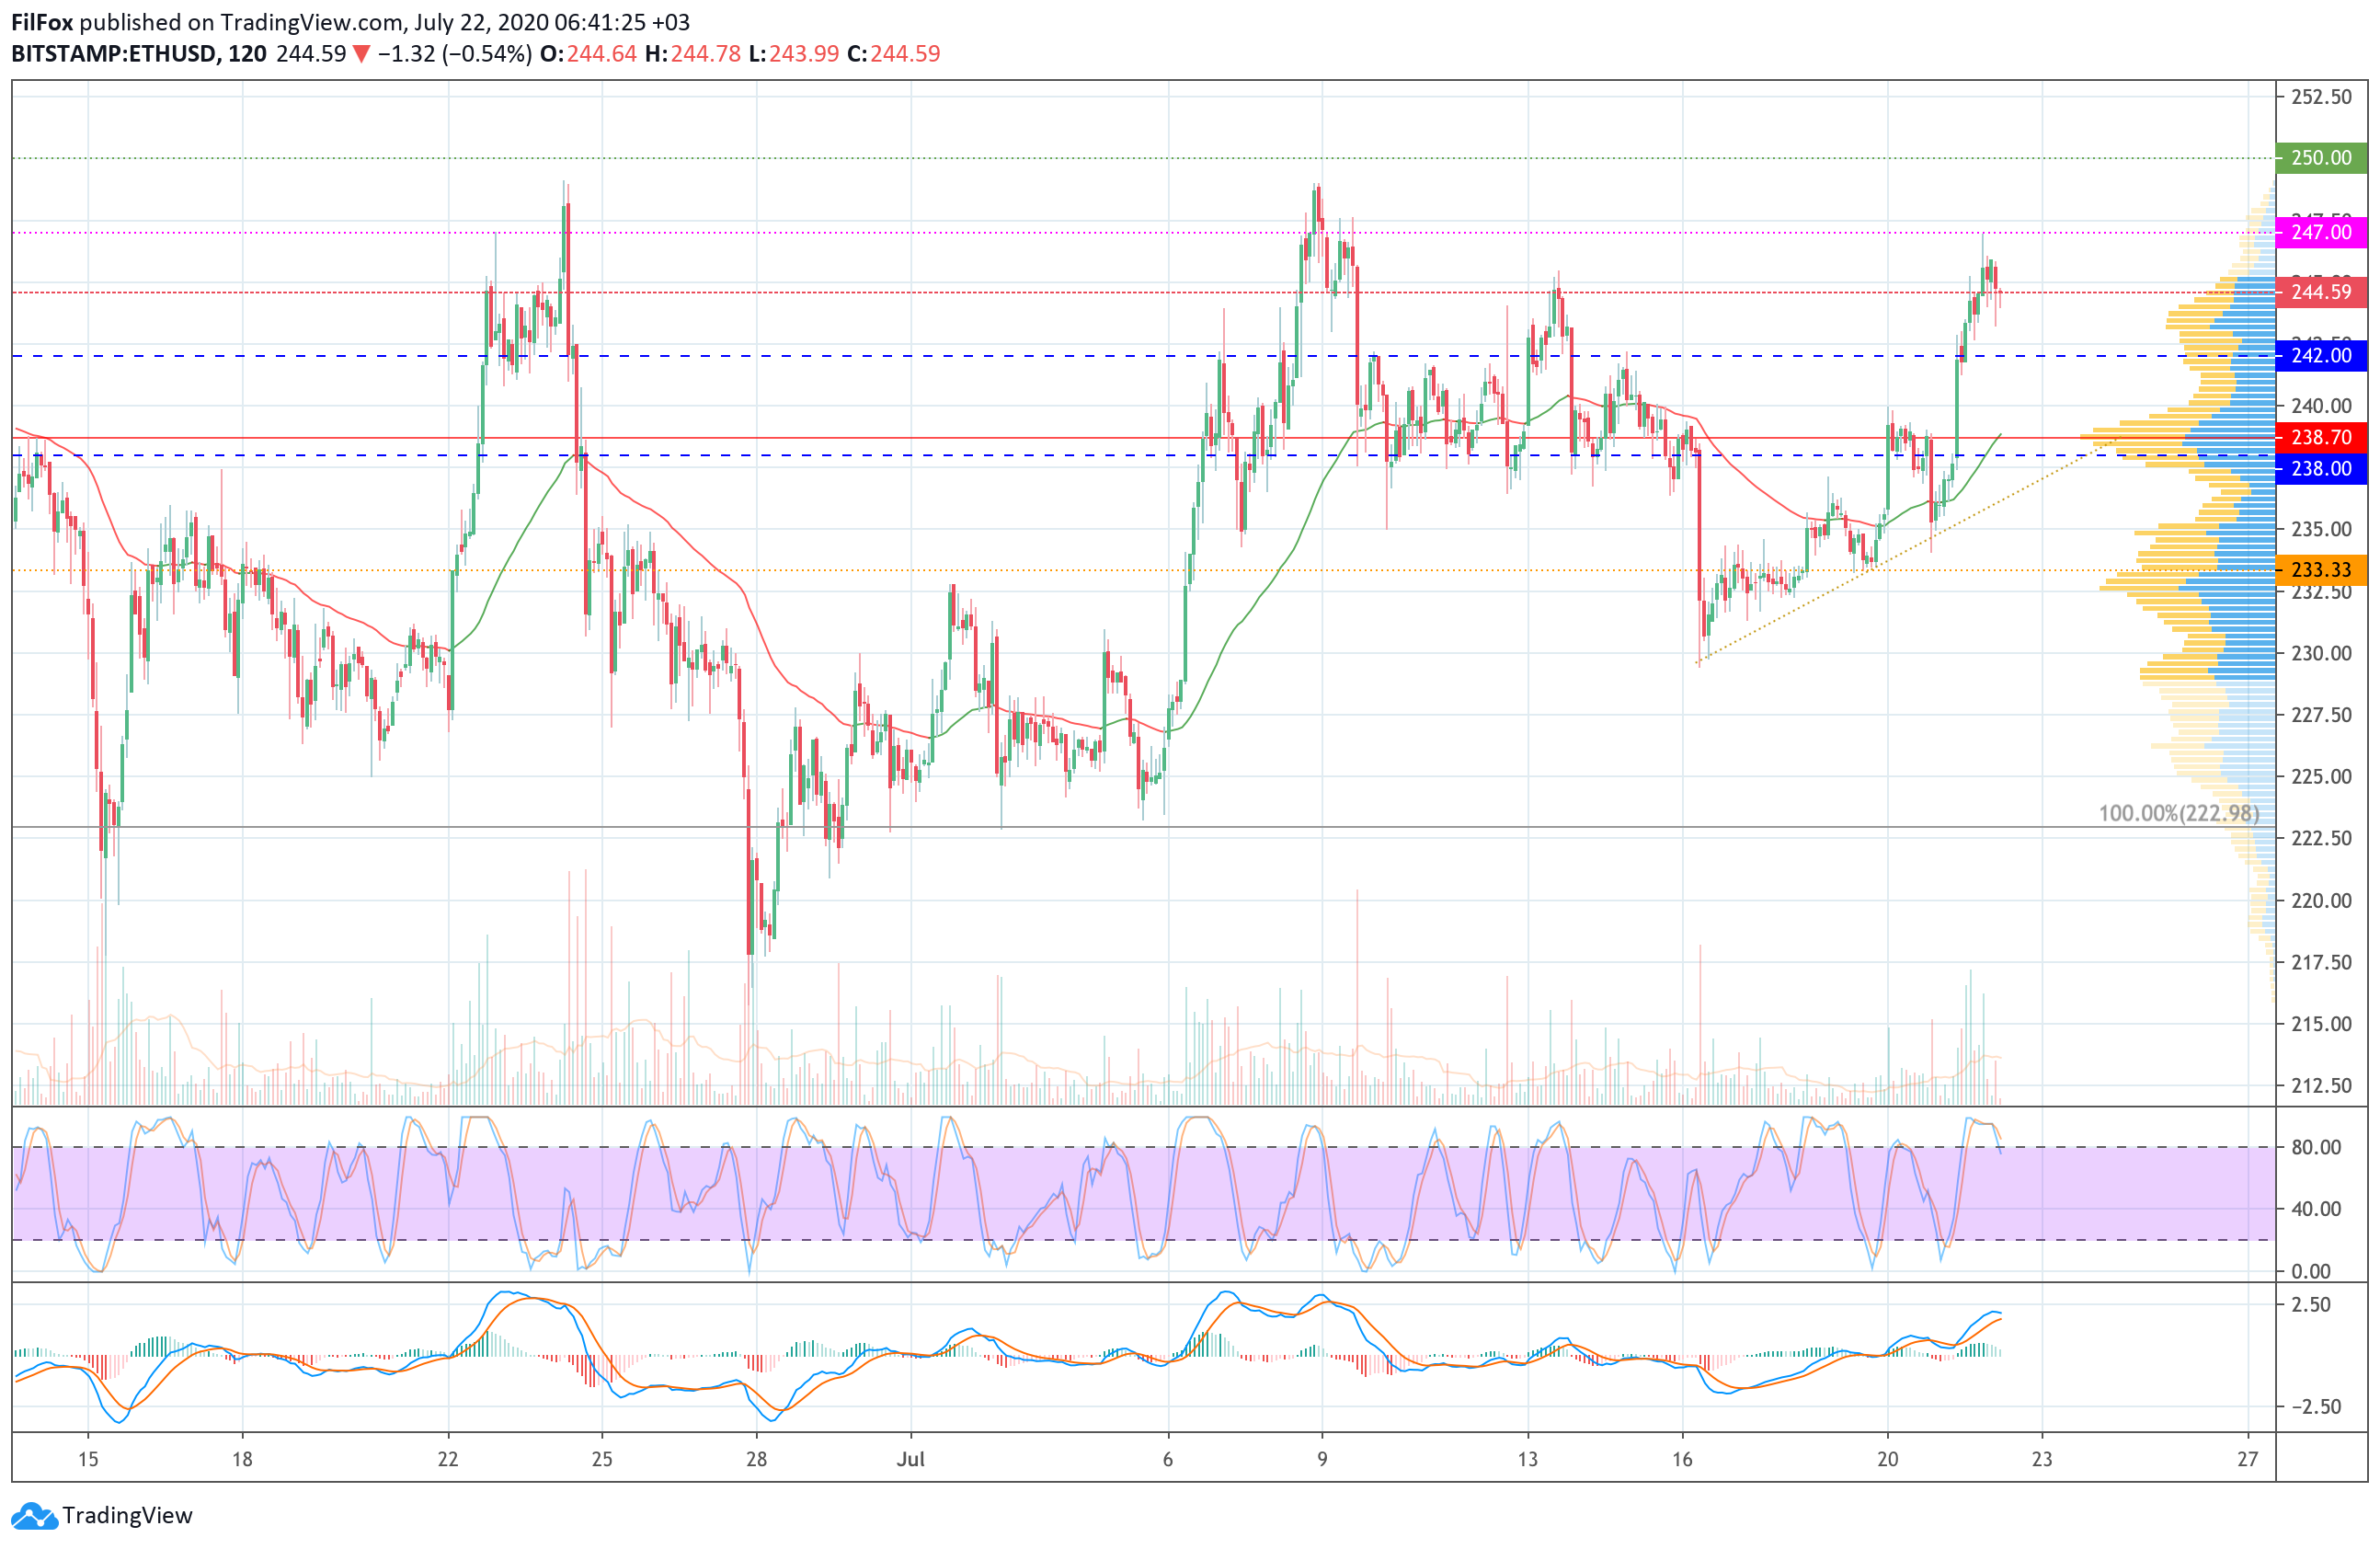
Yesterday, buyers managed to gain a foothold above blueside corridor and at the end of the day test the resistance of 247.00 USD. At night, the price rolled back a little, but has not yet reached the nearest support level, which is at 242.00 USD.
Most likely, today the price of ether will test the upper limit of the blue range, and if it stops the rollback, then a recovery to the July maximum of 250.00 USD may soon be possible.
If the bears push through the upper border of the side corridor, then the rollback may reach the POC line (238.70 USD).
XRP / USD
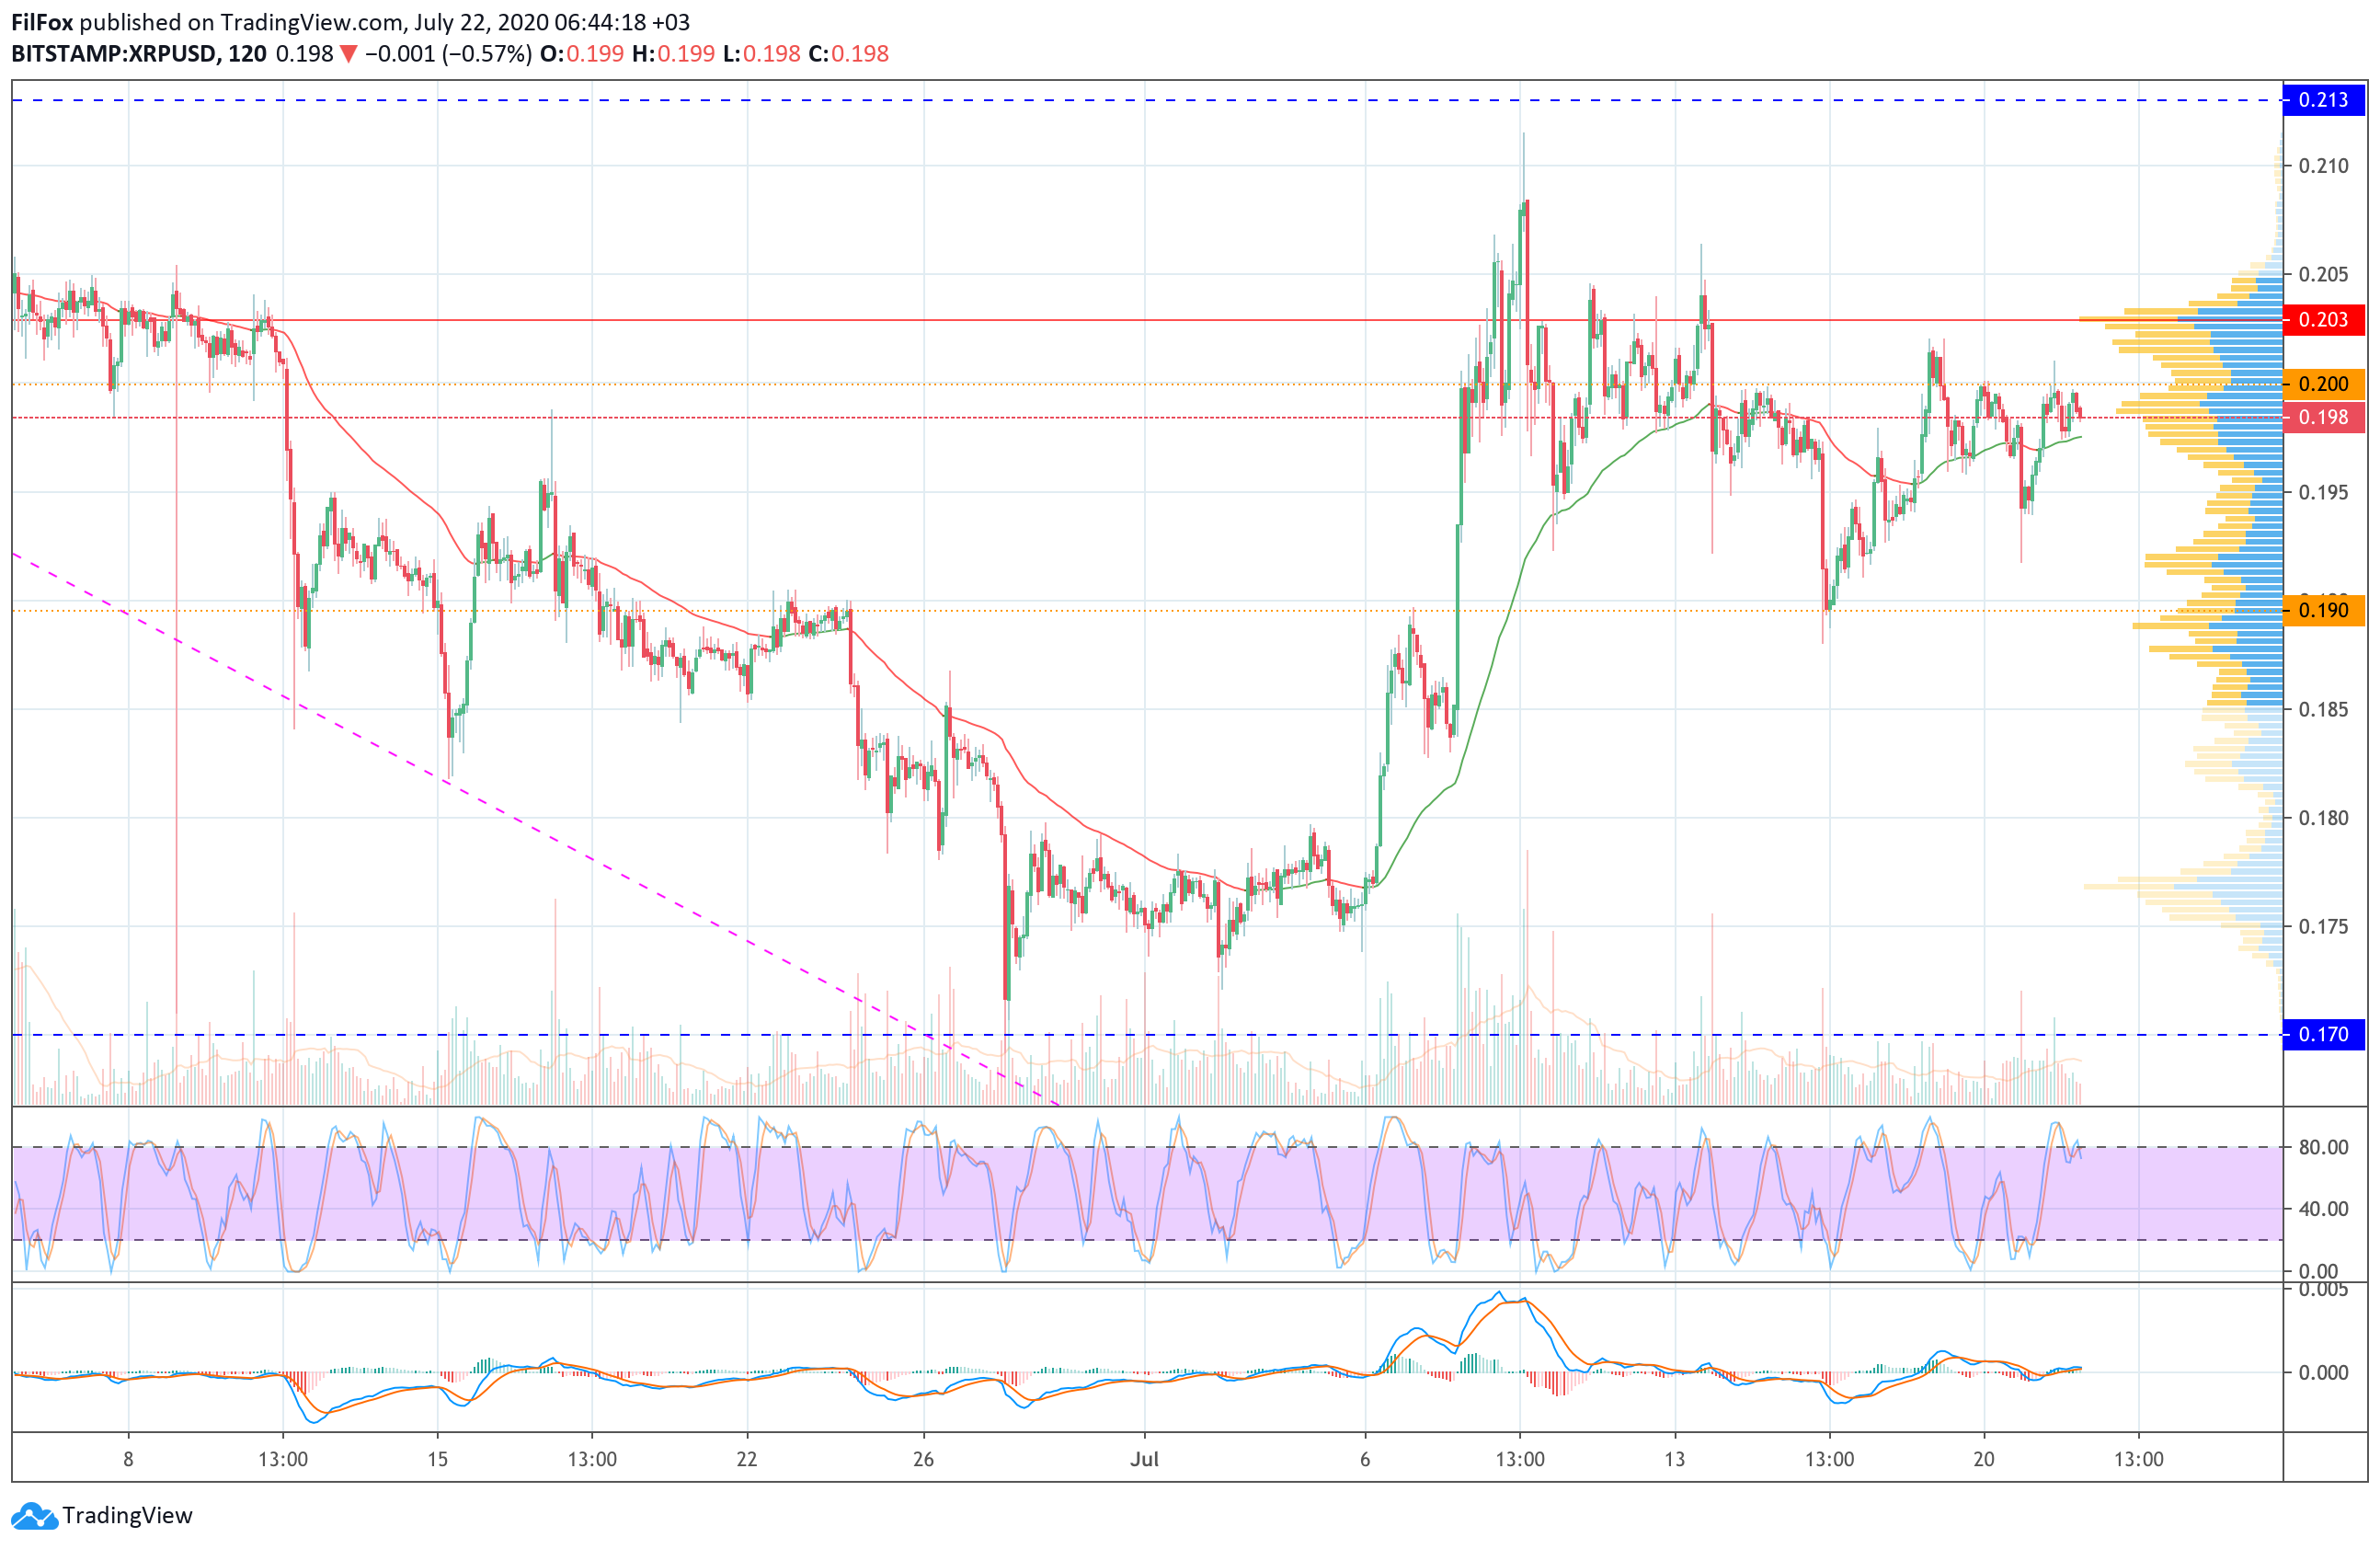
Yesterday buyers were able to continuerecovery, but growth dynamics turned out to be quite sluggish. The pair broke through the psychological level of 0.200 USD, and buyers no longer had the strength to continue growing towards the POC line area (0.203 USD).
Until this morning, the couple settled down in a narrowsideways range between the average price level and resistance 0.200 USD. If during the day the bulls increase their pressure, they will break through the Point Of Control indicator line (0.203 USD) and continue to grow to the resistance area of 0.213 USD.
If the bears increase pressure and knock the pair out of the sideways range with support in the form of the two-hour EMA55, then the decline will reach support at 0.190 USD.
* All price values are based on data from the BitStamp exchange


